Chalcone Based Colorimetric Sensor for Anions: Experimental and TD-DFT Study
Adita Silvia Fitriana
1, Harno Dwi Pranowo
1,2, and Bambang Purwono
1,* 1Department of Chemistry, Faculty of Mathematics and Natural Sciences, Universitas Gadjah Mada Sekip Utara PO BOX BLS 21 Yogyakarta 55281, Indonesia
2
Austrian-Indonesian Centre for Computational Chemistry, Department of Chemistry
Faculty of Mathematics and Natural Sciences, Universitas Gadjah Mada, Sekip Utara, Yogyakarta 55281, Indonesia
Received August 10, 2015; Accepted December 1, 2015
ABSTRACT
The interactions between sensor chalcone of 3-(4-hydroxy-3-methoxyphenyl)-1-phenyl-2-propen-1-one(1)and anions (F–, Cl–, Br–, CN–, CO3
2–
, and SO4 2–
) have been experimentally and TD-DFT theoretically investigated. Sensor (1) showed a naked-eye detectable color change from yellow to red upon addition of F–, CO3
2–
, CN–, and SO4
2–
anions in DMSO, whereas no significant color change was observed upon addition of Cl–and Br–anions. The interaction models were predicted by optimizing (1)-anion complex using DFT/B3LYP method. Optimized(1)-anion complexes showed that sensor(1)was deprotonated by CO3
2–
, CN–, F–, and SO4 2–
. The formation of deprotonated sensor (1)– was responsible for the colorimetric signaling. Absorption spectra of neutral and deprotonated sensor were calculated using TD-DFT method. The calculated spectra were in good agreement with experimental results.
Keywords:chalcone; anion sensor; DFT; colorimetric
ABSTRAK
Interaksi antara sensor chalcone dari 3-(4-hidroksi-3-metoksifenil)-1-fenil-2-propen-1-on(1)dan anion (F–, Cl–, Br–, CN–, CO3
2–
, and SO4 2–
) telah dipelajari secara eksperimen dan teori TD-DFT. Sensor (1) menghasilkan perubahan warna yang dapat diamati langsung dari kuning menjadi merah terhadap penambahan anion F–, CO3
2– , CN–, and SO4
2–
dalam pelarut DMSO sedangkan penambahan anion Cl– dan Br– tidak menghasilkan perubahan warna. Prediksi model interaksi dilakukan dengan melakukan optimasi geometri kompleks (1)-anion menggunakan metode DFT/B3LYP. Hasil optimasi kompleks(1)-anion menunjukkan bahwa sensor(1)mengalami deprotonasi oleh anion CO32–, CN–, F–, dan SO42–. Perubahan warna yang terjadi disebabkan oleh terbentuknya sensor yang terdeprotonasi(1)–. Prediksi spektra absorpsi sensor netral dan bentuk terdeprotonasi dilakukan dengan metode TD-DFT. Spektra hasil prediksi sesuai dengan hasil eksperimen.
Kata Kunci:kalkon; sensor anion; DFT; kolorimetri
INTRODUCTION
The development of anion sensor has gained much attention, especially sensor based on colorimetric signaling. Colorimetric signaling like a direct naked-eye detectable color changing provides an easy to use sensor with high sensitivity and selectivity [1-3]. Most of the sensor-anion interactions are based on hydrogen bonding interaction and some of them are followed by sensor deprotonation [4-6]. Furthermore, the chemosensor sensing mechanisms have been suggested as intramolecular charge transfer (ICT) [7], photoinduced electron transfer (PET) [8], excited states proton transfer (ESPT) [9], and metal-ligand charge transfer (MLCT) [10].
Chalcone derivative, 3-(4-hydroxy-3-methoxy phenyl)-1-phenyl-2-propen-1-one (1), is promising
for proton donating in hydrogen bonding interaction and its conjugation system through phenol ring and enone group [11-12]. In previous study, (1) showed the sensing abilities for CN– and CO3
2–
in ethanol with the change in color from yellow to red [13]. However, interaction models between (1) and anions have not been determined yet and no calculations about
(1)-anion interaction have been reported.
sulfoxide (DMSO). The anions were obtained from sodium salts, purchased from E. Merck.
Instrumentation
All spectroscopic measurements were recorded on Shimadzu 1800-Series spectrophotometer in the wavelength range of 250-700 nm with a quartz cuvette of 1 cm path length at room temperature. Theoretical calculations were carried out using Gaussian 03 software package. Geometry optimizations were performed using DFT method with the hybrid B3LYP functional and 6-31G(d,p) basis set. The spectroscopic properties were studied by performing time dependent DFT (TD-DFT) method.
Procedure
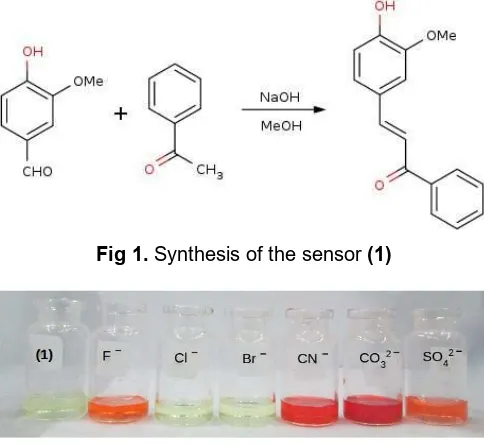
Synthesis of sensor (1)
Sensor (1), 3-(4-hydroxy-3-methoxyphenyl)-1-phenyl-2-propen-1-one, was prepared by the Claisen-Schmidt condensation between acetophenone and vanillin in the presence of sodium hydroxide in ethanol as previously reported [13]. The 3-(4-hydroxy-3-methoxyphenyl)-1-phenyl-2-propen-1-one was obtained as a yellow solid (yield 38%). 1H-NMR (500 MHz, CDCl3) δ (ppm): 3.96 (s, 3H, -OCH3), 5.99 (s, 1H, -OH),
6.96 (d, 1H, Ar), 7.13 (d, 1H, Ar), 7,22 (d-d, 1H, Ar), 7.37 (d, 1H, J = 15 Hz, =CH), 7.50 (t, 2H, Ar), 7.58 (m, 1H, Ar), 7.75 (d, 1H,J = 15 Hz, =CH), 8.01 (d, 1H, Ar). MS relative intensity (m/z): 254 [M+, base peak], 105, 77, 51.
General spectroscopic studies
Stock solution of the sensor (1)(1.0 × 10⁻³M) was prepared in DMSO while anions (1.0 × 10⁻² M) was prepared in distilled water. These solutions were used for all spectroscopic studies. For spectroscopic titrations, required amount of the sensor (1) (2 mL) was taken directly into cuvette and spectra were recorded after successive addition of anion (20 μL) by using micropipette.
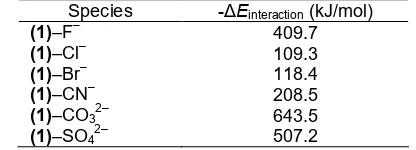
Fig 2.Colorimetric signaling for sensor(1)(1.0 × 10⁻³M in DMSO) with addition of one equivalent of different anions (1.0 × 10⁻³M in water)
), and sensor (1)-anion complexes were performed using DFT/B3LYP/6-31G(d,p). Interaction energy (ΔEinteraction) of sensor (1)
-anion complex was calculated by taking the difference between the energy of sensor (1)-anion complex (E[(1)...A-]) and the total energy of sensor (1) (E(1)) and anion (EA-) [18]. Absorption properties and the
transition energy of (1) and (1)– were calculated using TD-DFT method at the B3LYP/6-31G(d,p) level based on the optimized geometries. All calculations were performed in the gas phase.
RESULT AND DISCUSSION
Sensor (1) was synthesized by simple condensation method according to Fig. 1 and the molecular structure was established from spectroscopic studies. The recognition properties of the sensor (1)
towards different anions were studied by naked-eye experiment and UV-Vis spectra.
In naked-eye experiment, the yellow of the sensor
(1)becomes red upon addition of equivalent amount of F–, CN–, and CO3
2–
to the sensor(1) (Fig. 2). Similarly, a detectable color change from yellow to orange was observed with sensor (1) in presence of SO4
2–
Fig 3. UV-Vis spectral of sensor (1) (1.0 × 10⁻⁴ M in DMSO) with absence and presence of one equivalent of different anions (1.0 × 10⁻²M in water)
Fig 4. UV-Vis spectral change for (1) in addition of CO3
2–
anion at different concentration
Table 1. The geometrical parameters for (1)-anion complexes at the DFT/B3LYP/6-31G(d,p) level
Species r(O–H) (Å) r(H...A) (Å) θO–H...A (°)
(1) 0.971 -
-(1)–F– 1.592 0.965 170.8
(1)–Cl– 1.051 1.867 164.1
(1)–Br– 1.031 2.049 161.9
(1)–CN– 1.735 1.113 172.5
(1)–CO32– 6.252 0.968 180.0
(1)–SO42– 35.561 0.968 110.9
Table 2. The interaction energies for (1) and different anions at the DFT/B3LYP/6-31G(d,p) level in gas phase
Species -ΔEinteraction(kJ/mol)
(1)–F– 409.7
Spectrophotometric study, the UV-Vis absorption spectra of sensor (1) (1.0 × 10⁻⁴ M) were recorded in absence and presence of equivalent amount of different anions in DMSO. The UV-Vis spectra of the free sensor
(1) showed a broad absorption with λmaxat 367 nm (Fig.
3). On addition of F–, CN–, CO32–, and SO42– to sensor
(1) solution, the sensor peak at 367 nm decreases with the appearance of new broad peak with λmaxat 507 nm,
while addition of Cl– and Br– does not produce the spectral change.
Spectrophotometric titrations were carried out in DMSO at 1.0 × 10⁻⁴M concentration of sensor(1) upon the addition of incremental amounts of CO3
2–
. As the increasing CO32–concentration, the absorbance intensity
of (1) peak at 367 nm gradually decreases and the absorbance intensity of a new peak for (1)– increases because of the higher (1)–form in the system [16]. The
higher CO3 2–
concentration, the more basicity of CO3 2–
in the system, is in consequence the easier CO3 2–
to deprotonate sensor (1) (Fig. 4). The spectral changes with the formation of isosbestic point at λmax 420 nm
indicated the formation of species between the sensor
(1)and(1)–.
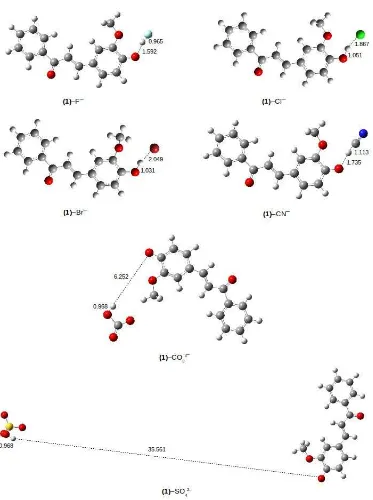
In order to support our experimental findings, structural optimization of sensor(1)and its anions were performed at B3LYP/6-31G(d,p). Geometry optimization provides some information about geometrical parameters of (1)-anion complexes (Table 1). Geometry optimization of (1)-anion complex was carried out by assuming the sensor active site on phenol hydroxyl group. As shown in Table 1 and Fig. 5, the O–H bond are elongated (>0.4 Å elongation) by F–, CN–, CO3
2–
, and SO4 2–
. It indicates the O–H bond breaking and the formation of deprotonated sensor(1)–, which is responsible for the colorimetric signaling [6]. The O–H bond breaking results in the intermolecular proton transfer (IPT), in which H+ moves close to F–, CN–, CO3
2–
, and SO4 2–
to form (1)––HA complexes. However, in Cl– and Br–, O–H bond distance only slightly elongated (0.08 and 0.06 Å, respectively). It suggests the interaction between sensor(1) and Cl– or Br– only through hydrogen bonding and no deprotonated sensor formation [14].
Interaction energy of (1)-CO3 2–
is higher than others, which is in good agreement with the experimental result. Interaction of (1)-CO3
2–
Fig 5.Geometries of(1)-anion complexes at the DFT/B3LYP/6-31G(d,p) level
Table 3. The absorption wavelengths (λabs), the oscillator strength (f), and assignment (coefficient) for(1) and(1)
– in gas phase at the TD-DFT/B3LYP/6-31G(d,p) level
Absorption Species
λabs(nm) F Assignments Exp
a
(nm)
(1) 351 0.63 H → L (0.63) 367
(1)– 487 0.54 H → L (0.58) 507
H → L+1 (-0.12) H → L+2 (0.20)
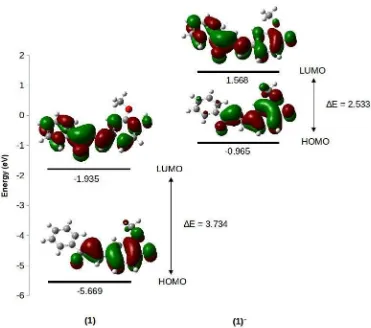
Fig 6.HOMO and LUMO diagrams for(1)and(1)–at DFT/B3LYP/6-31G(d,p) method
Generally, the higher interaction energy, the more significant is in colorimetric signaling (Fig. 2). However, the predicted interaction energies of (1)-SO4
2–
, (1)-F–, and (1)-CN– are slightly different with the experimental results, colorimetric signaling of (1)-CN– is higher than
(1)-SO4 2–
and(1)-F–. It is consider that there are different condition between experimental analysis and theoretical calculations. Hydration effect of anion plays an important role in the sensor-anion interactions [15].
The absorption spectra of sensor (1) change in addition of F–, CN–, CO3
2–
, and SO4 2–
because of the intermolecular proton transfer (IPT) between sensor and anion to form (1)–. Therefore, the (1)– was used for predicting the absorption spectra of sensor after the addition of those anions. The absorption spectra for (1)
and (1)– at TD-DFT/B3LYP/6-31G(d,p) level are presented in Table 3.
The predicted absorption spectra of (1)– are in good agreement with the new peak formation on the experimental results, revealed the sensor(1)–form is the cause of colorimetric signaling in (1)-anion interactions. The predicted absorption spectra show bathochromic shift between(1)and(1)–.
Frontier Molecular Orbitals Analysis
The frontier molecular orbitals (FMOs) can be used to analyze the electronic transition. The major electronic transitions for(1)and(1)–are transitions from HOMO to LUMO, which corresponds to a π→π* excitation. As shown in Fig. 6, HOMO-LUMO for(1) is similar with (1)–. The HOMO electron density for (1)
and(1)–are localized in methoxyphenol ring and enone group, while the LUMO are spread over the conjugated sensor(1). The results reveal the intramolecular charge transfer (ICT) through the systems. The HOMO→LUMO excitation causes the electron density redistribution, resulting in an increasing the acidity of hydroxyl group in excited state (S1). An increasing
acidity of hydroxyl group leads the deprotonation for
(1). After the deprotonation process, the ICT becomes easier and the large bathochromic shift produces in UV-Vis spectra [17].
According to Fig. 6, deprotonation causes the decrease of HOMO-LUMO energy gap. Energy gap of
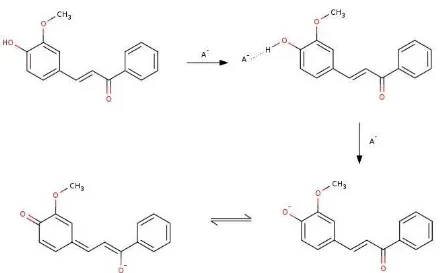
Fig 7.Interaction model between sensor(1)and anions
The suggested interaction model between sensor
(1) and anions is shown in Fig. 7. The formation of O– H...A– hydrogen bonding precedes the intermolecular proton transfer (IPT), at the certain level of anions (F–, CN–, CO3
2–
, and SO4 2–
). The formation of deprotonated sensor(1)–causes the colorimetric signaling [17].
CONCLUSION
We have synthesized and represented the use of chalcone derivative,(1), as anion sensor. Chemosensor
(1) showed a dramatic color change from yellow to red/orange upon addition of CO3
2–
, CN–, F–, and SO4 2–
anions. This interaction model, based on theoretical calculations, is known as the intermolecular proton transfer (IPT) which leads to the formation of(1)–. It was revealed with an agreement of (1)– prediction spectra and the new peak formation in experimental result. The FMOs analysis indicates intramolecular charge transfer (ICT) through(1)–. Deprotonation decreases the HOMO-LUMO energy gap, which correlates to the bathochromic shift in UV-Vis spectra.
ACKNOWLEDGEMENT
This research was supported by the Grant from Penelitian Unggulan Perguruan Tinggi (PUPT), Universitas Gadjah Mada with contract number: LPPM-UGM/374/LIT/2014 date 3rdMarch 2014.
REFERENCES
1. Reena, V., Suganya, S., and Velmathi, S., 2013,J. Fluorine Chem.,153, 89–95.
2. Chen, H., Sun, Y., Zhou, C., Cao, D., Liu, Z., and Ma, L., 2013,Spectrochim. Acta, Part A, 116, 389– 393.
3. Liu, X-M., Zhao, Q., Li, Y., Song, W-C., Li, Y-P., Chang, Z., and Bu, X-H., 2013, Chinese Chem. Lett., 24 (11), 962–966.
4. Yadav, U.N., Pant, P., Sharma, D., Sahoo, S.K., and Shankarling, G.S., 2014, Sens. Actuators, B, 197, 73–80.
5. Marini, V.G., Zimmermann, L.M., and Marchado, V.G., 2010,Spectrochim. Acta, Part A, 75 (2), 799– 806.
6. Jin, R., 2012,Theor. Chem. Acc., 131, 1260–1270. 7. Kumari, N., Jha, S., and Bhattacharya, S., 2011,J.
Org. Chem., 76 (20), 8215–8222.
8. Thiagarajan, V., Ramamurthy, P., Thirumalai, D., and Ramakrishnan, V.T., 2005, Org. Lett., 7 (4), 657–660.
9. Peng, X., Wu, Y., Fan, J., Tian, M., and Han, K., 2005,J. Org. Chem., 70 (25), 10524–10531. 10. Vadavi, R.S., Kim, H., Lee, K.M., Kim, T., Lee, J.,
Lee, Y.S., and Lee, M.H., 2012, Organometallics, 31 (1), 31–34.
12. Shan, Y., Liu, Z., Cao, D., Sun, Y., Wang, K., and Chen, H., 2014,Sens. Actuators, B, 198, 15–19. 13. Anggraini, S., 2012,Bachelor Thesis,Department of
Chemistry, Universitas Gadjah Mada, Yogyakarta, Indonesia.
14. Steiner, T., 2002,Angew. Chem. Int. Ed., 41 (1), 48– 76.
15. Wong, M.W., Xie, H., and Kwa, S.T., 2013, J. Mol. Model, 19 (1), 205–213.
16. Jin, R., Sun, W., and Tang, S., 2012, Int. J. Mol. Sci., 13 (9), 10986–10999.
17. Jin, R., and Irfan, A., 2012,Comput. Theor. Chem., 986, 93–98.