EXAMINING THE RELATIONSHIPS
BETWEEN CORRUPTION INCIDENCE, INDEBTEDNESS, AND POVERTY FROM A GLOBAL AND
REGIONAL PERSPECTIVE
Muyanja Ssenyonga
Intisari
Artikel ini mencoba melihat hubungan antara korupsi, utang, dan kemiskinan berdasarkan data subregional dan global. Dengan menggunakan analisis korelasi, ditemukan adanya korelasi negatif yang signifikan dan kuat antara korupsi dan prevalensi kemiskinan. Tingkat korupsi suatu negara, seperti yang dinyatakan dalam Corruption Perception Index (CPI), berkaitan dengan kesejahteraan sosial negara itu yang diwakili oleh Human Development Index. Negara berkembang yang miskin cenderung lebih tinggi tingkat korupsinya dibandingkan dengan negara industri yang kaya. Berdasarkan data Asia Pasifik, jelas tampak hubungan yang negatif antara kemiskinan dengan korupsi. Korelasi yang negatif ini juga tampak dalam hubungan antara korupsi dengan pertumbuhan ekonomi. Tingkat utang luar negeri suatu negara menunjukkan hubungan yang positif dengan tingkat kemiskinan, sedangkan tingkat utang berkorelasi negatif dengan korupsi. Namun, investasi langsung pihak asing akan mengurangi kemiskinan karena kedua variabel itu berkorelasi negatif. Pemberantasan korupsi seharusnya mempertinggi pertumbuhan ekonomi dan meningkatkan efektivitas penggunaan utang luar negeri, yang akhirnya dapat mengurangi tingkat kemiskinan.
Kata kunci: korupsi, investasi, kemiskinan, Human Development Index
Introduction
of written documents such as press reports, judicial records, records from anticorruption agencies and survey data. At best such reports can only be descriptive making it difficult to quantify them for research purposes. Another relatively more objective measure of the incidence of corruption is the Business International Index (BII), which is based on surveys of experts or consultants undertaken during the 1980-1983 period by Business International, now a subsidiary of Economists Intelligence Unit (Quah, 1999). The BII index ranks Countries from 1 to 10 according to the degree to which business transactions involve corruption or what are considered questionable payments, with 10 representing complete absence of corruption, and zero otherwise. One of the measures of the degree of corruption in a particular state is depicted by the Global Competitive Report Index (GCRI). The report is based on a 1996 survey of firm managers, who were asked questions in the host countries where they invest about different aspects of competitiveness in host Countries. Perception of corruption was rated on a one to seven scale according to the extent of irregular, additional payments connected with import and export permits, business licenses, exchange controls, tax assessments, police protection and loan applications.
a particular country engage in questionable payments in the process of carrying out their export business. What is notable however is that there is high correlation between the different measures of corruption, which implies that one does not need to use all such measures to ensure reliable estimates (Adi Tella, 1997).
The account on Bangladesh, the worst performer in the 2002 corruption transparency international report (Transparency International, 2002) is no less dramatic for, according to Jaya Wickram in Quah (1999). People of Bangladesh have to contend with a list of activities for which questionable payments are the order of the day. These encompass payments for admission of children into school, securing admission into the hospital, securing the false recording of land sale at lower prices, in securing bank loans, obtaining electricity connection, to receive lighter water bills, to lower withholding tax assessment on house and property, obtaining trade licenses, paying court or opponents lawyers, judges, and police.
African countries are not free from this malady either. In any case the seriousness of the pandemic is so unnerving to any person, or institution that out of altruism responds to calls for rendering a hand to a continent that is immersed in poverty. Nigeria, the most populous country on the continent, stands out as one of the countries with the highest corruption level in the world, registering 0.69 out of 10 on the Business International Index (BII) in 1996. There was some improvement in 1997 when the same country registered BII of 1.76, yet still retained its position as the most corrupt nation on earth. This is a country with level of corruption growing exponentially with the oil revenues. Kenya ranked third scoring 2.21, while Cameroon pulled in the sixth position with 2.46. The gravity of the situation sinks in, when one realizes that basing on the World Development Indicators, such countries that are heavy-weights in corruption level perform poorly in income per capita, public expenditure on education, and income per capita growth. A comparison is made between Finland with the lowest corruption incidence and Nigeria having one of the highest corruption levels in the world. Finland with a score of 10.0 on the Transparency International Corruption Index (2000) spent 7.6 percent of GNP on education in 1996, expended an average of 5.7 per cent of GDP on public health, enjoyed per capita growth of 5.9 per cent and her population lavishes on an eye-popping income per capita (1997) of US$24,790. Nigeria, on the contrary, scored 1.2 on the CPI index, spent a mere 0.9 per cent of GNP in 1996 on education, spent just 0.2 of her GNP on public health in the 1990-1997, registered GNP per capita growth of 2.1 per cent and her citizens languished on a mere per capita income of US$280. Indonesia on the other hand scored 1.7 on the CPI 2000 index, spent 1.4 per cent of GNP on education in 1996, made available a mere 0.7 of GDP for public health expenditure in the 1990-1997 period, registered per capita growth of 2.6 in 1997, her population made off with per capita income of US $1,110.
linking aid disbursement to improvements on the anti-corruption drive. Essentially, corruption has been added to the least of hindrances to economic, social, and intellectual development.
Section two looks at the brief literature review on corruption and poverty, which is followed by section three that tackles the methodology used to analyze the relationship, between the incidence of corruption and poverty. Section four presents and discusses the analysis results, and section five draws the conclusion along with policy implications.
Literature Review
The incidence of corruption has been attributed to a variety causes. The underlying causes of corruption, according to Mauro (1998), are any policies that create economic rent by conferring to state officials or the authority to determine which members of the private sector have access to scarce resources and facilities. Such polices take the form of trade restrictions on exports and imports, which curtail the degree of openness of the economy. In this light, Sandholz and Koetzle (2000) and Ades and Di Tella (1999) found out that trade restrictions, indicated by the percentage of imports in GDP, negatively influences the corruption index. Trade restrictions offer licensing opportunities to bureaucrats as well as create fertile ground for monopolistic rent among traders, both aspects congenial for corruption. Hurdles to trade manifested in form of the distance of the country from export markets provide corruption opportunities. High transport costs shelter domestic producers from foreign imports, and provide opportunities for exporters to demand for subsidies in exporting their merchandize (Sheifer and Vishny, 1993; Bardhan, 1997; Becker 1983; Liu and Erlich, 1999).
and domestic businessmen to indulge in corruption. A case in point is Nigeria. Ades and Di Tella (1999) found out that the US$2-US$34 oil price increase in 1973-1981 period offered a 17-fold increase in national income, fueled an upsurge in corruption among bureaucrats and politicians through increased construction and importing sprees. This pre-supposes that countries that are rich in mineral wealth are susceptible to high levels of corruption. Some authors of the liberal economics school attribute corruption to an elaborate, overreaching state system of regulations on economic activities. The incidence of corruption is supposedly higher in centralized, hilly regulated command economies than in free market democracies (Quah, 1999; Fombad, 1999; Mauro, 1998).
The existence of customs, which either implicitly or otherwise, make corrupt practices acceptable to the society. The practice of gift-exchange, which is a social norm in conducting a business transaction in developing countries, considering tips as routine transactions among Africans, and high level of monetization. Not far removed from the foregoing is the level of Ethno Linguistic Fractionalization (EFL), the measure of the heterogeneity of the society. This is the probability that two persons drawn at random from the countrys population will not belong to the same ethno linguistic group, implying that the higher the multi-linguistic composition of the society, the higher the ratio. As Mauro (1995) contends, fractionalization of society increases the danger of the economy being divided out among dominant ethno linguistic groups, each of which regard their responsibility to the ethnic group far more important than to the national interest, and thus has to prove their worth through pork-barrel projects and filling key positions with members of the same ethnolingusitic background. Since there is no certainty that any of the ethnolinguistic group will continue to serve in similar capacities in future, officials resort to plunder of resources under their control as much as they can, while the chance is still open. There are no better references for the correlation between a countrys Ethnolinguistic Fractionalization Index of Nigeria than Zaire. Nigeria registers ELF of 0.73 and has a corruption Index of 3 on the Business International Index (BII), while Zaire registers an ELF of 0.9 and has a BII corruption Index of 1 which are indications of very high corruption levels.
activities such as intimidation. Thus the fewer the firms in an economy the higher the level of corruption (Lui and Erlich, 1999; Mauro, 1998).
There are indications that growth at lower level of a countrys development is more likely to generate more opportunities for corruption than otherwise. The theoretical support of such a proposition is that as the economy enters the transition stage of its development, there is an existence of dual track system with part of the national output being delivered at controlled prices, and the rest allowed to be sold at market prices. At such a stage opportunities for corruption are immense due to the cacophony of regulations, licenses, and permits required which entrenches the bureaucracy. With time however, inefficiency aggravates leading to efforts to improve the situation, which sets in the next stage-the privatization of state enterprises. The privatization of state owned enterprises gives rise to opportunities for public officials by demanding kickbacks from crony capitalist buyers of such enterprises and contractors. Privatization contrary to expectations may not reduce corruption unless the political-economic system that induces the creation of bribery collection is done away with. This is because privatization by propelling the economy towards a higher growth path, promotes higher income thereby widening corruption opportunities for bureaucrats. This is one reason why corruption levels intensify in developing countries when they register high growth. This implies that at either low levels or higher levels of growth, corruption is found to be rampant because either way corruption opportunities abound, though via different channels. This arises from the fact that corruption practices occur when there are opportunities of exacting rent. Such opportunities are manifested in trade restrictions, tariffs and import quotas, subsidies and tax deductions, price controls, multiple exchange rate practices, foreign exchange allocations schemes, and directed credit schemes. The fact that such policies are common in newly industrializing countries (NICs) and in other low developing countries makes the prevalence of corruption.
an individual or sector can muster, rather than the level of expected returns. This in effect is a precursor to the emergence of a shortage economy, where both public and private monopolies dominate the production and provision of goods and services. The public sector is unable to provide sufficient remuneration for civil servants, which creates the motivation for identifying additional source of income to make ends meet. They do not have to go very far since monopolies play vital roles in the economy, and equipped with monopoly profits, assuage the civil servants purchasing power shortage. Monopolies thus grease the palm of poorly paid state officials to ensure the perpetuation of state of the economic malaise, which is beneficial to them (Quah, 1999).
According to Cadot (1987) the incidence of corruption in an organization is influenced by a high time discount rate (indicative of preference of short term consumption to long term), lower degree of risk-aversion, lower wage rate and the level of the superior officer who must be bribed beyond a certain threshold to cover up lower level corruption. There is an interaction of corruption at different hierarchies of administration in the organization, which through networks set up over time, reinforces and perpetuates the practice. In a poor developing economy, peoples time discount rate is very high since their meager income makes it difficult for them to even afford the basic necessities of life. Preference for the short-term far outweighs the potential benefits that might accrue in the long term. Such conditions offer fertile ground for the exchange of illicit payments in return for serves rendered.
or less similar attribution is made by Raaj Sah (1988), who associates indulgence in corrupt practices with the probability of meeting a corrupt official next time he is involved in some transaction. The higher the level of corruption, the higher the probability of coming across some corrupt official. With time, the practice becomes institutionalized in the culture of the society. On the general level, high corruption level in the current generation positively influences the corruption level bequeathed to the next one, which is why corrupt societies have a higher probability of becoming more corrupt than otherwise (Tirole, 1996). From one generation to the next corruption becomes entrenched in the norms, values, and belief systems of the society, turning what was vice into a virtue as its assumes general acceptability. The situation is aggravated in poor developing countries by the weak law enforcement machinery, which like other institutions is not left unscathed by corruption practices. Instead of acting as an instrument to eradicate the malpractice, law enforcement in developing countries ironically assume the role of protecting corruption outcomes committed by the politically and economically strong section of society. Policies implemented by the government are also strongly influenced by such groups, which is why projects such as education and health that foster and promote social welfare take the backseat while those that are considered easy avenues of theft such as complex turnkey projects, and imports of sophisticated machinery assume greater importance. With less national expenditure going toward projects that promote growth and development, the production capacity of the economy does not increase; in any case it suffers either stagnation or contraction. The foregoing leads to less output, fewer employment opportunities, high employment rate all of which accentuate poverty.
countries invest in human capital as opposed to political capital influences economic growth. An economy can achieve low-level stagnant equilibrium,
stagnant development equilibrium, persistent growth equilibrium, when all agents invest in political capital, in both human and political capital, with investment in the former insufficient to propel the economy to take-off growth, and in human and political capital with investment in the former sufficient to generate self-sustaining growth, respectively.
The bureaucracy in most developing countries is powerful and centralized, which enables it to monitor the way bribes are collected and distributed with sanctions meted out to violators of unwritten corruption sharing regulations. Many an authoritarian government in developing countries have such well organized bribe collection machinery which is tailored toward enriching the ruling elites and their kith and kin without regard to the extent to which such mechanisms derail the growth and development of the economy. Bureaucracy need not be centralized to cause severe economic distortions to the economy. In decentralized political systems, the corruption level tends to have far worse effects on resource allocation as authority to determine the size, and tuft of corruption, becomes far-flung, and hard to control from the center. With more authority devolved to lower administrative units, the replication of corruption collection mechanisms ensues, which increases the leakage of resources as the law enforcement mechanisms are spread thin. The prospects for development suffer as a consequence, making it difficult for the economy to overcome the stranglehold of poverty.
Developing countries are characterized by high import tariffs meant to protect domestic industries, which are in effect avenues for high rent for state officials and domestic producers. It is thanks to such trade regimes that inefficient enterprises continue to operate, channeling out highly prices but poor quality products, create uneconomic national and regional development policies that undermine productivity and market discipline (UNDP, 1997).
executioners, are decisions made by the powerful bureaucracy and politicians. This underlies the apparent tendency for developing countries to prefer complex and costly projects, which are funded by large borrowed loans to small, cheaper ones with far more potential to generate growth and development. Such projects end up becoming ivory towers, leaving behind a legacy of high national debt, which all citizens must repay (UNDP, 1997; Kilby, 1995). With high debt service ratio to contend with, such economies have little option but to borrow more and thus sink deeper into debt, which sets such on a poverty perpetuation spiral.
vicious cycle of high corruption incidence inducing poverty, and impoverished society becomes high susceptible to indulging in transactions that involve the exchange of questionable payments. This is manifested in myriad ways.
Corruption by inducing the deviation of resources from productive activities to those that are considered not requiring volumes of costly documentations such as trade undermines the capacity of the economy to grow and develop. Thus pursuing permit and licenses for establishing factories being laborious and costly drives businessmen way from such ventures into commodity and currency trading which yield higher short-term returns, and require less documentation. Speculative activities also become the focus of investment, as they do not need a lot of documentation and the attendant bribery to state officials. The economy suffers as long term investment shrinks; reducing its capacity to produce which in turn stems economic growth (Mauro, 1995; Quah, 1999; Sheifer and Vishny, 1993). In the long term, businessmen will suffer as the economy contracts, which affects demand for all goods and services. This is more so at lower stages of economic development when the countries hardly have the resources to eradicate the scourge (Acemoglu and Verdier, 1998: 1382). With lower production of essential goods and services, prices skyrocket, which makes them unaffordable by the most vulnerable members of the society. Poverty then intensifies. With lower investment in productive activities, the poor receive ever-diminishing level of social services, as they are unable to pay, pensions decline, public housing programs are slashed, and so is education and health.
men who pay pittances for their crops; find it hard to establish small scale enterprises thanks to intervention by state officials who serve the interests of large enterprises. Denied political equality disgruntled communities resort to acts of sabotage, riots, and insubordination, which increase the risk for investors. The ensuing combination of high corruption and social and political instability is very detrimental to economic growth and development as it forces governments to undertake socially sub-optimal policies (Svensson, 1998; Fredricks and Svensson, 2000; Alesina et al., 1996).
Mauro (1995) finds a negative association between the level of corruption and the investment rate and on the rate of growth. The results are based on surveys on foreign businessmens on a variety of issues concerning their business operations in a particular country. The results maybe thus are biased by the respondents lack of insider knowledge of the local situation, other than the reflection of the real situation. One would argue that there is need for surveys on local businessmen to gauge their responses to similar questions, which could help a lot in removing such bias. Whatever, the case corruption is considered a stumbling block not a facilitator for growth.
the relatives (Ades and Di Tella, 1999). This in the same vein explains why corruption is tolerated in most developing countries whilst it is regarded as menace by the society in developed countries.
Most corruption in developing countries takes the form of depositing lower tax returns than actually collected by state officials. Bribery thus means that projected government revenues in form taxes more often than not end up in the pockets of tax collectors and their bosses. This implies that resources that would be used to improve on social and economic infrastructure are deficient, funds to pay public servants sufficient wages as an incentive to put in more effort go down the drain, creating more room for inefficiency in the entire economy.
Bribery reduces profits on productive investments as compared to rent seeking, which leads to the crowding out of investment by rent-seeking activities. As rent-rent-seeking activities involve sharing what is already produced, the increase in their composition in the economy leads to stagnation and decline. With slowing economic growth by increasing return on rent-seeking relative to productive activities lowers innovation of new products, and enhances the growth of rent-seeking activities (Murphy, et. al., 1993; Murphy, et. al., 1991; Mauro, 1998). With higher and increasing returns on rent-seeking activities than on productive activities, the most capable persons choose careers linked to rent-seeking (legal practice) rather than productive activities (engineering). The consequence is lower growth because the most able persons do not choose to become entrepreneurs and leaving it to second-rate individuals. With more rent-seeking taking the most able persons a country has, government consumption will increase without an equivalent increase in productivity (Murphy, et. al., 1995). With more rent-seeking activity than productive endeavors, production contracts which increases the amount of rent that officials ask for before they render services.
to speak out; allocating funds to defense contracts to a far a larger and costly defense contract other than for building many small rural health clinics; elites preventing the entry of outsiders in the deals which discourages the flow of new ideas and innovation; and preferring striking far distant hard-to-value-deals with foreign companies to domestic ones where malfeasance is easily detected. Such shady deals result into poor quality public infrastructure in most developing countries, which reduces the level of social welfare of the largest section of society. It is common knowledge that public infrastructure projects are shoddy at the very best especially in developing countries so as not to deprive one of tomorrows source of eating. Corruption thus makes the very foundation on which productive activities are based to founder, making it even harder to overcome poverty.
The beneficiary of a bribe may in some cases be influenced by other considerations other than the size of the bribe. This may be the situation in which the briber is preferably the trusted by official (the agent) than others, which reduces the risk of being apprehended. Thus the official who receives the briber may forego a larger bribe for a small one as long as it reduces the possibility of the disclosure of the malfeasance, with the attendant punitive consequences. In such a case therefore corruption contributes to inefficiency by allowing the awarding of a government contract to an insider, who may in any case be an inefficient provider of the service. This explains why bureaucrats attempt to limit the size of those who join their ranks, for the smaller the members of the bureaucrats, the easier rules of the corruption game can be adhered to and deviants identified and punished in monopolistic corruption. Yet lower number of state officials means lower competition in the bureaucracy. Lower competition translates into higher rent, poor service delivery, and lower social welfare.
clients in the private sector translate into higher rents, which the bureaucrats can share. Doubtless such limiting practices are detrimental to the economy as they undermine efficiency. The level of protection for the clients means monopoly profits which reduces the consumers surplus. The purchasing power of the consumer is expropriated by both the producers and the political elites and bureaucrats (Murphy, et. al., 1995; Moorkherjee and Png, 1995).
It is not rare for corruption to be manifested in the awarding of contracts, services, jobs, to close relatives (nepotism) or former schoolmates and acquaintances (favoritism). This is evident in the case of Indonesia, where relatives and cronies of President Suharto had extensive business interests and benefits from privileged access to government contracts (Quah, 1999). In Bangladesh, parliamentarians and government officials including ministers are deeply involved in corruption. So is the Philippines under Ferdinand Marcos, with the record of self enriching himself and his family with US $15 billion from kickbacks from crony monopolies, diversion of government loans and contracts, profits from overpriced goods and construction, un-audited government revenue, through expedient of taking over businesses by decree and diversion of funds from government controlled entities. The case for Mobutu, the former President of Zaire is no less astounding where the former president amassed more than US $6 billion. Botswana is no exception which to its Directorate of Corruption and Economic Crime (DCEC), an anticorruption agency discovered corruption involving politicians including the vice president who awarded his brother three ranches instead of the statutory one (Quah, 1999; Bardhan, 1997; Sardan, 1999). In such cases corruption distorts the economy in terms of sub optimal production of goods and services, poor services and performance on the job arising from the lack of requisite skills by the occupants. The long-term effects of such malpractices are reflected in reduced investment and economic growth.
of the firm that supplies the product or service, or is in collusion with the potential provider with the understanding that the bribe is included in the price for the service or product supplied. This definitely is detrimental to the economy, for it is not only the quality of the service or product supplied that falls short of requirements, but also prices charged are far higher.
In some instances, corruption is used to pre-empt competition. In such cases, the briber pays the law enforcers for example to harass rival firms; to influence tax officials to extort higher payments from rival importers making it difficult for them to compete; and the official owning a firm supplying services or products who imposes an import ban, freezes the awarding of production licenses to new producers (Badhan, 1997; Mauro, 1995). Without any shadow of doubt, such cases of corruption are inimical to economic efficiency as they reduce the number of economic players, reduce level of production, and reduce the available choice of products and services.
Moreover, corruption in form of speed money ends up making it an inbuilt practice, which with time becomes the rule than the exception. Officials over time may cause delays to attract more bribes, which is not only cause distortion, but also induces economic inefficiency in the long run. Thus bribery ends up aggravating the tendency by public officials to demand payment before a service is rendered, which increases the cost of any transaction over time. There is ample evidence of such instances. In Russia officials expect to be bribed to do what they are supposed to do referred to as mzdoimstvo, as well as bribed to do what they are not supposed to do referred to as likhoimstvo. The briber has to ensure that he pays both to get what his transaction through (Bardhan, 1997). This raises the cost of conducting transactions in an economy with the consequence that investment slides which in turn slows the economic growth rate.
is finally sealed. In such cases, however, the briber may not be in position to add to the bribe already paid, which may lead to engage mafia style tactics to ensure the commitment of the public official to the deal. It is apparent, from this that corruption may even lead to other social ills such as kidnapping, hijacking, all of which derail the economy from its long run path to growth and development. Corruption thus may lead to the upsurge of organized crime with its attendant control of legitimate businesses, political influence, and the economy. With such a regime in place, economic activities suffer as production that involves high investment is reduced while that involving speculation takes root. This is the precursor for more underdevelopment and poverty.
The level of corruption in a country adversely affects production. The technology of exhibits increasing returns to scale due to the high fixed cost, is self generating as more corruption practices create more avenues for corruption, and strength in number of corrupt people for the larger the number the less likely one is caught (Sheifer and Vishny, 1993) The implication is that the widespread corruption, one manifestation of rent-seeking by reducing the rate of return on productive activities discourages wealth enhancing activities inducing wealth redistributing activities instead. In any case, more seeking activity reduces the cost of further rent-seeking, sending production further into the doldrums.
readiness and value of project, such demands, which are in any case not tax deductible, may lead to a rethinking of the project. Thus corruption creates delays and may even lead to the abandonment of innovations, which has the effect of undermining the productivity and performance of the economy. Thus by thwarting innovation and establishment of new enterprises corruption deals a fatal blow to efforts toward growth and development, thereby. In India for instance some foreign investors like ENRON, Coca Cola, and others got their fingers burnt thanks to bureaucratic red tape and widespread corruption. Projects stalled, costs skyrocketed, and profits nose-dived. Thus despite the new incentives in form of allowing foreigners to own wholly hotels, airports, pharmaceutical companies and 26 per cent of defense contracts (hitherto a taboo in India) high corruption incidence may delay and even hinder the realization development projects which has the result of slowing the pace of development, thus lengthening the time the largest section of people in developing countries have to endure poverty (Business Week, 2001). The foregoing of new projects has prevents the adoption of new ideas in terms of new products and technology, new production processes, new procedures of production, management, marketing, and distribution, and other spillover effects, which should have elevated economic efficiency. Hence in as much as corruption stands in the way to innovation, it delays investment, curtails growth, and perpetuates underdevelopment and poverty.
One should thus expect education and health to be under funded in corrupt societies due to the fact that concealing graft is harder than in defense and import and export contracts. The impact of minimal investment on education is to reduce the only one of sources available for overcoming corruption, which is educating the public about the evil nature of corruption. This has the implication that corruption becomes institutionalized in the society with the effect that it leaves little room for any measures that are geared toward countering it to succeed. In any case one wonders how a country can develop without developing and providing requisite health services for its human resources. That underscores how detrimental corruption is to development. It is no doubt that developing countries score poorly on education and health expenditures.
Developing countries have rigorous institutions, which are hard to change. This is because any institutions that comes up produces benefits to some groups in an economy, and since the implementers of government policy are bureaucrats, they will resist change as long as it threatens to reduce their sources of bribery. This means that any drives to undertake house cleaning by outsiders is staunchly resisted. This leads to a situation whereby the only way one gets into power is to overthrow the existing power and overhaul the bureaucracy. Certainly, with frequent changes of power instability taxes growth heavily. The effect of corruption on underdevelopment is really a phenomenon of developing economies. Having fragile, institutions, without any checks and balances; frequency of government takeover necessarily translates into higher corruption and underdevelopment.
making it difficult to make any improvements in quality and price, and tax away the populations purchasing power by perpetuating monopoly rents for producers reducing the ability to purchase goods and services.
Hypotheses
1. High corruption incidence is associated with high poverty level
2. High corruption incidence is associated with high indebtedness
3. High poverty level pervasiveness is associated with high indebtedness
Methodology
The research uses two cross-section data sets, the global world data and Asia pacific region data. Data on poverty was based on UNDP Human Development Index 2002, as proxy of poverty. The Human Development Index ranks countries on 0 to 1 rank. With countries having scores closer to one indicating better life expectancy, educational attainment, and adjusted real income. Countries are ranked with countries that have high HDI indices occupying lower positions than those performing poorly on the HDI index. Data on corruption was obtained from transparency international, which ranks countries on a 0 to 10 scale, with countries having lower ranks indicating high corruption perception levels, while those occupying higher positions indicate lower corruption levels.
corruption as the abuse of public office for private gain ranks countries in terms of the degree to which corruption is perceived to exist among public officials and politicians drawing on 15 different polls and surveys from nine independent institutions carried out among business people and country analysts, both residents and expatriates. CPI is a good indicator of the views of the decision-makers on investment and trade issues and the extent to which bribe taking features among the public officials in the 102 countries surveyed (Transparency International, 2002). The sample was 101 after factoring in missing values.
Data on Asia Pacific region comprises of 29 countries in Asia Pacific that are still characterized as developing economies. Afghanistan was removed from the sample because it lacks data on almost all variables. Asian Development Bank data on GDP growth rate, foreign direct investment, Human Development Index, Gini coefficient was used and other macroeconomic variables, meanwhile data on corruption perception index was obtained from transparency international website.
To analyze the relationship between the level of corruption and poverty, the SPSS statistic program was used to compute the correlation between the two variables. Spearman, Kendall, and Pearson correlation methods were used to make the interpretations.
Presentation and discussion of empirical findings
The sample was 101 after eliminating cases with either of the two variables missing.
Table 1
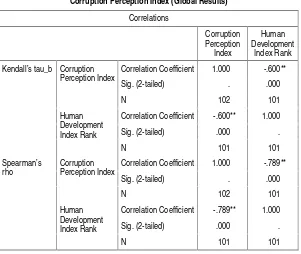
Correlation results between Human Development Index Rank and Corruption Perception Index (Global Results)
Correlations
Correlation Coefficient 1.000 -.600**
Sig. (2-tailed) . .000 Corruption
Perception Index
N 102 101
Correlation Coefficient -.600** 1.000
Sig. (2-tailed) .000 .
Correlation Coefficient 1.000 -.789**
Sig. (2-tailed) . .000 Corruption
Perception Index
N 102 101
Correlation Coefficient -.789** 1.000
Sig. (2-tailed) .000 .
**. Correlation is significant at the .01 level (2-tailed)
because of lack of consistent data, Afghanistan was dropped from the data set because if it didnt have data on almost all the variables.
Presentation of findings
ya
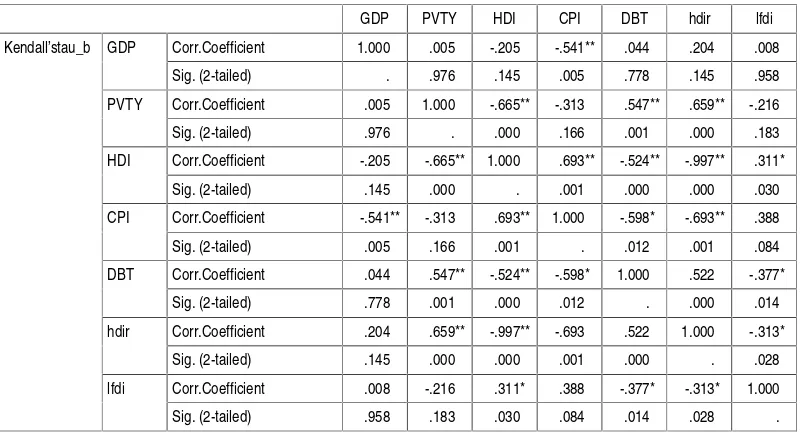
Kendall’s correlation results on economic growth(GDP), Corruption, poverty (PVTY), human development index (HDI and hdir), indebtedness (DBT), and foreign direct investment (lfdi) (Asia Pacific Region results)
GDP PVTY HDI CPI DBT hdir lfdi
Corr.Coefficient 1.000 .005 -.205 -.541** .044 .204 .008
GDP
Corr.Coefficient .008 -.216 .311* .388 -.377* -.313* 1.000
Kendall’stau_b
Co
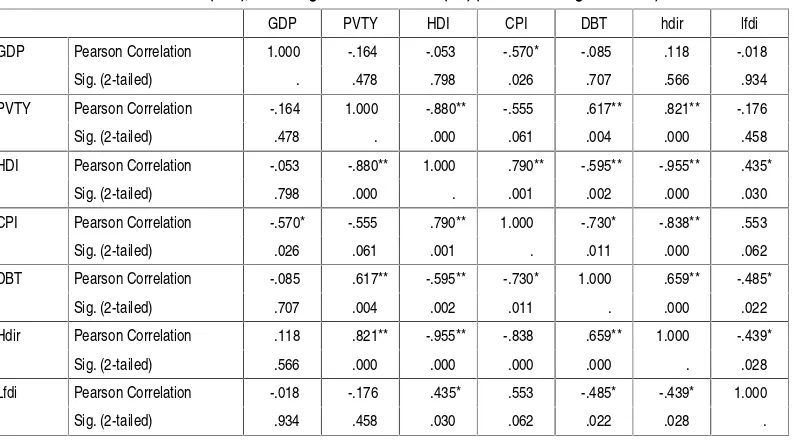
indebtedness (DBT), and foreign direct investment (lfdi) (Asia Pacific Region Results)
GDP PVTY HDI CPI DBT hdir lfdi
Pearson Correlation 1.000 -.164 -.053 -.570* -.085 .118 -.018
GDP
ya
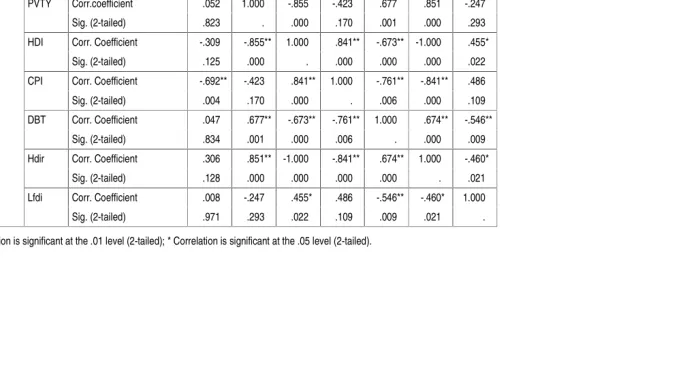
Spearman correlation results Growth rate (GDP), Corruption, poverty (PVTY), human development index (HDI and hdir), indebtedness (DBT), and foreign direct investment (lfdi) (Asia Pacific Region results)
GDP PVTY HDI CPI DBT hdir Lfdi**
Coefficient 1.000 .052 -.309 -.692** .047 .306 .008
GDP
Sig.(2-tailed) . .823 .495 .004 .834 .128 .971
Corr.coefficient .052 1.000 -.855 -.423 .677 .851 -.247
PVTY
high Human Development Index Ranks and by implication longer life expectancy, higher education attainment, and higher real adjusted income. Bi-variate correlation results between Corruption perception (CPI), Indebtedness (DBT), Impoverishment(PVTY), economic growth (GDP), Foreign direct Investment (FDI), Over all development level (HDI, and HDIR(rank on HDI index) appear in Table 2 to Table 4.
Level of economic growth and corruption perception level
Results indicate that high level of corruption (lower rank on CPI index) correlates negatively and significant with economic growth (GDP). Kendalls tau_b has a significant coefficient -.54, Spearman Rho has a magnitude of -.69, and Pearson a magnitude of -.57. Countries with low levels of corruption, occupying high positions on CPI index generally have better growth than those having higher corruption level (occupying lower positions on the CPI index).
Poverty and corruption perception level
Global results of the correlation analysis between poverty level proxied by HDI rank and score on the Corruption Perception Index (CPI) in Table 1 indicate a negative and significant negative relationship. Kendall correlation coefficient has a magnitude of -.60, and Spearman correlation coefficient has a significant negative coefficient of -.80. Similar results are appear with Asia Pacific data when the correlation analysis between CPI and PVTY (the percentage of a countrys population that survives on less than US$1 a day). The degree of corruption perception (CPI) correlates negatively with the percentage of a countrys population surviving on less than US$ 1 a day (PVTY). Kendalls tau_b has a magnitude of -.31; Spearmans rho has a magnitude of -.42, and Pearson correlation coefficient has a magnitude of -.56. The implication is that countries that have high poverty levels are also the ones that have high levels of corruption.
Indebtedness and corruption perception level
magnitude of -.60, Spearmans rho has a significant magnitude of -.76, and Pearson has a coefficient of -.73. This is an indicator that that countries with high levels of corruption, occupying lower ranks on the CPI index, tend to have high debt levels.
The level of human development index and corruption perception index
A countrys rank Human Development Index correlates positively and significantly with the level of corruption perception. Kendalls tau_b has a significant magnitude of .69, Spearmans rho has a significant coefficient of .84, and Pearson has a magnitude of .79. This is the case because lower values on the corruption index indicate high corruption levels and lower values on HDI indicate poor performance on human development (high HDI rank). The same result is depicted by the correlation results between the rank a country has on the human development index and score on the corruption perception index , however with an opposite sign understandably because higher rank on HDI depicts poor performance, while lower levels on CPI index depict high corruption levels. Countries with high corruption perception levels occupy high ranks on the human development index, which is indicative of poor performance.
Poverty level and Indebtedness
government intervention mechanisms such as rationing, setting floor and ceiling prices, minimum wages, setting quotas, foreign currency control increase the opportunities for corruption for those with the authority to dispense services to others (the bureaucrats and politicians). This should send the economy deeper into poverty. With many people hardly able to eke a living the time discount rate becomes very low, as they lead a hand to mouth existence. This increases their susceptibility to receive questionable payments in any transaction.
Results using Asia Pacific data set confirm the existence of a negative relationship between poverty and the incidence of corruption. More light is shed on the relationship between corruption and economic growth, which is shown to be strongly negative; on level of foreign debt level and poverty, which is shown to be strongly positive; indebtedness and incidence of corruption, which is shown to be strongly negative; and foreign direct investment and poverty, level which is shown to be negative.
Conclusion and Policy Implications
Index Rank is an approximation of the level of social welfare and thus not a direct measure of the level of poverty. However, the assumption made in this article is that countries with lower HDIR ranks (26-173) can be taken as having most poverty incidence in comparison with those enjoying higher ranks (25-1). However, the effect is somewhat amended by using the percentage of a countrys population that lives on less than a US$ 1 a day, which is a measure of people living under the poverty line. The results thus off sufficient evidence that it is a fallacy to think of efforts to promote economic development without first and foremost dealing with the scourge of corruption. High corruption level means that there is little growth and hardly any development. Policies to fight corruption should go hand in hand with those that promote development, which is a tall order by all accounts since the most effective ways of dealing with malfeasance is improving the incentives for civil servants, strengthening law enforcement, establishing code ethics, among others, which apparently call for immense funding. Yet corruption is the very malady that hampers the very growth that can bolster the economy to eradicate the malpractice. Foreign direct investment can be used as a mitigating effect on poverty. However, higher growth is likely to be hampered by high corruption incidence. It is indeed a vicious cycle that is difficult to break.
Reference
Acemoglu, Daron and T. Verdier. 1998. Property rights, corruption and allocation of talent: A general equilibrium approach Economic Journal
108(450): 1381-1403.
Ades, A. o and R. Di Tella. 1999. Rents, competition and corruption
American Economic Review 89(4): 982-993.
Alesina, A. Sozler, N. Roubin, and P. Suael. 1996. Political instability and economic growth. Journal of Economic Growth 1(2):188-211. Bardhan Pranab. 1997. Corruption and development: a review of issues
Journal of Economic Literature 35(3): 1320-1346.
Cadot, O. 1987. Corruption as a gamble Journal of Public Economy 33: 223-244.
Ehlich, I. 1996. Crime punishment and the market for offenses Perspectives
10(1): 43-67.
Fombad, Charles M. 1999. Curbing corruption in Africa: some lessons from Botswanas experience UNESCO, 241-254.
Fredrickson, G. and Svensson, J. 2000. Political instability, corruption and policy formation: the case of environmental policy, Journal of Public Economics.
Hal Hill. 2000. The Indonesian Economy. Second Edition. c.s.l.: Cambridge University Press.
Kompas. 2001. Perbankan: antara APBN, forbearance, dan rekapitulisasi kedua, 16 April.
Lui. F.T. and I. Ehlich. 1999. Bureaucratic corruption and endogenous economic growth, Journal of Political Economy 107(6): 270-293. Mauro, P. 1995. Corruption and growth, Quarterly Journal of Economics
110(3): 681-712.
---. 1998. Corruption: causes, consequences: agenda for further research Finance and Development March: 11-14.
Mookherjee, D. and I. P. L PNG. 1995. Corruptible law enforcers: how should they be compensated? Economic Journal 105(428): 145-159. Murphy, K. M. et al., 1991. The allocation of talent: implications for
growth Quarterly Journal of Economics 106: 503-530.
---. 1993. Why is rent seeking so costly to growth? American Economic Review Papers and Proceedings 83(2): 409-414.
Perotti, R. 1996. Growth, income distribution and democracy. What the data say? Journal of Economic Growth 1(2): 149-187.
Quah Jon S. T. 1999. Corruption in Asian countries: can it be minimized?
Public Administration Review 59(6): 483-494.
Sandholtz, W. and W. Koetzle. 2000. Accounting for corruption: economic structure, democracy, and trade, International Studies Quarterly 44(1): 31-50.
Sardan, O. J. P. 1999. A moral economy of corruption in Africa? Journal of Modern African Studies 37(1): 25-52.
Sheifer, A. and R. W. Vishny. 1993. Corruption, Quarterly Journal of Economics 108(3): 599-617.
Svennson, A. 1998. Investment, property rights and political instability: theory and evidence, European Economic Review 42: 1317-1347. ---. 2003. Who must pay bribes and how much? evidence from a
cross-section of firms, Quarterly Journal of Economics 118(1). The World Bank. World Development Indicators 1999. Washington, D.C. UNDP. 1997. Corruption and governance. Discussion paper 3, Management and Development, Division Bureau for Policy and Program Support, UNDP. New York.