IJG Vol. 48 No.1, June 2016 (7 - 20) © 2016 Faculty of Geography UGM and The Indonesian Geographers Association
Indonesia’s Forest Resource Monitoring
Belinda Arunarwati Margono, Ahmad Basyirudin Usman, Budiharto and Ruandha
Agung Sugardiman
Received: 25 10 2015 / Accepted: 25 12 2015 / Published online: 30 06 2016 © 2016 Faculty of Geography UGM and The Indonesian Geographers Association
Abstract Forest cover in term of distribution, extent and types, is major information required to manage the forest resources. Notably for Indonesia, which covers by approximately 98 Mha (>50%) forests, consist of 93 Mha (49.6%) nat-ural forest and 5 Mha (2.6%) plantations forest [MoF, 2012]. The forests are invaluable, including significantly preserve carbon, maintain unique biodiversity, support water and mineral cycle, as well as support local and global community. Here we report efforts have been made for years in the Ministry of Forestry for providing land cover information. Those efforts are including early development, data sources selection, method employed, techniques, and classification scheme, as well as problem encountered and approach for improvements.
Abstrak Tutupan hutan dalam hal distribusi, luas dan jenis, adalah informasi utama yang diperlukan untuk mengelola sumber daya hutan. Terutama untuk Indonesia, yang mencakup sekitar 98 Mha (> 50%) hutan, terdiri dari 93 Mha (49,6%) hutan alam dan 5 Mha (2,6%) hutan tanaman [MoF, 2012]. Hutan sangat berharga, termasuk signifikan me-lestarikan karbon, mempertahankan keanekaragaman hayati yang unik, membantu siklus air dan mineral, serta men-dukung masyarakat lokal dan global. Penelitian ini melaporkan upaya yang telah dilakukan selama bertahun-tahun di Departemen Kehutanan untuk menyediakan informasi tutupan lahan. Upaya tersebut terdiri dari pengembangan awal, pemilihan sumber data, metode yang digunakan, teknik, dan skema klasifikasi, serta masalah yang dihadapi dan pendeka-tan untuk perbaikan.
Keywords: Land cover, Forest, Forest monitoring, Remote sensing, Indonesia
Kata kunci: Tutupan lahan, Hutan, Pengawasan hutan, Penginderaan jauh, Indonesia
1. Introduction
Indonesia is home to the world’s third largest tropical forest with tremendously high biodiversity values. It’s unfortunate that for years the remarkable forest has been reported in experiencing second and even highest deforestation [e.g. FAO 2001, 2006, Hansen et al 2008b, 2009, Margono et al 2014a]. A fact that obviously made the forest plays an important role in both increasing greenhouse gas emissions and loss of biodiversity. As consequence, monitoring spatio-temporal Indonesia’s forest dynamic is highly demanded. How this monitoring works in the country and how long it has been developed and operationally implemented, remain key questions to answer. This paper elaborates such questions.
At first, the Ministry of Forestry of Indonesia (MoF) developed forest resource monitoring through National Forest Inventory (NFI) project of Indonesia, established in 1989. The NFI project was executed for years under collaboration of the Government of Indonesia (GOI) and Food and Agriculture Organization (FAO). The use of satellite imagery to produce land cover map, which
Belinda Arunarwati Margono, Ahmad Basyirudin Usman, Budiharto and Ruandha Agung Sugardiman
Ministry of Environment and Forestry, Manggala Wanabhakti Bld, Jakarta 10270 Indonesia.
Email: arunarwati@gmail.com
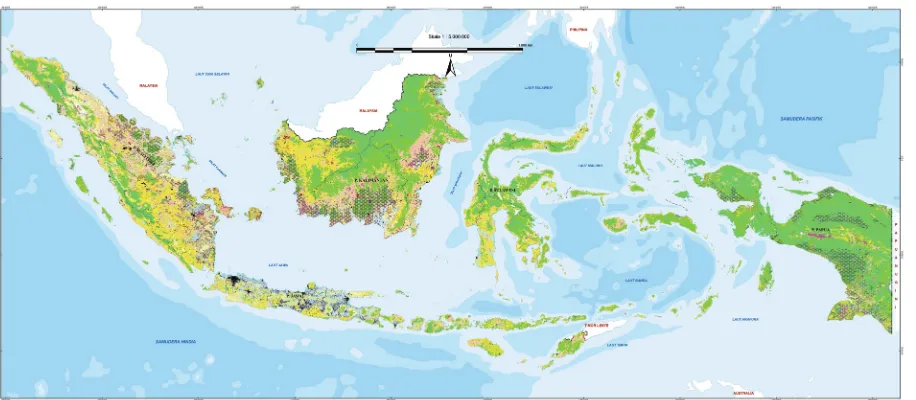
was pre-dominantly Landsat data, was introduced during the periods of NFI [Revilla and Liang 1989, 1992]. After termination of the NFI project at around 1997/1998, tasks for operationally mapping land cover were transferred into the Forestry Planning Agency/ Directorate General (DG) of Forestry Planning of the Ministry of Forestry. Under the DG of Forestry Planning, the more systematic monitoring approach was at first established in 2000. The system is now named National Forest Monitoring System (NFMS), which is based on a regular production of land cover map of Indonesia generated in three years interval, and provided in 23 land cover classes including class of cloud cover and no-data [MoF 2003a, 2003b, 2005, 2008, 2011, 2012, SNI 7645-2010]. Example of the Indonesia’s land cover map is in figure 1, and the National Forest Monitoring System is available online at migrate to http://geoportal. menlhk.go.id/arcgis/home/for data display, viewing and simple analysis.
2. The Methods Data
less-cloud data availability. Other data sets such as SPOT Vegetation 1.000 meter [Nugroho, 2005] and Moderate Resolution Imaging Spectroradiometer (MODIS) 500 meters [Hansen et al, 2006; 2008b] were also used for alternative. In the tropic such like Indonesia, clouds and haze are major problems of using optical remotely sensed data, including Landsat [Hoekman 1997; Hansen et al, 2008a; 2009]. Unluckily, unlike Brazil, Indonesia has no seasonal cloud-free window that offering opportunity to capture clouds-free images [Broich et al 2011]. The limited cloud-free image coverage and budget constraint restrict data availability for the system. However since 2008, given the change in Landsat data policy, the United States Geological Survey (USGS) has made Landsat data freely available over the internet [Wulder et al, 2012, Roy et al 2010]. Although most of data are available online at around 2009, the policy significantly gives Indonesia a chance and benefit to increase data available for the system. In 2013, MoF started using the newly launched Landsat 8 (Landsat Data Continuity Mission-LDCM) Operational Land Imager (OLI) to monitor Indonesian land cover condition and placed the Landsat 7 ETM+ as a substitution for cloud elimination.
Within early system development up to around 2008/2009, with all existing restrictions, the Ministry of Forestry only able to compile Landsat data for the entire country in three years interval (triennially). The three years interval was selected with time-allocation: first-year on data selection, second-year on obtaining the data including additional scene selection, and third-year for classification and mapping process. Depend on Landsat minimum-cloud scene availability (see Landsat Mission), the data obtained either from National Institute of Aeronautics and Space of Indonesia (LAPAN), which is the institution for Indonesian ground-station, or direct from National Aeronautics
and Space Administration (NASA) - USGS Earth Resources Observation and Science (EROS) data center. Prior to data procurement, a process on specific scene selection to get minimum cloud and haze coverage for each path/row for every 16 days acquisition (within three years interval) was carefully employed. In total, for wall-to-wall mapping purpose, Indonesia covers around 218 Landsat scenes. Multi temporal composite of Landsat within one scene was created if the particular path/row never contains less than 50 percent cloud/ haze distributed unevenly over the scene, or 30 percent if clustered. As such, total Landsat data to cover the entirety of Indonesia within selected year’s interval were likely far more than 218 scenes.
For reason of efficiency in budget/time/effort, LAPAN and MoF work simultaneously under memorandum of understanding (MoU MoF-LAPAN 2003), focusing on data selection/data preparation, simple pre-processing, and data handling for distribution. Data selection was including carefully select the best scenes for data procurement, as well as finalizing all administrative consequences. The simple pre-processing meant for creating band 5-4-3 and or 5-4-2 (true color) composite, gap filled for Scan Line Corrector (SLC)-off imagery, gap filled for enormously cloudy/hazy scene, and geometric correction (for data L1G to L1T). Data handling intended for copying and packaging the digital data, ready for distribution to MoF’s regional offices. The MoF, under the DG of Forestry Planology has several regional offices responsible for specific areas that spread along the archipelago, from Sumatra to Papua. Besides set up the master data in MoF headquarter office, copy of the data send to all related regional offices.
Set up at around the end of 2014, the MoF or now named the Ministry of Environment and Forestry (MoEF) re-established the MoU with LAPAN, Figure 1. Land cover map of Indonesia produced by the Ministry of Forestry of Indonesia, presented in 23 land
particularly in Landsat data provision for ensuring the data sustainability of the NFMS. From that point, LAPAN would automatically provide mosaic of Landsat covering Indonesia (mainly OLI and additional ETM+) on regular basis, which at first would be twice a year. The plan is implemented for 2015 an onward.
General Approaches for land cover classification
The 23 land cover classes of Indonesia was generated based on manual image interpretation of selected Landsat imagery available within the three years interval. At first, the wall-to-wall land cover 2000 was generated only by interpreters in Headquarter (HQ) Jakarta. To anticipate a limited number of interpreters/ operators in MoF HQ, out-sourcing with tight quality control was carried out, those are including field activity. Results however lack some local details and required exhaustive scrutiny on detail class delineations. So that, idea to involve operators from the field came out. Later for land cover 2003, considerable operators from regional offices, which at the beginning were 11 regional offices and later [in early 2013] grew into 22 regional offices; work simultaneously with operators at HQ Jakarta for delineating land cover classes.
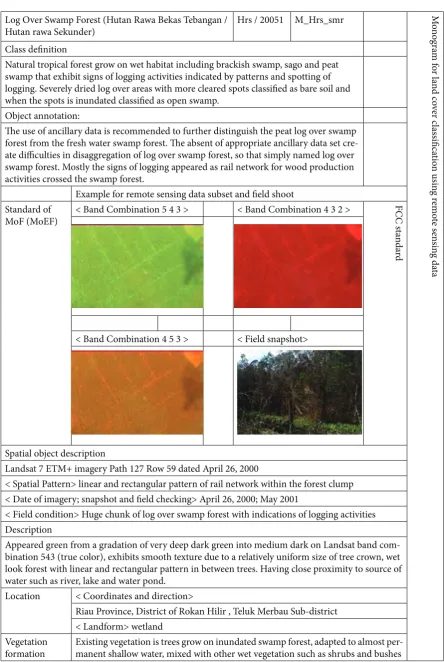
At around 2002, efforts and activities were concentrated in preparing interpreters/operators at regional offices. Those are along with settling up standardized hardware and software to guarantee results comparability among regional offices and the HQ. Series of technical training conducted simultaneously at every regional office, fit it out with required standards, manuals, guidelines and monogram. Example of the monogram (in Indonesian language) is in Figure 2 [MoF 2003b].
The technical trainings involve technical trainers from the MoF HQ, LAPAN and BIG (Geospatial Information Agency). Collaboration with related institution such as LAPAN and BIG is necessary to support limited number of technical staffs/trainers in the MoF HQ. Besides teaching and improving technical capabilities of using standard hardware and software for land cover classification in every regional office, the training was intended to capture local knowledge. Those are valuable for improving classification quality. Since the era of NFI, local officers in regional office are expert in working on forest inventory and surveys, knowing their area well. Yet, they were not familiar in transferring their local knowledge into digital land cover map. The workflow for Indonesian land cover map briefly illustrates in figure 3. In general the workflow shows a time consuming activity, which labor intensive and enable for inconsistencies. Regardless, manual delineation on the designed 23 land cover classes has some reasons to keep. Those are including (i) to match the basic management needs (see class description), and (ii) to represent local knowledge that improve sense of data/map belonging.
Land Cover Class and Classification Technique
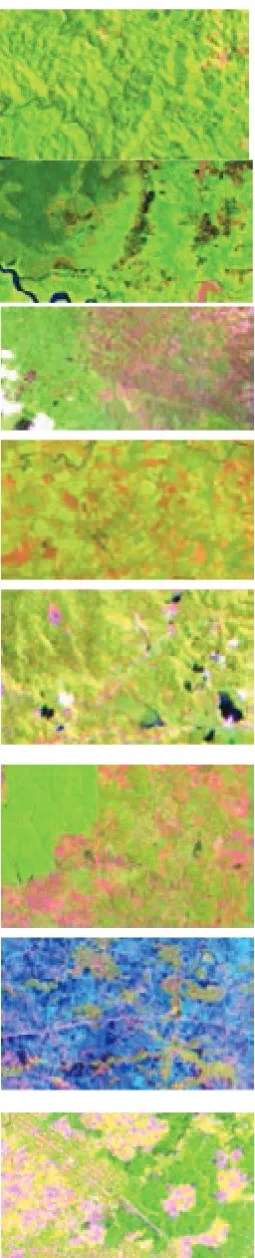
The 23 land cover classes were generated based on physiognomy or appearance of bio-physical covers that visually distinguished by remote sensing data used: Landsat 30 meter spatial resolution [MoF 2003b]. Although in some extent names of land cover classes (Table 1) mixture to land uses, such as forest plantation or estate crops, object identification over the imagery is purely based on existing appearance, not probable cover or land uses. Several ancillary data sets were used for reference during the process of delineation, to catch as much as valuable information for classification.
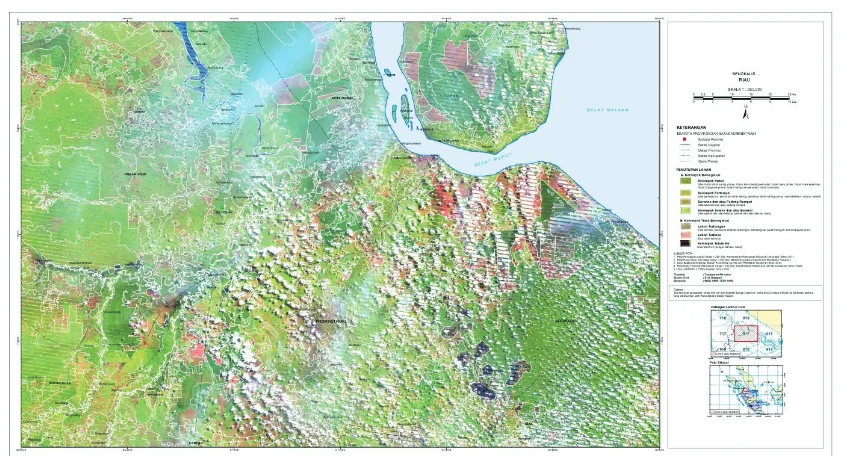
Visual classification carried out by digitizing on screen technique using key elements of image/photo-interpretation [MoF 2003b; 2004]. Under standard GIS software, feature with distinctive existing appearance were visually taken, carefully and manually delineated on the screen to create closed polygons and assigned into designated classes (Figure 4). Recommended maximum scale for classification process is 1:100.000 for using only multispectral bands (e.g. band 5-4-3) and 1:50.000 for using panchromatic band for data registration. A minimum unit polygon is 6.25 hectares or equal to 2.5 cm x 2.5 cm at the maximum zoom screen of 1:50.000 scales or 25 hectares at 1:100.000 scales. Right now, the national land cover map of Indonesia is made available at the scale minimum of 1:250.000, with Forestry Thematic Base Map (Peta Dasar Tematik Kehutanan/PDTK) used for base-map.
The manual operations were done per individual scene, and merged through edge-matching from scene to scene, up to a complete area of each regional office jurisdiction. Inconsistencies very likely occur among operators, so that quality control is key activity. At the MoF HQ, edge-matching for each island employ carefully, including corrections for lines and labels of polygons. In some cases, re-delineation may be needed if edge-matching is unable. Final result is Indonesian land cover map for a certain year, start on 2000 and so on for every three years. With more Landsat data and archive available, started in 2012, scene by scene interpretation was abandoned, and use a mosaic instead. This approach reduced problems of unmatched polygon at the scene-edge as well as reduced cloud coverage by using multitemporal composite. On the other hand, this process require a very huge number of Landsat data to obtain the clearest picture of Indonesia; which consequently requires a high storage and server capacity.
Log Over Swamp Forest (Hutan Rawa Bekas Tebangan / Hutan rawa Sekunder)
Hrs / 20051 M_Hrs_smr Monogra
m
f
o
r la
nd co
ver c
lassifica
tio
n usin
g r
emo
te
s
en
sin
g da
ta
Class definition
Natural tropical forest grow on wet habitat including brackish swamp, sago and peat swamp that exhibit signs of logging activities indicated by patterns and spotting of logging. Severely dried log over areas with more cleared spots classified as bare soil and when the spots is inundated classified as open swamp.
Object annotation:
The use of ancillary data is recommended to further distinguish the peat log over swamp forest from the fresh water swamp forest. The absent of appropriate ancillary data set cre-ate difficulties in disaggregation of log over swamp forest, so that simply named log over swamp forest. Mostly the signs of logging appeared as rail network for wood production activities crossed the swamp forest.
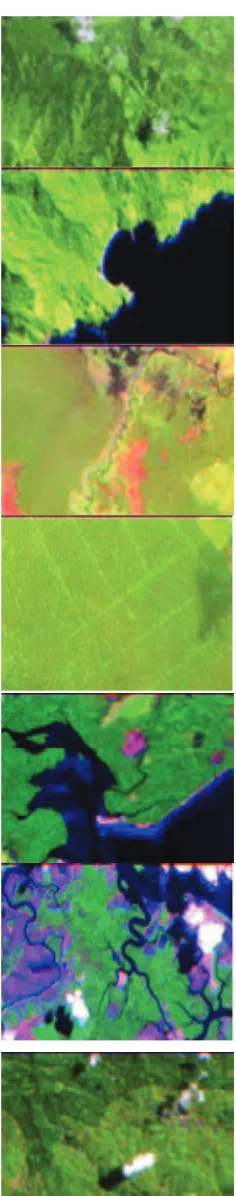
Example for remote sensing data subset and field shoot Standard of
MoF (MoEF)
< Band Combination 5 4 3 > < Band Combination 4 3 2 > FCC st
an
da
rd
< Band Combination 4 5 3 > < Field snapshot>
Spatial object description
Landsat 7 ETM+ imagery Path 127 Row 59 dated April 26, 2000
< Spatial Pattern> linear and rectangular pattern of rail network within the forest clump < Date of imagery; snapshot and field checking> April 26, 2000; May 2001
< Field condition> Huge chunk of log over swamp forest with indications of logging activities Description
Appeared green from a gradation of very deep dark green into medium dark on Landsat band com-bination 543 (true color), exhibits smooth texture due to a relatively uniform size of tree crown, wet look forest with linear and rectangular pattern in between trees. Having close proximity to source of water such as river, lake and water pond.
Location < Coordinates and direction>
Riau Province, District of Rokan Hilir , Teluk Merbau Sub-district < Landform> wetland
Vegetation formation
Existing vegetation is trees grow on inundated swamp forest, adapted to almost per-manent shallow water, mixed with other wet vegetation such as shrubs and bushes
be a problem when mapping technologies development were match, but that was not a choice at that time. With intention to prepare data ready for further analysis, visual classification technique was then selected for operational method.
Validation and quality assessment
Field-check was held to assure the results of classification; it is carried out by comparing the land cover map to field data post-classification. Initial classified map elaborated visually using image reference, and areas with uncertainty were marked. Field activity is designed using this marked points. The misdoubt land cover classes over the points were identified and random points were added, with at least two-three points for each class. Here, stratified random sampling is an approach selected to verify classification map toward field reality; meaning, land cover classes are used for stratification, and random points are added of within selected classes.
Field visit later employed using Global Positioning System (GPS) hand-held. In the field, each team brought a standard tally-sheet to be filled out following MoF technical instructions and field verification guidelines [MoF-FAO, 1992]. Compilation of data from several field visits within a specific year interval was exercised for accuracy assessment. Results perform on table of accuracy (contingency table), yielding an overall accuracy of 88 percent for all 23 classes and 98 percent for aggregated classes of forest and non-forest [MoF 2011, Margono et al, 2012].
Quantifying forest cover change
Quantifying the extent of forest change was done by finding their difference from land cover map time-1 to time-2. Technically via superimpose those two maps, for example, of map 2003 and 2006. However a direct quantification is not simple due to typical situation, such as: for data 2003, about 10,73 Mha classified as clouds while for data 2006 cloud was only 3,56 Mha (33 percent smaller than the previous data). With limited image sources, predicting what was underneath the clouds is not an easy task. Besides un-comparable area extent, clouds location discrepancies are dilemmatic. In general, adjustment and assumption are common and required when such situation are found, including such areas that (a) it was not “forest-covered” in map time-1 become “forest covered” in time-2; or (b) it was clouds and no-data in map time-1 become “forest covered” in time-2, or (c) it was “forest covered” in map time-1 become clouds and no-data in map time-2. Land cover data of 2000, 2003, and 2006 got such problem due to limited access to Landsat 30 meters resolution, forced the use of alternative data such as SPOT Vegetation 1.000 meters of Nugroho [2005] and MODIS 500 meters resolution of Hansen et al [2006, 2008b].
Results in quantifying forest cover change usually presents in tabular data and associated maps for regular reporting. Those are including the book series of forest resource recalculation and or deforestation calculation, available for publication year 2003, 2005, 2008, 2011 and 2012. The result was also regularly reported on country report to the FAO for Forest Resource Assessment (FRA), Figure 3. General Indonesian Land Cover map workflow (after Margono 2014b). Boxes in green (left-side) repre-sent activities in Jakarta Headquarter; Boxes in purple (right-side) reprerepre-sent activities employed in regional offices;
e.g. FRA 2005, and FRA 2010. At the beginning of the system, quantifying forest cover change or commonly named deforestation, focus only on natural forest, renowned and reported as gross deforestation, meaning it quantifies only the loss regardless regrowth. In 2011 for forest loss 2009-2011 and onward, the focus began into quantifying net deforestation, meaning reported what has been loss and subsequently subtracted it by regrowth of the same period of time (mostly in term of forest plantation). This is viable, since IPCC guidelines categorize forest for either natural or plantation [IPCC 2007]. Though it must be seen differently in term of biodiversity, land suitability, land carrying capacity and forest management purposes. In addition while talking about carbon accounting; recall that the land cover data and its change is simply source for providing activity data (AD), while emission factor (EF) is something else on the other side. To match the IPCC guidelines [IPCC 2007], the 23 land cover classes that produced in NFMS could simply re-grouped into the six broad land categories (forestland, cropland, grassland, wetland, settlement, and other land) for reporting purposes.
Base map is another nightmare on the process of land cover classification and subsequent analysis. Here, a base map (topographic map) plays a role to ensure a precision of thematic maps, including the land cover map. Variation in topographic map creates uncertainty in quantifying land cover and land cover change. Yet the existing Indonesian Topographic Map (Rupa Bumi Indonesia-RBI) at the national scale (1:250.000) was not in acceptable quality for operational uses. So that, in 2006, Forestry Thematic Base Map (Peta Dasar Tematik kehutanan or PDTK) at 1:250.000 was eventually established, under letter of agreement between the
MoF and BIG (the authorized institution for national mapping). This temporary thematic base map generated from Landsat ortho-rectified L1T, coupled with lots of additional ground control points. The PDTK was applied for base map for all forestry themes, including land cover map, up to 2011. With the release of Law 4/2011 on National Geospatial Information, the PDTK was not anymore valid for a base map; instead the RBI of BIG at 1:250.000 and 1:50.000 scales was used as valid base map.
Referring to the Law 4/2011 on Geospatial Information, processes of data migration from the entirety of land cover maps at PDTK 1:250.000 scales to the RBI 1:250.000 or direct to 1:50.000 scales would be an immediate target. In fact, these tasks would not be easy, due to the limited quality and low precision of RBI 1:250.000. As an illustration, based on the RBI 1:250.000, area of Indonesia is about 189 Mha; while based on the PDTK that was generated from Landsat ortho-rectified is more or less187 Mha. The huge difference between those two base maps would illustrate the technical problems encountered during adjustment processes.
3. Result and Discussion Technical improvements
The manual visual-classification technique employed for NFMS is time consuming and often delayed the product delivery. Here, technical improvements are necessary. Besides improvement in quality of products through process of (classification) refinements, acceleration on the time consuming classification process is another concern. Process of refinements is enabled due to more Landsat archive are publicly available. Acceleration on classification Figure 4. Distinctive existing feature were carefully and manually delineated on the screen (white lines), snapped to create closed polygons and assigned into designed classes. The map above is a sample, displayed in standardized
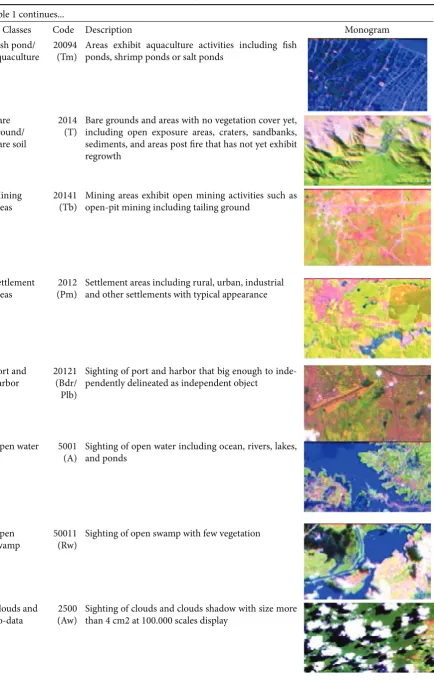
Table 1. The 23 land cover classes of Indonesia, digital code and class code, description and simple monogram. The class description is based on National Indonesian Standard or Standard Nasional Indonesia/SNI 9645-2010.
Classes Code Description Monogram
Forest Primary dry-land forest
2001 (Hp)
Natural tropical forests grow on non-wet habitat in-cluding lowland, upland, and montane forests with no signs of logging activities. The forest is including pygmies and heath forest and forest on ultramafic and lime-stone, as well as coniferous, deciduous and mist or cloud forest.
Secondary dryland forest
2002 (Hs)
Natural tropical forest grow on non-wet habitat in-cluding lowland, upland, and montane forests that exhibit signs of logging activities indicated by pat-terns and spotting of logging. The forest is including pygmies and heath forest and forest on ultramafic and lime-stone, as well as coniferous, deciduous and mist or cloud forest.
Primary swamp forest
2005 (Hrp)
Natural tropical forest grow on wet habitat including brackish swamp, sago and peat swamp, with no signs of logging activities
Secondary swamp forest
20051 (Hrs)
Natural tropical forest grow on wet habitat including brackish swamp, sago and peat swamp that exhibit signs of logging activities indicated by patterns and spotting of logging
Primary man-grove forest
2004 (Hmp)
Inundated forest with access to sea/brackish water and dominated by species of mangrove and Nipa (Nipa frutescens) that has no signs of logging activ-ities
S e c o n d a r y mangrove for-est
20041 (Hms)
Inundated forest with access to sea/brackish water and dominated by species of mangrove and Nipa (Nipa frutescens) that exhibit signs of logging activi-ties indicated by patterns and spotting of logging
Plantation for-est
2006 (Ht)
Table 1 continues...
Classes Code Description Monogram
Non-Forest
Dry shrub 2007
(B)
Highly degraded log over areas on non-wet habitat that are ongoing process of succession but not yet reach stable forest ecosystem, having natural scattered trees or shrubs
Wet shrub/ swampy shrub
20071 (Br)
Highly degraded log over areas on wet habitat that are ongoing process of succession but not yet reach stable forest ecosystem, having natural scattered trees or shrubs
Savanna and Grasses
3000 (S)
Areas with grasses and scattered natural trees and shrubs. This is typical of natural ecosystem and ap-pearance on Sulawesi Tenggara, Nusa Tenggara Timur, and south part of Papua island. This type of cover could be on wet or non-wet habitat
Pertanian lahan kering
20091 (Pt)
All land covers associated to agriculture activities on dry/non-wet land, such as tegalan (moor), mixed gar-den and ladang (agriculture fields)
Mixed dry agriculture
20092 (Pc)
All land covers associated to agriculture activities on dry/non-wet land that mixed with shrubs, thickets, and log over forest. This cover type often results of shifting cultivation and its rotation, including on karts
Estate crop 2010 (Pk)
Estate areas that has been planted, mostly with peren-nials crops or other agriculture trees commodities
Paddy field 20093 (Sw)
Agriculture areas on wet habitat, especially for paddy, that typically exhibit dyke patterns (pola pematang). This cover type includes rainfed, seasonal paddy field, and irrigated paddy fields
Transmigra-tion areas
20122 (Tr)
Table 1 continues...
Classes Code Description Monogram
Fish pond/ aquaculture
20094 (Tm)
Areas exhibit aquaculture activities including fish ponds, shrimp ponds or salt ponds
Bare ground/ Bare soil
2014 (T)
Bare grounds and areas with no vegetation cover yet, including open exposure areas, craters, sandbanks, sediments, and areas post fire that has not yet exhibit regrowth
Mining areas
20141 (Tb)
Mining areas exhibit open mining activities such as open-pit mining including tailing ground
Settlement areas
2012 (Pm)
Settlement areas including rural, urban, industrial and other settlements with typical appearance
Port and harbor
20121 (Bdr/
Plb)
Sighting of port and harbor that big enough to inde-pendently delineated as independent object
Open water 5001 (A)
Sighting of open water including ocean, rivers, lakes, and ponds
Open swamp
50011 (Rw)
Sighting of open swamp with few vegetation
Clouds and no-data
2500 (Aw)
process done through a geodatabase establishment; the approach is as follow.
From 2000 to 2009, the three yearly land cover data were created independently in separate shape file. The concept of interdependency among those independent data sets carried out by using former shape file for a reference upon upcoming shape file. Experience shows that such independent data sets with problems of (i) clouds and (ii) dynamic forest cover change cannot fit the rapid needs. As such, improvements have been introduced in 2006 to make one interdependence land cover geodatabase. All independent shape file, e.g. data 2000, 2003, 2006, and later 2009, were transferred into one geodatabase. This geodatabase is a solution to improve interdependency among layers, as well as efforts to accelerate the process of classification.
The improvement on product quality relates significantly to the change in Landsat data policy, which has made the data freely available over the internet [Wulder et al, 2012; Roy et al, 2010]. By an easy and free access to Landsat data, more scenes including Landsat archive are available. More data available notably improve spatially and timely area coverage, shorten the process of data selection, and cut off processes of data procurement and administration. More Landsat coverage enables changing in delineation focus, from delineating land cover classes into delineating only forest/land cover change. So that, since 2010/2011, techniques in delineating polygons of forest cover classes have been modified, along with geodatabase improvements to increase interdependency.
The existing monitoring system
Data required for large area monitoring, such as for national covered, shall (a) supported by systematic global acquisition, (b) require a minimum cost (no/low cost), (c) easy access to the data, and (d) have minimum pre-processing; to guarantee continuity of operational works implementation. This should not be mixed up with research needs, which tend to accommodate trial and error. Landsat, so far fit the requirements, although in the future may need to integrate the Landsat data with other data sources for more comprehensive information. In addition, most work to date has focused on the project level (e.g. province, district levels, or smaller area capture), with an exception given to this national land cover map of the Ministry of Forestry of Indonesia [MoF 2003, 2005, 2008b, 2011, 2012].
The 23 land cover map of Indonesia has been established as a continuous monitoring system for more than a decade, although some weaknesses may occur as explained in the following part. Recall that the system was originally developed for inventory and multi-stage mapping purposes. The system was challenged by boom of global warming issues at around 2006/2007, where so much need for greenhouse gases (GHG) monitoring was introduced. The 23 classes land cover map is one of the sources of activity data suitable for monitoring GHG emission. However, GHG emission annually is required for national GHG inventory under the UNFCCC, yet it does not fit to the available triennial system of NFMS. So that, the MoF puts lot of efforts in NFMS just to decrease the time interval for mapping land cover of Indonesia, from triennial to annual system.
In seeking for other possible approaches to match the rapid needs, as well as following the recent developments in mapping using remote sensing, a breakthrough toward future needs has been carried out. Those are including working on independent study. At this point, some works on independent study have been elaborated, published and tested. Those are capable for improvements in the future. Yet, the migration of the ongoing system on operational approach (e.g. manual technique) into new approach (automatic technique) is challenging. Especially when the NFMS has been introduced and used for official report.
Independent study
Consistent methodologies that implemented repeatedly and frequently over time are a basis for forest monitoring using remotely sensed data, especially at the national scale [DeFries et al, 2007, Hansen and Loveland 2012]. Conventional method suitable for monitoring forest disturbances is visual interpretation of aerial photograph or satellite imagery. However, such an approach is labor intensive and time consuming, especially when employed at national scale [e.g. Revilla and Liang, 1989; Skole and Tucker 1993; Holmes 2000a, 2000b]. Another promising approach is digital image processing subsequently followed by mapping, using either sampling or wall-to-wall mapping approaches [Achard et al, 2002; Hansen et al, 2003; Hansen and DeFries 2004; DeFries et al. 2007; Hansen et al, 2008a, 2008b; Hansen and Loveland 2012].
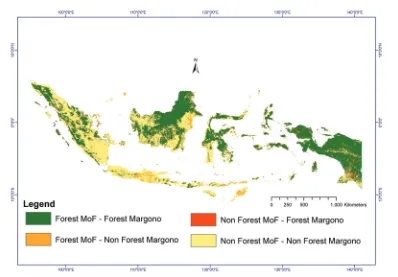
Recently, two digital images processing on wall-to-wall mapping approaches were taken place for Indonesia. One is from the University of Maryland (UMD) that
produced the Global study of Hansen et al, 2013 which generated specific for Indonesia in Margono et al 2014a. The other one is study of Land Cover Change Analysis (LCCA) LAPAN – produced under Indonesia’s National Carbon Accounting System (INCAS) by Australian Agency for International Development (AUSAID) partnering LAPAN. Comparison between the MoF and UMD maps has been carried out, as elaborated in Margono et al, 2014a; 2014b. The comparison was using data forest and non-forest 2000, which was a selected year for starting the analysis, yielded more than 90 percent agreement with an 80 percent Kappa and balanced omission and commission errors with map agreement/disagreement in Figure 4.
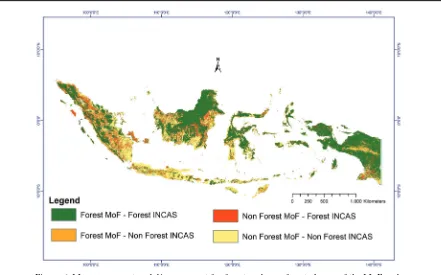
Agreement and disagreement for the MoF and LCCA-LAPAN-INCAS gives 78 percent overall agreements with a 56 percent Kappa, with map agreement/disagreement displays in Figure 5.
In principal those two independent studies employed more consistent and neat approach that can be easily and consistently repeated over time. The work of the UMD is also in plan to be expanded backward to create land cover data of 1980s or 1990s (depending on archive data available). Such consistent approach with long span interval from 1990s up to now, would be a very valuable information for Indonesia. In case of the ongoing NFMS is not easily adopt the system and approach offered by the study, the results could be beneficial as a reference to improve the quality of NFMS products.
Strength and Weaknesses
In general, three main problems exist within Figure 6. Map agreement and disagreement for forest and non-forest classes of the MoF and
existing NFMS. Those are (a) presence of persistent clouds cover, (b) inconsistency within the mapping processes, and (c) inability to give near-real time information to match the dynamic recovery of vegetation disturbances. Problems exist due to complex and sometimes conflicting definitions for land cover classification, including forest and deforestation definition. Technically, problems occurred due to lack of adequate data, robust methodologies, and insufficient infrastructure to perform work at a national scale. Adequate data includes timing for data gathering and sufficient pre-processing. Robust methods are linking to rapid needs for supporting carbon monitoring objectives.
The NFMS is a portal, which designated to integrate internet ability and forest resource information system in reciprocal (two ways) media information sharing: a step toward the good forest governance, through transparency. As such, information uploaded on NFMS should be maintained, in term of real/near-real time, completeness, and correctness. The current NFMS provides a facility to benefit public participation in updating, correcting, or just commenting the uploaded land cover map. Although currently it might not work as intended, the two ways communication was expected to increase values of correctness, which collected from community in the field as well as from broader users.
Besides strength and weaknesses that need to be strengthened and improved, the NFMS dealt with future challenge including the one map initiative. Produce one land cover map of Indonesia at the national scale that accepted and used by all institutions, is a big challenge. Various institutions generate their own land cover/land use map based on their own interests, which sometimes cannot be pleased by available map. Integration or better introduced as harmonization, is the key step to have it in place. Harmonization process was not intended to eliminate specific task on each institution, but rather to produce one reference for users. Work start with making one base map at operational scale (e.g. 1:50.000 scales), and later followed by strengthening collaboration among thematic data provider. In general all thematic maps at the end will be using same reference, and made it publicly available on one geoportal. The available land cover map use PDTK as a base, which is provided at 1:250.000 scales. In the near future, the operational works on forest monitoring intend to use maps at 1:50.000 scales, with a consequence of migrating existing land cover maps at 1:250.000 scales into new designated RBI (Indonesian base map) at 1:50.000.
4. Conclusion
Visual interpretation of satellite imagery is suitable for mapping land cover and disturbances. However, very rapid needs for annual or intra-annual monitoring and GHG monitoring objectives would not fit easily to the selected approach. Another approach should be taken simultaneously into consideration to cover the growing needs. Difficulties in dealing with labor intensive activities, including budget limit and problem of consistency, would be main concern for further improvements. In fact, the existing NFMS was not designed for rapid and rigid UNFCCC reporting requirements, and was more designed for supporting forest management objectives. However, in the COP 16 Cancun, there was a mandate that each country should establish a national monitoring and reporting system for their REDD+ activities, and the NFMS currently is directed to that point.
Regardless all problem encountered during the process, the NFMS has been consistently running for more than a decade. The detail Indonesian land cover provided in 23 classes is required for sustainable forest management, beyond just annual reporting on either gross or net deforestation. Challenge for solving clouds problems for Indonesia is real and enormous, even more serious than challenge of monitoring system in Brazil.
Dealing with quantifying an area extent is more challenging than just created a map. So that, the NFMS come at the point of complexity in providing a near-real time (fast) information with an accurate/valid area (precise) quantification. Yet, this intention would still be a recurrent issues until the problem of base-map discrepancies at apparent scale (either RBI 1:50.000 or 1:250.000) truly solved. Without that, harmonizing the 23 land cover classes with other comprehensive similar classes would not give any effect, including in giving accurate/valid area extents.
Acknowledgement
References
Achard F, Eva HD, Stibig HJ, Mayaux P, Gallego J, Achard F, Eva HD, Stibig HJ, Mayaux P, Gallego J, Richards T & Malingreau JP. (2002). Determination of Deforestation rates of the world’s humid tropical forests. Science. 297(5583), 999-1002.
Broich M, Hansen MC, Stolle F, Potapov P, Arunarwati MB & Adusei B. (2011). Remotely Sensed Forest Cover Loss shows High Spatial and Temporal
Variation across Sumatera and Kalimantan.
Indonesia 2000-2008. Environmental Research letters, 6, 014010.
DeFries R, Achard F, Brown S, Herold M, Murdiyarso D, Schlamadinger B & Souza C. (2007). Earth observations for estimating greenhouse gas emissions from deforestation in developing countries. Environmental Science and Policy. 10, 385-394.
Hansen MC, DeFries RS, Townshend JRG, Carrol M, Dimicelli C & Sohlberg RA. (2003). Global percent tree cover at a spatial resolution of 500 meters: first results of the MODIS vegetation continuous fields algorithm. Earth Interaction. 7(10),15.
Hansen MC & DeFries RS. (2004). Detecting long-term global forest change using continuous field of tree-cover maps from 8-km Advanced Very High Resolution Radiometer (AVHRR) data for the years 1982-99. Ecosystem.7: 695-716.
Hansen et al (2006). Trial of using MODIS data for quantifying Indonesia’s forests. Un-published report. The Ministry of Forestry and South Dakota State University.
Hansen MC, Roy DP, Lindquist E, Adusei B, Justice CO & Alstatt A. (2008a). Method for Integrating MODIS and Landsat Data for Systematic Monitoring of Forest Cover and Change in the Congo Basin. Remote Sens. Environ. 112, 2495–513. Hansen MC. et al. (2008b). Humid Tropical Forest
Clearing from 2000 to 2005 Quantified by Using Multitemporal and Multiresolution Remotely Sensed Data. Proc. Natl Acad. Sci., 105, 9439–44.
Hansen MC, Stehman SV, Potapov PV, Pittman KW, Margono Arunarwati B & Stolle F. (2009). Quantifying Changes in The Rates of Forest Clearing in Indonesia from 1990 to 2005 Using Remotely Sensed Data sets. Environ. Res. Lett. 4, 034001.
Hansen MC & Loveland TR. (2012). A review of large area monitoring of land cover change using Landsat data. Remote Sensing of Environment, 122, 66-74. Hoekman DH. (1997). Radar monitoring system for
sustainable forest management in Indonesia.
Geoscience and remote sensing. 4 (augst),
1731-1733.
Holmes D. (2000a). Deforestation in Indonesia: A review of the situation in Sumatra. Kalimantan and Sulawesi. Jakarta: The World Bank).
Holmes D. (2000b). Where have all the forest gone? Environment and social development east Asia and Pacific region. Discussion paper. Jakarta: The World Bank).
Margono BA et al. (2012). Mapping and monitoring deforestation and forest degradation in Sumatra (Indonesia)using Landsat time series data sets from 1990 to 2010. Environ. Res Letters. 7(034010 )16. Margono BA, Potapov PV, Turubanova SA, Stolle F, &
Hansen MC. (2014a). Primary forest cover loss in Indonesia over 2000–2012. Nature Climate Change. 4, 730–735.
Margono BA. (2014b). Advancing Indonesia Forest Resource Monitoring using multi source remotely sensed-imagery. PhD Dissertation submitted to the University of Maryland. ProQuest.
MoF (Ministry of Forestry)-FAO. (1992). Langkah-langkah Prosedur Sampling Lapangan untuk proyek Inventarisasi Hutan Nasional (step by step of field
plot procedure for National Forest Inventory).
Jakarta. Indonesia.
MoF (Ministry of Forestry of Indonesia) (2003a).
Rekalkulasi Sumber Daya Hutan (Forest Resource
Recalculation) Indonesia Tahun 2003. Jakarta:
Badan Planology Kehutanan Departemen Kehutanan Indonesia.
MoF (Ministry of Forestry of Indonesia) (2003b). Pembakuan Standar Penafsiran Citra Satelit Resolusi Sedang (Standarization for Land Cover Classification using Medium resolution Satellite Imagery). (Jakarta: Badan Planology Kehutanan Departemen Kehutanan Indonesia of the MoF- Geospatial Information Agency /BIG of Indonesia). MoF (Ministry of Forestry of Indonesia) (2004).
Pembakuan Standar Penafsiran Citra Satelit Resolusi Tinggi (Standarization for Land Cover Classification using High resolution Satellite Imagery). (Jakarta: Badan Planology Kehutanan Departemen Kehutanan Indonesia of the MoF- Geospatial Information Agency /BIG of Indonesia).
MoF (Ministry of Forestry of Indonesia) (2005).
Rekalkulasi Penutupan Lahan (Land Cover Recalculation) Indonesia Tahun 2005 (Jakarta: Badan Planology Kehutanan Departemen Kehutanan Indonesia).(in indonesia)
MoF (Ministry of Forestry of Indonesia) (2008).
Rekalkulasi Penutupan Lahan (Forest Resource
Recalculation) Indonesia Tahun 2008. (Jakarta:
Badan Planology Kehutanan Departemen Kehutanan Indonesia) (in indonesia)
MoF (Ministry of Forestry of Indonesia) (2011).
Rekalkulasi Penutupan Lahan (Forest Resource
Recalculation) Indonesia Tahun 2009/2010.
Jakarta: Badan Planology Kehutanan Departemen Kehutanan Indonesia.(in indonesia)
MoF (Ministry of Forestry of Indonesia) (2012).
Rekalkulasi Penutupan Lahan (Forest Resource
Badan Planology Kehutanan Departemen Kehutanan Indonesia.
Nugroho (2005). Integration of Multi Remotely Sensed Data and Geodatabases for Forestry Management in Indonesia. Dissertation. Wageningen University, the Netherland. Tropenbos Kalimantan series 11. Roy DP, Ju J, Mbow C, Frost P, & Loveland T. (2010).
Accessing free Landsat data via the internet: Africa’s challenge. Remote Sensing Letters. 1(2). 111-117. Revilla JAV and Liang DH. (1989). The National Forest
Inventory (NFI) of Indonesia. Food and Agriculture Organization of the U. N. (Italy) FAO.
Revilla JAV & Liang DH. (1992). Supplementary Field Sampling Instructions (no. 2) for the NFI [National
Forest Inventory] Project. Food and Agriculture
Organization of the U. N. (Italy) FAO.
Skole D & Tucker C. (1993). Tropical deforestation and habitat fragmentation in the Amazon: satellite data from 1978 to 1988. Science New Series. 260 (5116), 1905-1910.
SNI (Standar Nasional Indonesia - National Standard of Indonesia) SNI 7645:2010.(2010). Klasifikasi penutupan lahan (Land cover classification). Badan Standardisasi Nasional BSN. Jakarta Indonesia. Wulder MA, Masek JG, Cohen WB, Loveland TR,
& Woodcock CE. (2012). Opening the archive: how free data has enabled the science and monitoring promise of Landsat. Remote Sensing of Environment.122(july), 2-10.
Revilla JAV & Liang DH. (1989). The National Forest Inventory (NFI) of Indonesia. Food and Agriculture Organization of the U. N. (Italy) FAO.
Revilla JAV & Liang DH. (1992). Supplementary Field Sampling Instructions (no. 2) for the NFI [National
Forest Inventory] Project. Food and Agriculture
Organization of the U. N. (Italy) FAO.
Skole D & Tucker C. (1993). Tropical deforestation and habitat fragmentation in the Amazon: satellite data from 1978 to 1988. Science New Series. 260 (5116), 1905-1910.
SNI (Standar Nasional Indonesia - National Standard of Indonesia) SNI 7645:2010. (2010). Klasifikasi penutupan lahan (Land cover classification). Badan Standardisasi Nasional BSN. Jakarta Indonesia. Wulder MA, Masek JG, Cohen WB, Loveland TR, &
Woodcock CE. (2012). Opening the archive: how free data has enabled the science and monitoring promise of Landsat. Remote Sensing of Environment.