JAVA, INDONESIA
Ika Heriansyah1,2,3, Sofwan Bustomi4, and Yoichi Kanazawa5
ABSTRACT
6JGUK\GCPFSWCNKV[QHRTQFWEGFVKODGTCTGITGCVN[CHHGEVGFD[VJGUWKVCDKNKV[QH planting density and the practice of thinning. Density effects on stand growth and FGXGNQROGPVYGTGGXCNWCVGFKPCURCEKPIVTKCNQHOGTMWURKPGPinus merkusii Jungh. et FG8TKGUGCPFVJGUGFCVCYGTGWUGFVQGUVCDNKUJCUVCPFFGPUKV[OCPCIGOGPVFKCITCO 5&/&)TQYVJRGTHQTOCPEGKPVGTOUQHFKCOGVGTCVDTGCUVJGKIJVDVQVCNJGKIJV HtCPFOQTVCNKV[TCVGYGTGOQPKVQTGFHQT[GCTUYJGPVTGGUYGTGŌ[GCTUQNF Mortality and D growth were positively density related, but H growth was not affected by density. During the measurement period, tree density decreased from 7779 to 679 VTGGUJCHQTVJGENQUGUVURCEKPICPFHTQOVQVTGGUJCHQTVJGYKFGUVURCEKPI Results suggested that optimal harvesting was at about 30 years of age if no thinning occurs. The SDMD was established to predict the course of stand development in merkus pine. The simulation of stand growth under 2m x 3 m spacing and thinning QRVKQPUYCUFGOQPUVTCVGFKPC5&/&CPFUWIIGUVGFTGCUQPCDNGƀGZKDKNKV[HQTRTCEVKECN CRRNKECVKQP9GTGEQOOGPFWUKPIVJKU5&/&CUCVQQNVQTGGZCOKPGVJGVJKPPKPITGIKOG HQTGPJCPEKPIHQTGUVRTQFWEVKXKV[CPFYQQFWVKNK\CVKQP
Keywords: Pinus merkusii, spacing trial, stand development, stand density management, diagram, thinning regimes
I. INTRODUCTION
Determination of appropriate levels of growing stock at the stand level is aEQORNGZRTQEGUUKPXQNXKPIDKQNQIKECNCPFVGEJPQNQIKECNHCEVQTUURGEKſEVQC particular management situation. The process requires selection of upper and lower limits of growing stock, taking into account that the upper limit is chosen to obtain acceptable stand growth and individual tree vigor, and the lower limit is chosen to maintain acceptable site occupancy&GCPCPF$CNFYKP
1 (QTGUVCPF0CVWTG%QPUGTXCVKQP4GUGCTEJCPF&GXGNQROGPV%GPVGT,N)WPWPI$CVW0Q
21$QZ$QIQT+PFQPGUKC
2 5EJQQNQH)TCFWCVG5VWFKGU7PKXGTUKVK2WVTC/CNC[UKC5GTFCPI/CNC[UKC 3 %QTTGURQPFKPICWVJQT'OCKNHQTGUVEQTG"IOCKNEQO
4 (QTGUV2NCPVCVKQP4GUGCTEJCPF&GXGNQROGPV%GPVGT,N)WPWPI$CVW0Q$QIQT Indonesia
#NVJQWIJſGNFVTKCNUCTGVJGDGUVYC[QHFGVGTOKPKPIVJGVKOKPIof thinnings, theyJCXGVYQUGTKQWUNKOKVCVKQPU&GCPCPF$CNFYKPVJG[take many years to complete and the results cannot be applied accurately when the site quality and management objectives differ from those encountered in the trials. Density manipulation is one of the most powerful tools available to achieve a DTQCFTCPIGQHUKNXKEWNVWTCNQDLGEVKXGU1PGQHVJGOQUVGHHGEVKXGOGVJQFUQH planting density management in even-aged stands is through the use of stand FGPUKV[OCPCIGOGPVFKCITCOU5&/&Uwhich are average stand-level models that graphically illustrate the relationships among yield, density, and mortality throughCNNUVCIGUQHUVCPFFGXGNQROGPV0GYVQPCPF9GGVOCP,CEMCPF .QPIThey allow the user to develop and project crop plans through time, to determine the optimum timing of thinnings, and to contrast potential outcomes from a number of stand management regimes.
The basic theories of stand density and plant growth and the SDMD were FGXGNQRGFKP,CRCPKPVJGNCVGUCPFGCTN[U-KTCet al., 1953, 1954, 5JKPQ\CMKCPF-KTC;QFCet al6JGWUGQH5&/&U was initiallyFGXGNQRGFD[,CRCPGUGUEKGPVKUVUKPVJGGCTN[UGI#PFQ 6CFCMK&WTKPIVJGUCPFUXCTKQWU OQFKſECVKQPU to the original modeling approach, incorporating forest production theories, YGTGRTQRQUGF0GYVQP6QFC[these models have been developed for several additional species and mixed stands by employing earlier modeling approaches. These diagrams provide level summaries for making stand-NGXGNUKNXKEWNVWTCNFGEKUKQPU*CVK[CCPF(WLKOQTK(CTPFGP5GXGTCN density indices have been used: the stand density index proposed by Reineke GI/E%CTVGTCPF .QPI.QPIet al&GCPCPF,QMGNC Dean and$CNFYKP-WOCTet alVJGUGNHVJKPPKPITWNGRTQRQUGFby Yoda et alGI&TGYCPF(NGYGNNKPI-KOet alQT&TGY CPF(NGYGNNKPIŏUCPFVJGTGNCVKXGFGPUKV[ KPFGZGI(NGYGNNKPIet al., 0GYVQPCPF9GGVOCP (NGYGNNKPICPF&TGY(CTPFGP 0GYVQP 1PGITGCVCFXCPVCIGQHVJGUGFGPUKV[KPFKEGUKUVJCVVJG[ areKPFGRGPFGPVQHUKVGSWCNKV[CPFUVCPFCIG.QPI/E%CTVGT CPF.QPI
regimes to attain the scheduled production purpose based on the current status of the plantations.
Merkus pine is one of the most common and commercially important tree species for plantations, occurring across a variety of site types in Indonesia *KFC[CVCPF*CPUGP+P,CXCCNQPGVJGCTGCRNCPVGFD[VJGUVCVGQYPGF GPVGTRTKUG2GTWO2GTJWVCPKYCUJCKP2GTWO2GTJWVCPK
II. MATERIALS AND METHODS
A. Study Site
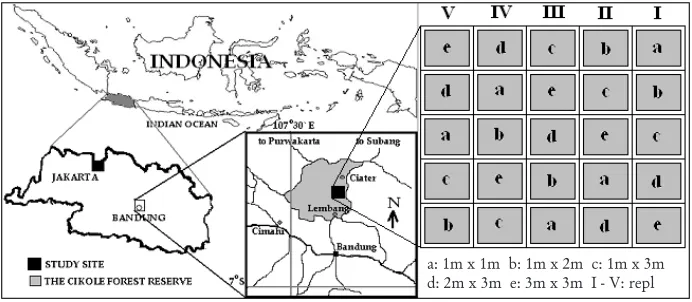
6JG URCEKPI VTKCN YCU GUVCDNKUJGF KP KP VJG %KMQNG (QTGUV 4GUGTXG 9GUV,CXC+PFQPGUKC(KIWTG6JGUKVGYCUNQECVGFCVNCVKVWFGo46.541 S and
longitude 107o38.173 E, at an elevation of about 1500 m above sea level. The
mean annual rainfall is 2429 mm and the soil is Andosol, Eutric Hapludands (14JGVTKCNKPKVKCNN[EQPUKUVGFQHRNQVUſXGURCEKPIUQHOZ OOZOOZOOZOCPFOZOCPFſXGTGRNKECVKQPUGCEJ'CEJ plot was square, 0.14 ha in area and had two or more exterior isolation rows.
a: 1m x 1m b: 1m x 2m c: 1m x 3m d: 2m x 3m e: 3m x 3m I - V: repl
Figure 1. .QECVKQPQHVJGUVWF[UKVG
B. Data Set
analysis. Total plot volumes were calculated by combining individual diameter and height measurements with the volume equations proposed by Heriansyah
et al
C. Construction of the Stand Density Management Diagram
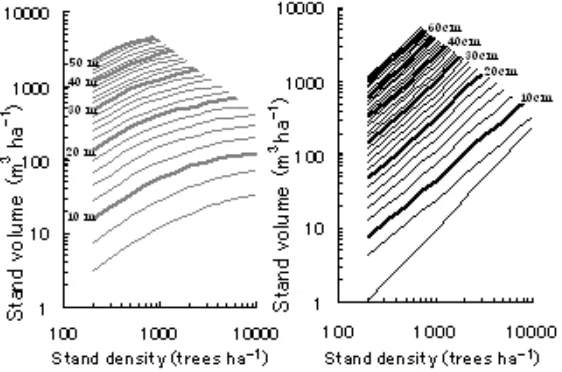
The stand density diagram was constructed using the methods of Hatiya CPF(WLKOQTK%QPUVTWEVKQPQHVJGUVCPFFGPUKV[FKCITCOKPXQNXGFVJG following steps:
1. %QORGVKVKQPŌFGPUKV[%Ō&CPF[KGNFFGPUKV[;Ō&GHHGEVCPCN[UKU
The mean stem volume and stand density are related by the competition– FGPUKV[%–&GHHGEV$GECWUGEQPFKVKQPUHQTITQYVJYGTGKFGPVKECNVJTQWIJ time, and growth of all trees started at the same time, the only variable was stand FGPUKV[6JGPVJGTGNCVKQPUJKRCHVGTCEGTVCKPRGTKQFQHVKOGYCUFGſPGFCU
1/g = Aʌ + B, ...
where gKUVJGOGCPUVGOXQNWOGO3ʌKUVJGUVCPFFGPUKV[VTGGUJC–1CPFA
Stand volume is obtained by multiplying g andʌG = g xʌCPFsubstitution of this equation into Equation 1 results in
1/G = A + B/ʌ. ...
This relationship is the Y–D effect, and Eq. 2 is called the reciprocal Y–D GSWCVKQP5JKPQ\CMKCPF-KTC;KGNFCUWUGFJGTGKUGSWKXCNGPVVQ production.
2. Predominant height determination
The relationship between the growth of forest trees and stand density is expressed ideally by the reciprocal equations for each stand age, meaning the constants A and B in the equations are determined for each growth stage of VJGHQTGUV(WTVJGTOQTGCUUWOKPIVJCVVJGCXGTCIGRTGFQOKPCPVJGKIJVHCP CXGTCIGJGKIJVQHVJGVCNNGUVVTGGUQHGCEJURCEKPIQHVJGUVCPFGZRTGUUGUVJG growth stage or site condition of the stand, and that stands having similar H are at the same growth stage as each other, the various equivalent H curves can be expressed with the reciprocal equation. Thus, the variation in A and B in the reciprocal equation is approximated by the following equations:
log A = a log H + b ...
log B = a` log H + b`,...
where A and B are constants to be determined by H, and a, b, a`, and b` are constants.
3. Equivalent height curve and equivalent diameter curve determination 'SWCVKQPUCPFYGTGWUGFVQFGTKXGCPGSWKXCNGPVJGKIJVEWTXG that was determined by the relationship between the constants of the reciprocal equations and H for all stand ages. After constants a, b, a`, and b` were determined, values A and B of every height grade were to be determined, given at intervals of 2 m. The equivalent height curve, therefore, was determined D[WUKPI'S'SWKXCNGPVFKCOGVGTEWTXGUYGTGQDVCKPGFD[RNQVVKPIVJG diameters and densities calculated from the equation showing the relationship DGVYGGPDCUCNCTGCCPFFGPUKV[HQTCURGEKſEJGKIJVITCFGIKXGPCVKPVGTXCNUQH 2 cm in terms of diameter grade.
4. Yield index curve and self-thinning curve analysis
natural thinning is an important force, ʌ, g, and G are tied together in the following relationship:
g = kʌ-a...
G = kʌ1-a, ...
where k and a are constants inherent in species.
III. RESULTS AND DISCUSSION
A. Results
1. Density effect on survival rate, height, and diameter growth
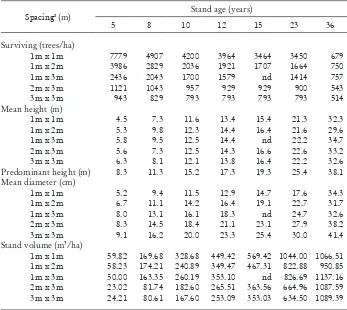
Summary statistics for the data set and the age trend in survival, tree height and diameter by spacing are shown in Table 1 and Figure 2, respectively. /QTVCNKV[KPVJG%KMQNG(QTGUV4GUGTXGYCUFGPUKV[TGNCVGFPQECWUGUQVJGT VJCPEQORGVKVKQPHQTITQYKPIURCEGYGTGKFGPVKſGFGZEGRVHQTOKPQTOQTVCNKV[ after planting. Self-thinning began earliest and trees died in the greatest numbers in the 1m x 1m and 1m x 2m spacing. By age 8, about 50.9 and 43.4% of the trees in the 1m x 1m and 1m x 2m plots had died, respectively, and although mortality had begun to occur in the 1m x 3m and 2m x 3m plots, only 38.7 and JCFFKGFD[VJGſHVJ[GCTTGURGEVKXGN[#DQWVQHVJGVTGGUKPVJG OZORNQVUJCFFKGFD[VJGſHVJ[GCT6CDNG(KIWTG6JGUWTXKXCNEWTXG declined progressively up to age 15 years in the most densely planted plots of 1m x 1m, up to age 10 years in the 1m x 2m and 1m x 3m spacings, and up to age 5 years in the two widest spacings, with all declines converging as a result of self-thinning. At age 23, the curves of the closest and widest spacings were 3450 CPFVTGGUJCTGURGEVKXGN[9JGPOCVWTGUVCPFUYGTGUVKNNCVJKIJFGPUKVKGU high competition occurred and mortality increased progressively at the closest spacing, followed by wider spacings. At the last measurement at age 36, stand FGPUKV[JCFDGEQOGCPFVTGGUJCHQTVJGOZOO x 2m, 1m x 3m, 2m x 3m, and 3m x 3m spacings, respectively.
Table 1. /GCPUHQTUVCPFEQORQPGPVUQHVJG%KMQNG(QTGUV4GUGTXG9GUV,CXC at age of measurement
SpacingaO 5VCPFCIG[GCTU
5 8 10 12 15 23 36
5WTXKXKPIVTGGUJC
1m x 1m 7779 4907 4200 3964 3464 3450 679
1m x 2m 3986 2829 2036 1921 1707 1664 750
1m x 3m 2436 2043 1700 1579 nd 1414 757
2m x 3m 1121 1043 957 929 929 900 543
3m x 3m 943 829 793 793 793 793 514
/GCPJGKIJVO
1m x 1m 4.5 7.3 11.6 13.4 15.4 21.3 32.3
1m x 2m 5.3 9.8 12.3 14.4 16.4 21.6 29.6
1m x 3m 5.8 9.5 12.5 14.4 nd 22.2 34.7
2m x 3m 5.6 7.3 12.5 14.3 16.6 22.6 33.2
3m x 3m 6.3 8.1 12.1 13.8 16.4 22.2 32.6
2TGFQOKPCPVJGKIJVO 8.3 11.3 15.2 17.3 19.3 25.4 38.1
/GCPFKCOGVGTEO
1m x 1m 5.2 9.4 11.5 12.9 14.7 17.6 34.3
1m x 2m 6.7 11.1 14.2 16.4 19.1 22.7 31.7
1m x 3m 8.0 13.1 16.1 18.3 nd 24.7 32.6
2m x 3m 8.3 14.5 18.4 21.1 23.1 27.9 38.2
3m x 3m 9.1 16.2 20.0 23.3 25.4 30.0 41.4
5VCPFXQNWOGO3JC
1m x 1m 59.82 169.68 328.68 449.42 569.42 1044.00 1066.51
1m x 2m 58.23 174.21 240.89 349.47 467.31 822.88 950.85
1m x 3m 50.00 163.35 260.19 353.10 nd 826.69 1137.16
2m x 3m 23.02 81.74 182.60 265.51 363.56 664.96 1087.59
3m x 3m 24.21 80.61 167.60 253.09 353.03 634.50 1089.39
Note: a6TGGURNCPVGFRGTJCOZOOZOOZOOZ
Diameter
Figure 2. Age trends in survival, tree height and diameter by spacing
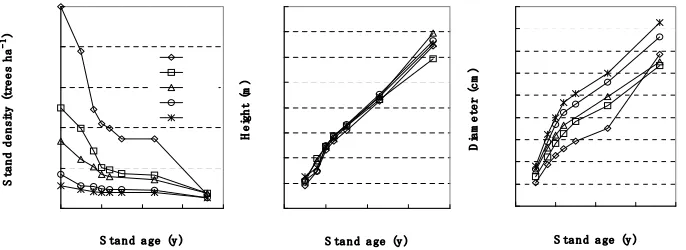
Stand differentiation resulting from differential growth among the EQORQPGPV VTGGU 1NKXGT CPF .CTUQP YCU GZCOKPGF D[ GXCNWCVKPID UK\GENCUUHTGSWGPE[FKUVTKDWVKQPKPEOENCUUYKFVJU6JGVKOGVTGPFQHVJG frequency distribution of D in each stand is given in Figure 3. In early growth at 5 years of age, the dominant D class was between 0 and 10 cm for the closest spacing and between 5 and 10 cm for wider spacings.
The dead trees belonged to the lowest class, indicating that smaller trees died as the stand grew. At age 23, the dominant D class for the 1m x 1m spacing was DGVYGGPCPFEOYJKNGQHVJGD class ranged from 25 to 35 cm in the 3m x 3m spacing. At age 36, the 1m x 1m spacing was dominated
by trees with DDGVYGGPCPFEOYJKNGQHVTGGUJCFCD
Z
Figure 3. Transition of the frequency distribution of D in 1m x 1m and 3m x 3m spacing. Relative frequencies are shown in 11 equal intervals in the range of D.
1DUGTXCVKQPUHQTCNNUVCPFCIGUTGXGCNGFVJCVOQTVCNKV[FWTKPIUGNHVJKPPKPI tends not to be random, but is concentrated among the smaller individuals in the stand. Thus, the reduction in density that occurs during self-thinning is CEEQORCPKGFD[CEJCPIGKPVJGUK\GUVTWEVWTGQHVJGRQRWNCVKQP,QPGUCPF *CTRGT
2. Stand density management diagram
Competition–density (C–D) and yield-density (Y–D) effect
Table 2. %Ō&GHHGEVQPOGCPUVGOXQNWOGQHOGTMWURKPG
Parameter Stand age A B r2
OGCPUVGOXQNWOG
5 0.0128 25.2320 0.9570
8 0.0043 6.2017 0.9100
10 0.0024 2.9619 0.9839
12 0.0018 1.8066 0.9950
15 0.0014 1.1933 0.9990
23 0.0008 0.6598 0.9969
Figure 4. The effects of stand density on stem volume in Merkus pine.
Equivalent height curve, equivalent diameter curve and the yield index curve
log B = -3.2434log H + 4.2971
R2 = 0.9848
log A = -2.4185log H + 0.258
R2 = 0.9848
-4.0
-3.0
-2.0
-1.0
0.0
1.0
2.0
0.8
1
1.2
1.4
1.6
㫃㫆㪾㩷㪟
㫃㫆
㪾
㩷
㪘
㪒㩷
㫃㫆
㪾
㩷
㪙
㩷
Figure 5. Relationship between H and constant A and B in the reciprocal equation used as the equivalent height curve of stem volume.
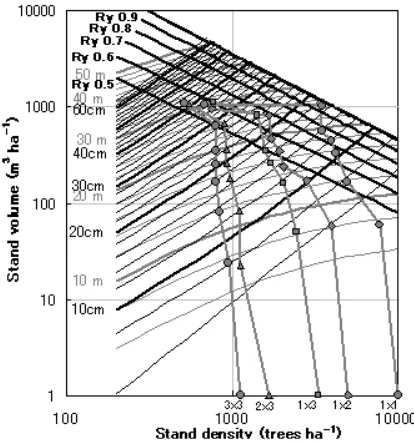
+PGSWCVKQPVJGEQGHſEKGPVkEJCPIGUFGRGPFKPIQPURGEKGUCPFVJGEQGHſEKGPV aKUWUWCNN[CTQWPF-KTC5JKPQ\CMK6JGEQGHſEKGPVk` = log kCPFVJGEQGHſEKGPVa for stem volume in this study are 5.47987 and 1.8459, TGURGEVKXGN['SWCVKQPUCPFCTGPQVTGNCVGFVQVJGITQYVJUVCIGCPFUKVG conditions. They express the upper limits of density characteristics for each species. The curves given by these equations are called the full density curves, CPFCTGHQNNQYGFD[EWTXGUTWPPKPIRCTCNNGNECNNGF[KGNFKPFGZEWTXGURy6JG RyFGPQVGUVJGTCVKQQHVJGUVCPFXQNWOGCVCURGEKſEFGPUKV[VQVJGUVCPFXQNWOG CTGCCVHWNNFGPUKV[HQTCURGEKſEJGKIJVITCFG*CVK[CCPF(WLKOQTK
This study provided stand density management diagram based on stem volume as shown in Figure 7. Figure 7 is a graphical representation of the density effect on the stand volume of Merkus pine for various mean heights of predominant trees and various mean diameters. The diagram contains all these GNGOGPVUQPCUKPINGUJGGVUWEJCUUVCPFFGPUKV[GSWKXCNGPVJGKIJVEWTXGUITC[ NKPGUGSWKXCNGPVFKCOGVGTEWTXGURCTCNNGNDNCEMNKPGUHWNNFGPUKV[EWTXGCPF yield index curves in the lower section, the actual natural thinning curves, and stand volume. By using this diagram, we can predict the growth of the forest at any given future point.
Development of a silvicultural schedule and yield determination
Two factors determine the schedule of thinning within the framework of the density management diagram: the target dominant heightCPFQTFKCOGVGT at rotation age and the lower and upper growing stock limits. Although these criteria are usually determined by timber objectives, they can also be set according to any non-timber objective that can be expressed in terms of tree UK\GCPFVTGGURGTJGEVCTG&GCPCPF$CNFYKP
Selection of lower and upper growing stock limits often represents a silvicultural trade-off between maximum stand growth and maximum individual VTGGITQYVJCPFXKIQT.QPI6JWUVJGFGEKUKQPregarding appropriate NGXGNUQHITQYKPIUVQEMYKNNTGƀGEVUVCPFmanagement objectives.
The principal objective in setting the lower growing stock limit is to maintain adequate site occupancy. The lower limit is usually set using a constant value of relative spacing index somewhat above canopy closure because it marks the beginning of competition for resources.
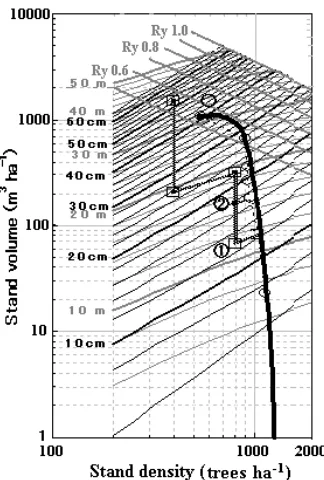
The development of a stand under two different thinning regimes is illustrated in Figure 8. The sequence of thinnings required to reach these points are found by stair-stepping backwards, taking into account the upper growing stock limit and the thinning interval.
Simulation for stand volume development
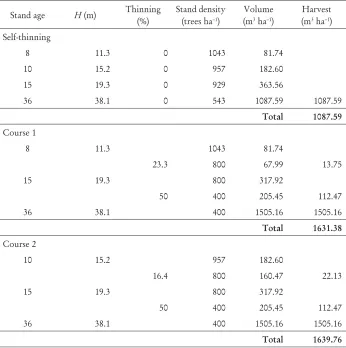
Table 3. Value changes in stand volume by thinning course
Stand age HO Thinning
Stand density
VTGGUJC–1
Volume
O3 ha–1
Harvest
O3 ha–1
Self-thinning
8 11.3 0 1043 81.74
10 15.2 0 957 182.60
15 19.3 0 929 363.56
36 38.1 0 543 1087.59 1087.59
Total 1087.59
%QWTUG
8 11.3 1043 81.74
23.3 800 67.99 13.75
15 19.3 800 317.92
50 400 205.45 112.47
36 38.1 400 1505.16 1505.16
Total 1631.38
%QWTUG
10 15.2 957 182.60
16.4 800 160.47 22.13
15 19.3 800 317.92
50 400 205.45 112.47
36 38.1 400 1505.16 1505.16
Figure 8. %QWTUG QH UVCPF XQNWOG FGXGNQROGPV RTGFKEVGF D[ 5&/& WPFGTVJG 2m x 3m spacing and thinning option. żPCVWTCNVJKPPKPIƑ: course 1
ſTUVVJKPPKPICV[GCTUQNFƑEQWTUGſTUVVJKPPKPICV[GCTUQNF
The predicted course of stand volume development is shown in Figure 8 and 6CDNG+PKVKCNFGPUKV[KUVTGGUJCYKVJVJKPPKPIUVCTVKPICV[GCTUQHCIG at 11.3 m predominant height. In that time, density should have been reduced VQCDQWVVTGGUJC CUCTGUWNVQHPCVWTCNVJKPPKPICEVWCNFCVC6CDNGCPF stand volume will be about 81.74 m3JC+HVJGVTGGUCTGVJKPPGFD[CDQWV JGTGVJGPVJGTGOCKPKPIFGPUKV[YKNNDGCDQWVVTGGUJC6JGFKHHGTGPEG in stand volume before and after thinning is about 13.75 m3 for 243 trees felled.
9JGP VJG VTGG JGKIJV KU O [GCTU VJG UGEQPF VJKPPKPI KU VQ DG carried out. The second thinning will remove 50%, or about 400 trees, leaving 400 trees standing. Stand volume before thinning is 317.92 m3 and after thinning
is about 205.45 m3VJWUCDQWVO3 of volume is thinned. If thinning
is performed following this method, productivity until the year of 36 will increase by 543.79m3 from 1087.59 to 1631.38 m3 for course 1 and by 552.17
m3HQTEQWTUG6CDNG9KVJVJKPPKPIVJGRTGFKEVGFFKCOGVGTUCVVJG
B. DISCUSSION
1. Density effects on stand development
Stand development is the process of structural change that occurs in stands over time. Stand development begins at the earliest point of stand establishment CPFKPƀWGPEGUVJGRCVVGTPQHVTGGITQYVJUVCPFUVTWEVWTGCPFVKODGTRTQFWEVKQP throughout its life. The concept of growing space is helpful in explaining the stand development process. The relative importance of growing space varies with species, site, and tree and stand developmental stage. A tree must continue VQ ITQY KP UK\G CPF CESWKTG OQTG URCEG KH KV KU VQ EQPVKPWG VQ VJTKXG 6TGGU YKVJQWV CFGSWCVG ITQYKPI URCEG ITQY RQQTN[ VJQUG VJCV HCKN VQ OGGV VJGKT minimum requirements for growth will die.
In even-aged merkus pine stands, trees are unrestrained by space from establishment until they begin to compete for the site resources, until the age of 5 and 8 years for the three closest spacing and for the widest spacing, respectively. This phase of tree growth is referred to as the period of free growth. Stand volume production is proportional to the number of trees occupying the site during this period. This period ends when the branches of adjacent trees meet and interlock in an attempt to use the same resources. The upper point of inter-tree crown contact moves upward and shading of the lower branches KPVGPUKſGUCUETQYPGZRCPUKQPEQPVKPWGU6JGNQYGTOQUVDTCPEJGUGXGPVWCNN[ die and the bases of the crowns of adjacent trees begin to lift at the same rate.
9JGPKPVGTVTGGETQYPEQPVCEVQEEWTUVJGDTCPEJGUQHVJGOQTGXKIQTQWU trees gradually overstep the lateral edge of the crowns of weaker trees. At this point the survival of these trees of lower vigor is threatened because they cannot increase in height fast enough to stay ahead of the receding base of their crowns. 6JGKTETQYPUITCFWCNN[FGENKPGKPUK\GVQVJGRQKPVYJGTGVJG[CTGWPCDNGVQ maintain their rate of height growth.
Individual tree variation in growth promotes the differentiation of trees KPVQUVTCVKſGFETQYPENCUUGU&KHHGTGPVKCVKQPKUGZRTGUUGFCUFKHHGTGPEGUKPVQVCN JGKIJVETQYPUK\GCPFUVGOFKCOGVGTVJTQWIJQWVVJGNKHGQHVJGUVCPF6JG process of differentiation is accentuated by tree-to-tree variations in vigor, microsite quality and the time of establishment relative to other trees. The rate QHFKHHGTGPVKCVKQPNCVGTCEEGNGTCVGUYKVJKPVGTURGEKſEEQORGVKVKQP
leave a more productive stand at maturity than one established at a much lower density, if only the most vigorous trees survive.
2NCPVCVKQP URCEKPI KP VJG %KMQNG (QTGUV 4GUGTXG 9GUV ,CXC +PFQPGUKC TCPIGF HTQO O VTGGU RGT JC VQ O VTGGU RGT JC 6TGGVQ tree spacing in natural stands covers a much wider range and is much less regular. Full site occupancy is achieved quickly when the establishment density is moderately high and the spatial distribution of trees is uniform. Uniformity increases in importance as establishment density decreases. Site occupation by tree crowns and merchantable volume decline in response to decreasing establishment density. Any clumping of the same number of stems will reduce VJGUVCPF[KGNFGXGPHWTVJGT.QYFGPUKV[UVCPFURTQFWEGNGUUXQNWOGKPKVKCNN[ because there are too few trees to exploit the available growing space. The rate of stand growth improves after crown closure.
2. Stand density management diagram
Stand density management practices include the spacing arrangement of RNCPVGF VTGGU RTGEQOOGTEKCN VJKPPKPI LWXGPKNG URCEKPI CPF EQOOGTEKCN VJKPPKPI6JGUGRTCEVKEGUECPJCXGCUKIPKſECPVKORCEVQPVJGUVTWEVWTGJGCNVJ CPFRCVVGTPQHUVCPFFGXGNQROGPVYJKEJKPVWTPKPƀWGPEGUUVCPFEQORQUKVKQP and utility through time. Appropriate decisions may enhance future stand values, tree and wood properties, and habitat characteristics. Inappropriate decisions will at best fail to achieve management objectives, and may compromise future stand values, stand health, or both.
This study provides essential information on tree growth elements, and RTQXKFGUCUKOWNCVKQPHQTOCMKPIUKVGURGEKſEFGPUKV[OCPCIGOGPVRTGUETKRVKQPU They provide information useful in all aspects of stand density management planning, and all practices including initial spacing, and pre-commercial and commercial thinning.
The growth and yield of trees and stands are fundamental to an understanding of the relationships between density management and timber production. Stand density changes from establishment to maturity in response to natural processes and management interventions such as plantation spacing, pre-commercial thinning and commercial thinning. These and all other silviculture treatments YJKEJCHHGEVVTGGURCEKPIYKNNKPƀWGPEGVJGUWDUGSWGPVITQYVJQHVJGUVCPFCPF the harvest yield.
#URGEKſEVCTIGVUVCPFFGPUKV[ECPDGCEJKGXGFCVCPGCTN[CIGD[OGCPUQH initial spacing or pre-commercial thinning. This study proposed initial spacing of 2m x 3m and pre-commercial thinning at the age of 8 or 10 years. The UKNXKEWNVWTCNDGPGſVUHQTDQVJRTCEVKEGUKPVGTOUQHCXGTCIGFKCOGVGTITQYVJ are due to the extended period of free growth before crown closure. High regeneration density followed by pre-commercial thinning provides unique silvicultural advantages over spacing because of the opportunity to select the best trees.
Pre-commercial thinning immediately reduces the number of trees, the occupancy of growing space and the standing volume per hectare. The magnitude of the reduction is related to the intensity of treatment. The response of pre-commercial thinning is also affected by the product objectives and the stage at which the impact of treatment is assessed. An un-thinned stand can produce more or less wood depending on the merchantability standard applied and when it is evaluated. A lower diameter limit accounts for the many small trees in the untreated stand once they reach pole stage and attains greater volume per hectare than a spaced stand. However, thinning provides more growing space for the left trees, permitting greater diameter growth, allowing trees to ETQUUFKCOGVGTVJTGUJQNFUOQTGSWKEMN[0QVKEGVJCVVJGXQNWOGDGPGſVUQH pre-commercial thinning diminish as an increasing proportion of the trees in VJGWPVJKPPGFUVCPFGZEGGFVJGOKPKOWOFKCOGVGT%QPUGSWGPVN[VTGCVOGPV response should not be assessed at an early age using a relatively large diameter limit.
A commercial thinning entry is designed to capture imminent mortality due to competition, and to modify the stand so that continued stand development will enhance the quality or growth of the remaining trees. The commercial thinning for merkus pine is proposed to be performed at the age of 15 years when the growth of the stand starts to slow down due to competition, and YJGPVJGXQNWOGQHVJGGZEGUUUVGOUVQDGTGOQXGFKUUWHſEKGPVVQOCMGVJG QRGTCVKQPRTQſVCDNG
A yield index representing site productivity was incorporated into the XCTKCDNGUVQRTGFKEVUVGOXQNWOGITQYVJ(KIWTG6JGTGHQTGVJGRTQEGFWTG can be regarded as a tool for predicting stand growth linked with the theory of the competition–density and yield–density relationships. This tool would thus help forest managers to examine optimum thinning regimes to attain the scheduled production purpose based on the current status of the plantation. If data from permanent sample plots with two or more measurements are available, a mortality equation can also be constructed and included in the diagram.
Total yield can be obtained directly for any point on the diagram using the stand volume isolines. The sum of volumes removedFWTKPIGCEJVJKPPKPIVJG difference between volume before andCHVGTVJKPPKPICPFXQNWOGCVVJGGPFQH the rotation represent CPGUVKOCVGQHVJGVQVCNXQNWOGRTQFWEGFD[CURGEKſE
density management regime. Finally, it is possible to obtain directly an estimate of the total volume for any point on the diagram.
IV. CONCLUSIONS
6JGTGURQPUGUQHOGTMWURKPGVTGGUKP9GUV,CXCVQKPKVKCNURCEKPIJCXGDGGP investigated, and the patterns of tree and stand responses to initial spacing of merkus pine were found to be consistent with spacing effects.
It was evident from the data that the critical factors accounting for differences in yield between spacings were tree survival and diameter growth. Tree height was not a factor responsible for growth differences because spacing FKFPQVJCXGCUKIPKſECPVGHHGEVQPJGKIJVITQYVJ
Stand density management decisions affected various links in the value recovery chain, including both tree and wood quality, harvesting and milling EQUVURTQFWEVXCNWGCPFſPCPEKCNTGVWTP6JGQRVKOCNEQODKPCVKQPQHUVQEMKPI density and harvest age for each species varied widely with end products produced.
ACKNOWLEDGEMENT
9GVJCPMVJGOCP[VGEJPKEKCPUQHVJG(QTGUVCPF0CVWTG%QPUGTXCVKQP 4GUGCTEJ CPF &GXGNQROGPV %GPVGT HQT VJGKT CUUKUVCPEG KP OCKPVCKPKPI VJG GZRGTKOGPV CPF EQPFWEVKPI OGCUWTGOGPVU VJG VGEJPKECN UVCHH QH VJG 2GTWO 2GTJWVCPKHQTVJGKTCUUKUVCPEGKPVJGſGNFCPF,GCPKPG2HGKHHGTHQTJGTETKVKSWG QPVJGſPFKPIUQHVJKUUVWF[
REFERENCES
#PFQ 6 )TQYVJ CPCN[UKU QP VJG PCVWTCN UVCPFU QH ,CRCPGUG TGF RKPG
2KPWUFGPUKƀQTC5KGDGV<WEE++#PCN[UKUQHUVCPFFGPUKV[CPFITQYVJ
$WNNGVKP 0Q )QXGTPOGPV (QTGUV 'ZRGTKOGPV 5VCVKQP 6QM[Q =+P Japanese with English summary]
Ando, T. 1968. Ecological studies on the stand density control in even-aged pure UVCPFU$WNNGVKP0Q)QXGTPOGPV(QTGUV'ZRGTKOGPV5VCVKQP6QM[Q [In Japanese with English summary]
Davis, K.P. 1966. Forest Management: Regulation and Valuation, 2nd Edn. /E)TCYŌ*KNN0GY;QTM
Dean, J. and J. Jokela. 1992. A density-management diagram for slash pine plantations in the lower coastal plain. Southern Journal of Applied Forestry 16: 178–185.
&GCP6,CPF8%$CNFYKP7UKPICFGPUKV[OCPCIGOGPVFKCITCOVQ develop thinning schedules for loblolly pine plantations. Research Paper 51 75&# (QTGUV 5GTXKEG 5QWVJGTP (QTGUV 'ZRGTKOGPVCN 5VCVKQP #VNCPVC)#
&GCP6,CPF8%$CNFYKP%TQYPOCPCIGOGPVCPFUVCPFFGPUKV[ In /% %CTVGT 'F )TQYKPI 6TGGU KP C )TGGPGT 9QTNF +PFWUVTKCN Forestry in the 21st%GPVWT[th.57(QTGUVT[5[ORQUKWO.QWKUKCPC 5VCVG7PKXGTUKV[#ITKEWNVWTCN%GPVGT.QWKUKCPC#ITKEWNVWTCN'ZRGTKOGPV 5VCVKQP$CVQP4QWIG.#RRŌ
&TGY6,CPF,9(NGYGNNKPI5QOGTGEGPV,CRCPGUGVJGQTKGUQH[KGNFŌ density relationships and their application to Monterey pine plantations. Forest Science 23: 517–534.
&TGY6,CPF,9(NGYGNNKPI5VCPFFGPUKV[OCPCIGOGPVCPCNVGTPCVKXG CRRTQCEJCPFKVUCRRNKECVKQPVQ&QWINCUſTRNCPVCVKQPU(QTGUV5EKGPEG 518–532.
)QXGTPOGPV QH %CPCFC &GRCTVOGPV QH 0CVWTCN 4GUQWTEGU %CPCFKCP (QTGUV5GTXKEG2CEKſE(QTGUVT[%GPVTG8KEVQTKC$%
(CTPFGP %( 4GEQOOGPFCVKQPU HQT EQPUVTWEVKPI UVCPF FGPUKV[ management diagrams for the province of Alberta. Report prepared for the /KPKUVT[QH#NDGTVC5WUVCKPCDNG4GUQWTEG&GXGNQROGPV#NDGTVC.CPFCPF Forest Division, Forest Management Section, Research Analysis Section. 17 pp.
(NGYGNNKPI,9CPF6,&TGY#UVCPFFGPUKV[OCPCIGOGPVFKCITCO for lodgepole pine. In&/$CWOICTVGT4)-TGDKNN,6#TPQVV,6 CPF)(9GGVOCP'FULodgepole Pine: the Species and Its Management. 9CUJKPIVQP5VCVG7PKXGTUKV[2WNNOCP9#RRŌ
(NGYGNNKPI,9-09KNG[CPF6,&TGY5VCPFFGPUKV[OCPCIGOGPV KPYGUVGTPJGONQEM(QTGUVT[4GUGCTEJ6GEJPKECN4GRQTV 9G[GTJCWUGT%QTRQTCVKQP9GUVGTP(QTGUVT[4GUGCTEJ%GPVGT%GPVTCNKC 9#
(14&# (QTGUVT[ 4GUGCTEJ CPF &GXGNQROGPV #IGPE[ #TECOCPKM %KIGTGPFGPI CPF %KMQNG (QTGUV 4GUGCTEJ $QQMNGV (QTGUVT[ 4GUGCTEJ and Development Agency, Ministry of Forestry of Indonesia, Jakarta, Indonesia.
*CVK[C - CPF 6 (WLKOQTK .CY QH FGPUKV[ GHHGEV CPF UVCPF FGPUKV[ EQPVTQN FKCITCO (QTGUVT[ #IGPE[ ,CRCP +PVGTPCVKQPCN %QQRGTCVKQP Agency, Tokyo, Japan.
*GTKCPU[CJ+5$WUVQOKCPF;-CPC\CYC5GNHVJKPPKPIUK\GXCTKCVKQP and long-term change in increment of merkus pine in a spacing trial. In: #TKſP'F6JG(WVWTG%JCNNGPIGUQH+PFQPGUKC5VTCVGIKGUVQ$WKNFCPF 'PJCPEGVJG%QORGVKVKXG#FXCPVCIGU*KTQUJKOC7PKX,CRCP
*KFC[CV,CPF%2*CPUGPPinus merkusii Jungh. Et de Vriese. Seed .GCƀGV&CPKFC(QTGUV5GGF%GPVTG*QGTUJQNO&GPOCTM
,CEM5$CPF,0.QPI.KPMCIGDGVYGGPUKNXKEWNVWTGCPFGEQNQI[CP analysis of density management diagrams. Forest Ecology and Management 86: 205–220.
,QPGU/CPF,.*CTRGT6JGKPƀWGPEGQHPGKIJDQTUQPVJGITQYVJ of tree. II. The fate of buds on long and short shoots in Betula pendula. 2TQEGGFKPIUQHVJG4Q[CN5QEKGV[.QPFQP$Ō
+PUVKVWVGPQ)QXGTPOGPVQH-QTGC5GQWNRRŌ=+P-QTGCPYKVJ English abstract].
-KTC 6 'F 5VCPF FGPUKV[ EQORGVKVKQP CPF RTQFWEVKQP 1UCMC 4GIKUVTCVKQP(QTGUVT[1HſEGŌŌŌ
-KTC6*1ICYCCPF;5CMC\CMK+PVTCURGEKſEEQORGVKVKQPCOQPI JKIJGTRNCPVU+%QORGVKVKQPŌFGPUKV[Ō[KGNFKPVGTTGNCVKQPUJKRKPTGIWNCTN[ dispersed population. Journal of the Institute of Polytechnics. Osaka City
University Series D4:1–16.
-KTC6*1ICYCCPF-*Q\WOK+PVTCURGEKſEEQORGVKVKQPCOQPI higher plants. II. Further discussion on Mitscherlich`s law. Journal of the
Institute of Polytechnics. Osaka City University Series D5:1–7.
-KTC6*1ICYC-*Q\WOKCPF-;QFC+PVTCURGEKſEEQORGVKVKQP COQPIJKIJGTRNCPVU85WRRNGOGPVCT[PQVGUQPVJG%Ō&GHHGEVJournal
of the Institute of Polytechnics. Osaka City University Series D7:1–14.
-WOCT$/,0.QPICPF2-WOCT#FGPUKV[OCPCIGOGPVFKCITCO for teak plantations of Kerala in peninsular India. Forest Ecology and Management 74:125–131.
.QPI,0#RTCEVKECNCRRTQCEJVQFGPUKV[OCPCIGOGPV6JG(QTGUVT[ %JTQPKENGŌ
.QPI,0,$/E%CTVGTCPF5$,CEM#OQFKſGFFGPUKV[OCPCIGOGPV FKCITCOHQTEQCUVCN&QWINCUſT9GUVGTP,QWTPCNQH#RRNKGF(QTGUVT[ 88–89.
/E%CTVGT ,$ CPF ,0 .QPI # NQFIGRQNG RKPG FGPUKV[ OCPCIGOGPV FKCITCO9GUVGTP,QWTPCNQH#RRNKGF(QTGUVT[Ō
Newton, P.F. 1997. Stand density management diagrams: review of their development and utility in stand-level management planning. Forest Ecology and Management 98: 251–265.
0GYVQP2(4GIKQPCNURGEKſECNIQTKVJOKEUVCPFFGPUKV[OCPCIGOGPV diagram for black spruce. Northern Journal of Applied Forestry 15: 94–97. 0GYVQP2(CPF)(9GGVOCP5VCPFFGPUKV[OCPCIGOGPVFKCITCOHQT
OCPCIGFDNCEMURTWEGUVCPFU6JG(QTGUVT[%JTQPKENGŌ
1NKXGT%&CPF$%.CTUQP(QTGUVUVCPFF[PCOKEU/E)TCYŌ*KNN New York, NY. 467 pp.
2GTWO2GTJWVCPK5VCVG1YPGF'PVGTRTKUGQH,CXC5VCVKUVKEQHŌ Jakarta, Indonesia.
5JKPQ\CMK - 5GNHVJKPPKPIIn 0WOCVC / 'F (QTGUV 'EQNQI[ Kokon-Shoin, Inc. Tokyo, Japan. pp. 178–180.
5JKPQ\CMK-CPF6-KTC+PVTCURGEKſEEQORGVKVKQPCOQPIJKIJGTRNCPVU 8++.QIKUVKEVJGQT[QHVJG%Ō&GHHGEV Journal of the Institute of Polytechnics.
Osaka City University Series D7: 35–72.
5JKPQ\CMK-CPF6-KTC+PVTCURGEKſEEQORGVKVKQPCOQPIJKIJGTRNCPVU :6JG%Ō&TWNGKVUVJGQT[CPFRTCEVKECNWUGU,QWTPCNQH$KQNQI[ Osaka
City University Series 12: 69–78.
Tadaki, Y. 1963. The pre-estimating of stem yield based on the competition FGPUKV[GHHGEV$WNNGVKPPQ)QXGTPOGPV(QTGUV'ZRGTKOGPV5VCVKQP Tokyo, Japan [In Japanese with English summary].
;QFC-6-KTC*1ICYCCPF-*Q\WOK5GNHVJKPPKPIKPQXGTETQYFGF pure stands under cultivated and natural conditions. Journal of Biology.