DESCRIPTION OF THE INDUSTRY
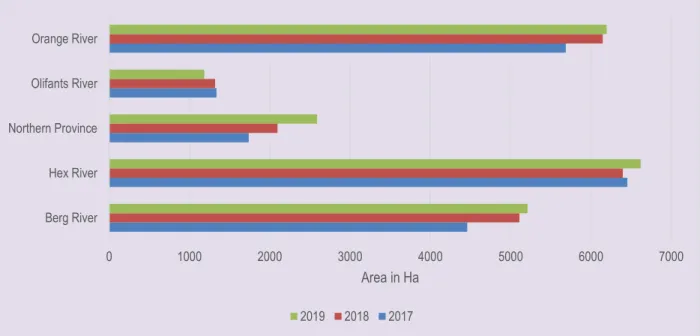
- Production areas
- Production quantities
- Main cultivars
- Number of producers and employment
This is mainly due to stable conditions in South Africa's main growing areas, particularly in the Berg and Hex River valleys. The total number of agricultural workers in the table grape sector in the period 2017 to 2019 is shown in Table 2.
MARKET STRUCTURE
Domestic markets and prices
National Minimum Wage Commission, which is tasked with reviewing the national minimum wage and making recommendations to the Minister on any adjustment to the national minimum wage.
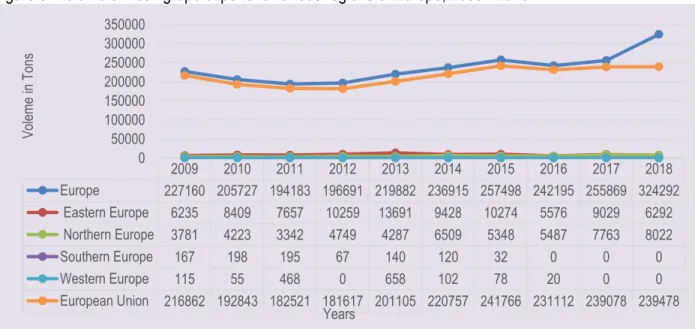
Exports (fresh and dried grapes)
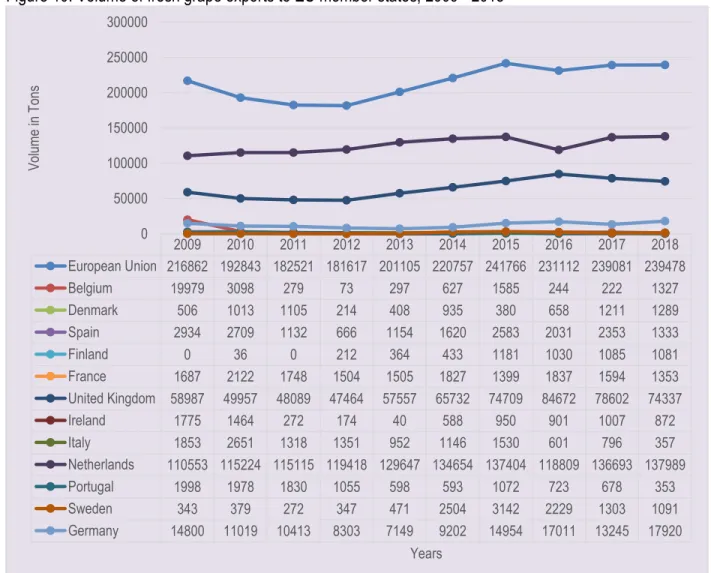
- Fresh grapes exports to different regions
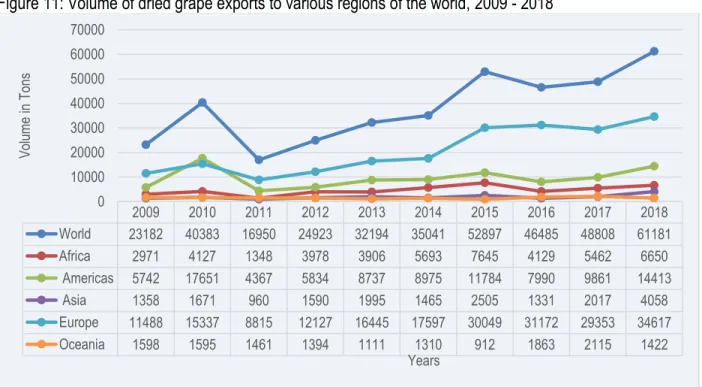
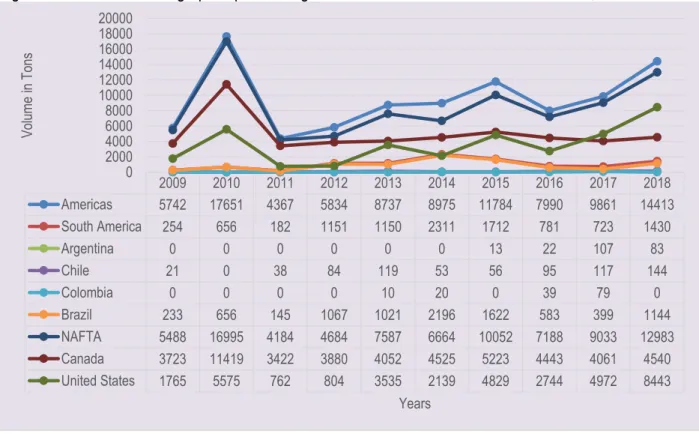
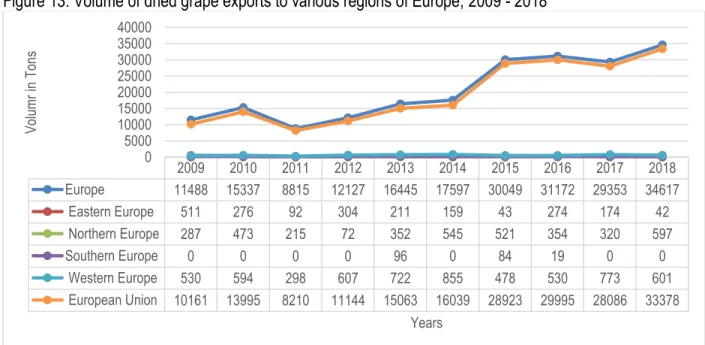
- Dried grapes exports to different regions
The volumes of South Africa's dried grapes exported to the different regions of Europe over the past decade are shown in Figure 14. In 2018, Germany accounted for (tonne) of the total South African dried grapes exported to the European Union.

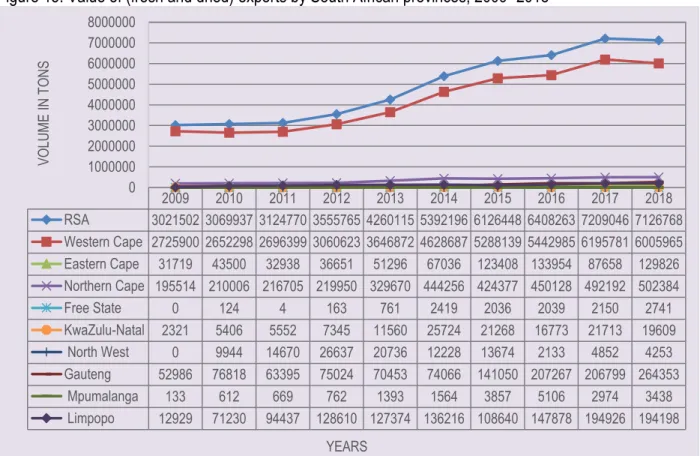
Provincial and district export values of South African grapes
The figures below (Figures 16 – 24) show the value of table grape exports from the various districts in the nine provinces of South Africa. According to Figure 16, the majority of table grape exports recorded over the past ten years were from the Cape Town and Cape Winelands districts. The value of table grape exports to the city of Tshwane increased significantly between 2015 and 2018.
During 2018, R10 million and R169 million worth of grape exports were recorded in the Ekurhuleni and City of Johannesburg municipalities respectively. It can be observed from Figure 18 that table grape exports from the Northern Cape province are mainly from Siyanda District Municipality. The value of table grape exports from the Siyanda district increased significantly between 2014 and 2018 and only recorded a decrease in 2015.
There have been wide fluctuations in the values of grape exports reported especially from the eThekwini district over the last decade. It is clear from Figure 22 that the exports of table grapes from Mpumalanga province are mainly from Ehlanzeni and Nkangala district municipalities.
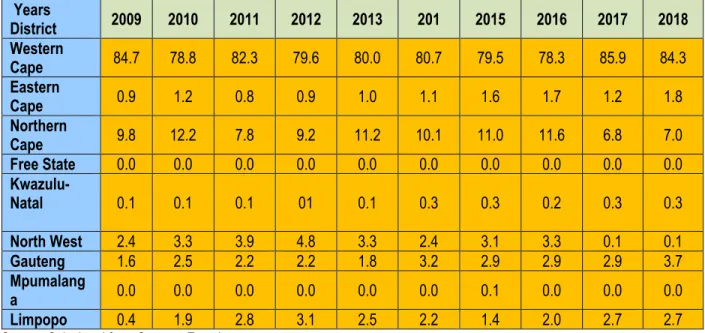
Share analysis
The following tables (Tables 5 - 13) show the share of the district's table grape exports of the total provincial table grape exports. The proportion of the district's table grape exports to Gauteng provincial table grape exports is shown in Table 6. Between 2009 and 2018, all reported table grape exports from the Northern Cape Province were from Siyanda District (see Table 7).
Since 2009, almost all reported table grape exports in the Eastern Cape have been from the Nelson Mandela district. The share of district table grape exports to the total Kwazulu Natal provincial table grape exports is presented. In the Limpopo Province, the leading districts in terms of table grape exports are the Mopani and Greater Sekhukhune districts, which account for almost 100% of the total Limpopo table grape exports between 2010 and 2018 (see Table 10).
More than half of the reported exports of table grapes in Mpumalanga province during 2018 were from Nkangala district (54.6%). Dr Ruth Segomotsi Mompati District in the North-West has been the sole contributor to total North-West provincial table grape exports since 2009.
Imports (fresh and dried grapes)
GROWTH, VOLATILITY AND STABILITY ANALYSIS
As shown in Table 14 above, the table grape industry experienced a positive growth rate from 2009 to 2018 in terms of production volumes and gross value of most categories with the exception of imports. Volumes and gross value of dried grapes and volumes sold at the NFPMs which experienced negative growth in the same period. As mentioned above, South Africa is a net exporter of table grapes and it is not surprising when imports experience negative growth. Similarly, as mentioned above, South Africa's table grape industry is export-oriented, and a negative growth in volumes sold at the NFPMs comes as no surprise.
Low volatility was indicated by coefficients of variation less than one (<1). All variables have values less than 1, which means that on a weighted variance scale they showed minimal changes for table grapes during the ten years reviewed.
MARKET INTELIGENCE
Competitiveness of South African table grape exports
The Netherlands, UK, Germany and Hong Kong, China have a larger market share of South African fresh grapes. In terms of market size, the United States was the largest market for fresh grapes in 2018, with fresh grape imports valued at just over $1.7 billion, or about 18.5% of the world fresh grape market. Second was the Netherlands with fresh grape imports worth just over $824 million, or about 8.7% market share followed by Germany with fresh grape imports worth just over $753 million, or about 8% market share .
The United Kingdom was fourth with just over $691 million in fresh grape imports, or about a 7.3 percent market share. At the same time, South African exports of dried grapes declined faster than global imports to Japanese markets. The United States of America, Algeria, France, Germany and the Netherlands have the largest market share of South African dried grapes.
In terms of market size, the United Kingdom was the largest market for dried grapes in 2018 with just over $199 million of dried grape imports, or approximately 10.9% of the global dried grape market. While three countries dominate global imports of dried grapes, it is interesting to note that countries such as the United States, along with Vietnam, have a higher annual growth rate.

South Africa vs. Southern hemisphere production
In the meantime, the tariffs that were in effect before the contract expired are still in effect. A certificate of conformity must be obtained by anyone wishing to export and sell fruit in the EU, if that fruit falls under the jurisdiction of EU marketing standards. The essence of the directive is that it authorizes plant protection services to inspect a large number of fruit products upon arrival in the EU.
If the shipment does not meet the requirements, it may not enter the EU although certain organisms may be fumigated at the expense of the exporter. iii). The number of farms that are fully owned by women is increasing and the majority of farms comply with BEE. The following discussion will focus on the main segments of the table grape value chain.
Carriers serve as a key link in the fresh fruit supply chain by facilitating the physical transfer of produce between parties such as the producer, cold store and terminal operator. Under the PPECB Act (Act 9 of 1983), the PPECB is responsible for "the control of perishable products intended for export from the Republic of South Africa".
South Africa vs. Southern hemisphere exports in 2014
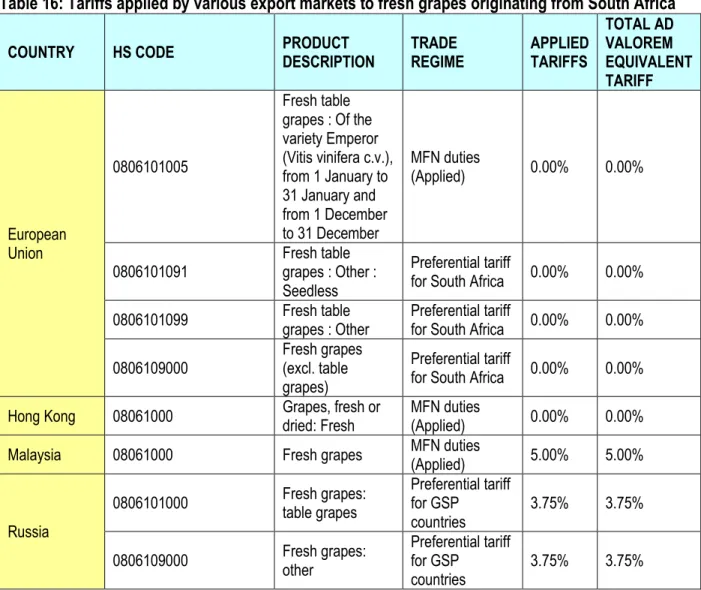
MARKET ACCESS
- Tariffs, quotas and the price entry system
- European Union (EU)
- Tariff barriers
- Non tariff barriers
- United States of America (USA)
- Tariff barriers
- Non tariff barriers
- Japan
- China
The agreement covered about 90% of bilateral trade between the two sides and provided for the liberalization of 95% of EU imports from South Africa within ten years and 86% of South African imports from the EU in twelve years. There are other non-tariff barriers, including the phytosanitary and food health requirements set out in EU legislation, marketing standards and certificates of conformity, and the ever-changing demand patterns of EU consumers. When the value of the imported lot is between 92% and 94% of the import price, 8% of the import price will be added to the normal customs duty.
When the value of the imported party is between 94% and 96% of the entry price, 6% of the entry price will be added to the normal customs duty. When the value of the imported party is between 96% and 98% of the entry price, 4% of the entry price will be added to the normal customs duty. When the value of the imported party is between 98% and 100% of the entry price, 2% of the entry price will be added to the normal customs duty.
The European Commission sets rules for materials that come into contact with food that can endanger human health or cause an unacceptable change in the composition of food. In addition to phytosanitary regulations, the USDA Food Safety Inspection Services (FSIS) regulates sanitary practices in food packaging, while the Food and Drug Administration (FDA), which is part of the United States Department of Health, regulates packaging and labeling.
DISTRIBUTION CHANNELS
LOGISTICS
Mode of transport
Cold chain management
Packaging
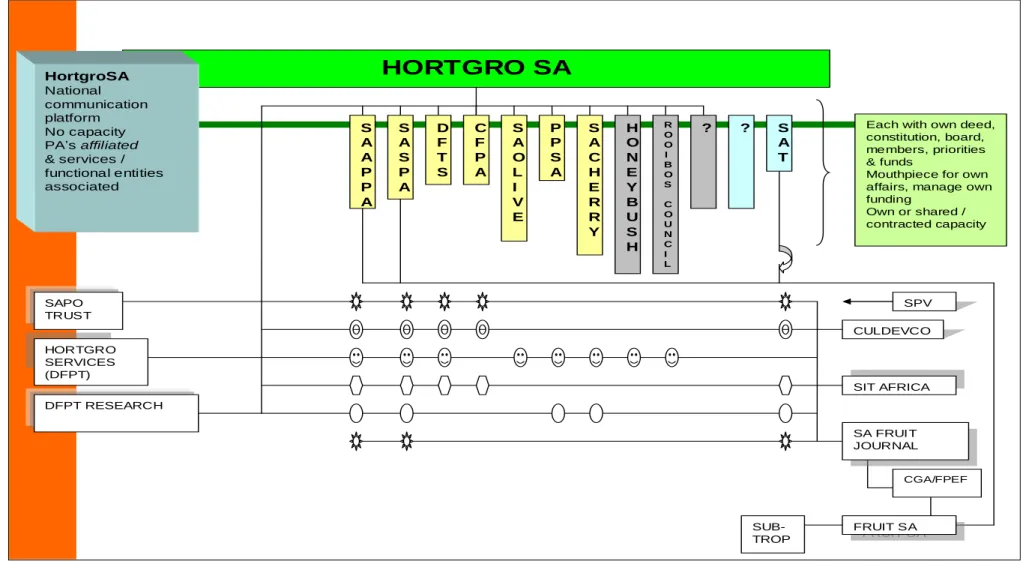
ORGANIZATIONAL ANALYSIS
Producer and associated organizations
Gain greater access to the international market for South African grapes and provide effective information systems to enable growers and exporters to make informed decisions. Recently established, Fruit South Africa is the umbrella organization for the South African fruit industry. Another important entity in the table grape or deciduous industry in general is the South African Plant Improvement Organization (SAPO).
SAPO is a specialist plant breeding organization owned by soft fruit growers, DPFT, Cape Pomological Association (CPA), and Dry Fruit Technical Services (DTD). It is responsible for the production of certifiable propagating plant material and for phytosanitary and genetic upgrading (improvement) of soft fruit plant material. This includes virus elimination and testing, establishment and maintenance of core, foundation and mother blocks, as well as selection of propagating material and adherence to variety control.
SAPO is the main supplier of such propagating plant material to soft fruit nurseries and around 14 million propagating units are distributed to nurseries annually. SAPO is also a specialist in importing new varieties and a leader in variety development and commercialization.
Empowerment issues and transformation in the table grape industry
It is a non-profit organization made up of the Southern African Citrus Growers Association (CGA) representing citrus growers; HORTGRO (representing pome and stone fruit); South African Table Grape Industry (SATI); SUBTROP (representing the avocado, litchi, mango and macadamia industries) and the Fresh Produce Exporters Forum (FPEF).
LOCAL BUSINESS OPPORTUNITIES AND CHALLENGES
TABLE GRAPE SUPPLY VALUE CHAIN
PPECB (Inspection Officer)
The PPECB also acts as the government's "agent" within the meaning of the Agricultural Products Standards Act (APS) (Act 119 of 1990) and is responsible for the "control of the sale and export of agricultural and allied products". All PPECB and other inspection regulations, protocols or requirements must be met and observed. The Information and Communication Procedure (ICP) should therefore be considered in conjunction with the PPECB Act and its regulations, the APS Act and those temperature and other specific handling protocols and procedures established by the PPECB in conjunction with industry.
As more emphasis is placed on food safety and customers demand higher quality standards, the PPECB and other inspection bodies play an increasingly important role in the export of fresh produce from South Africa.
Port and terminal operators
ACKNOWLEDGEMENTS