Erik Dietzenbacher,Department of Econometrics, University of Groningen
The effects of process and product innovation are analyzed in a multisectoral framework. The effect of an innovation in any particular sector propagates throughout the entire economy. A simple measure for the spillover of innovation effects to the other sectors is developed. As a consequence, an alternative viewpoint is obtained for the interpretation of the elements of the Leontief inverse and the traditional measures for interindustry linkages. An empirical application is given for the European Union in 1991. 2000 Society for Policy Modeling. Published by Elsevier Science Inc.
1. INTRODUCTION
Technological changes, and innovations in particular, are impor-tant determinants of economic growth. The effects of innovations propagate throughout the economy and get embodied in other products and production processes. This paper analyzes the propa-gation of innovation effects in a multisector framework. It attempts to quantify the spillovers to other sectors by answering the following question: What happens to the sectoral structure of production if an innovation takes place in one particular sector, leaving all other things equal? Clearly, this question covers two unrealistic assump-tions. First, it may be expected that innovations occur not in one sector at a time, but in many (or all) sectors simultaneously. Second, it may be expected that innovations affect the decisions made by the agents (such as consumers, producers, or the government).
Address correspondence to E. Dietzenbacher, Department of Econometrics, University of Groningen, P.O. Box 800, 9700 AV Groningen, The Netherlands.
I would like to thank Jan Oosterhaven and Jan A. van der Linden for the stimulating discussions. The anonymous referees are acknowledged for their useful comments. An earlier version of this paper was presented at the Eleventh International Conference on Input–Output Techniques, November 1995 in New Delhi.
Received October 1996; final draft accepted March 1997.
Journal of Policy Modeling22(1):27–42 (2000)
The aforementioned question obviously is of the “what-if” type and its answer thus describes the potential propagation effects. The reason for posing the question in this form is motivated by the difficulties encountered in the literature on analyzing structural changes. For example, take last year’s input–output table as a starting point. All the cumulated effects of innovations are then, together with many other effects, reflected by this year’s table. In answering the question what actuallyhashappened, all these ef-fects have to be disentangled. Structural decomposition techniques have been widely used for this purpose.1Major shifts in an econ-omy are distinguished into their key determinants. In most applica-tions, all changes in the production structure are considered as one of those key determinants. Typically, however, this determinant is not decomposed further into its constituent parts,2such as techno-logical changes and sectoral innovations. Therefore, it is in this paper chosen to approach the problem from the other side and examine the potential propagation of innovation effects.
Consider a multisector economy and suppose that for the pro-duction of good j all products are used as an input, next to the primary factors labor and capital. Assume that the innovation effects are reflected by changes in the input coefficients. Two types of innovation are distinguished. Process innovation means that more output can be produced with the same amounts of the differ-ent inputs, affecting the coefficidiffer-ents column-wise. This implies a shift of the production function and the isoquant. Product innova-tion means that, in each of thenproduction processes, the same amount of output can be obtained with a smaller amount of this product as an input. Hence, the coefficients in a row are changed. In a multisectoral framework, innovation in one process or product also affects the production in other sectors.3 If process innovations takes place in sectork, this carries over to sector j,
1For recent contributions, see, for example, Wolff (1985, 1994), Feldman, McClain, and Palmer (1987), Blair and Wyckoff (1989), Kanemitsu and Ohnishi (1989), Skolka (1989), Barker (1990), Afrasiabi and Casler (1991), Fujita and James (1991), Miller and Shao (1994), Lin and Polenske (1995). Pyatt and Round (1979) and Round (1985) present a decomposition of multipliers in a SAM framework. For critical evaluations of structural decomposition techniques, see Schumann (1994) or Dietzenbacher and Los (1997). A detailed review of the literature is provided by Rose and Casler (1996).
2A rare exception is Van der Linden and Dietzenbacher (1995), where the RAS proce-dure is applied to decompose coefficient changes into productivity changes, economywide substitution patterns, and sector-specific substitutions.
which uses the output of sector k, and so forth. If product k is innovated, each process uses less of this product. Indirectly, each process also requires less of any other productibecause product
iis used in processk, and so forth. Propagation of the innovation effects in one sector (or of coefficient changes, in general) may thus be analyzed by examining its spillovers. That is, the extent to which the production in other sectors is affected. In this paper a surprisingly simple measure for these spillovers is developed.
The next two sections present the analytical results for process and product innovation, respectively. Using the standard Leontief model, it turns out that the spillover measures are directly based on the elements and the column sums of the Leontief inverse. Consequently, an alternative interpretation of the elements of the Leontief inverse in terms of innovation propagation is obtained. As an illustration, the empirical results for the European Union in 1991 are discussed in Section 4.
2. PROCESS INNOVATION
The standard Leontief model is given by
x5Ax1f, (1)
wherex is the vector of sectoral outputs and f the vector of final demands (private consumption, government expenditures, invest-ments, and exports). As usual, it is assumed that each of the n
sectors produces exactly one good.Ais then3nmatrix of input coefficients. Its typical elementaij denotes the amount of product
irequired, as an input in process j, for the production of one unit of output of goodj. The model in Equation 1 is solved as
x5Lf, withL5(I2A)21. (2)
The matrix L is the Leontief inverse, or multiplier matrix.4 Its elementlij denotes the additional output of productias required (directly and indirectly) per additional unit of final demand for goodj. Or, equivalently, lij 5 Dxi/Dfj.
An innovation in processk is defined as
aik5(12 a)aik, fori51, . . . ,n, (3)
with 0, a ,1. All other coefficients remain the same (i.e.,aij5
4It is assumed thatAis nonnegative and irreducible, and has a dominant eigenvalue smaller than one. Consequentlylij.0 for alli,j51, . . . ,n(see, e.g., Takayama, 1985,
aijfor alli51, . . . ,nandj≠k).5Process innovation implies that the same amounts of the inputs yield an increased amount of output in process k. Or, in other words, per unit of output of productk the use of each input is decreased with 100a percent. Analogous to Equations 1 and 2, the model is given by x5
Ax1 f, and its solution by x5Lf.
It should be emphasized that the innovation as defined in Equa-tion 3, is unlikely to be actually observed in exactly this form. The common assumption that each sector produces just one good is too restrictive, in particular at the aggregation level of most published input–output tables. In an ex-post analysis of the effects as they actually have occurred, this assumption would, therefore, cast serious doubts on the results. The present analysis, however, examines the potential for the propagation of innovation effects, under the hypothesis that the innovation takes the form as in Equation 3.
The effects of process innovation can now be measured as fol-lows. Per additional unit of final demand for goodk, less output needs to be produced. That is,Dxi/Dfk2 Dxi/Dfk5lik2lik, which is negative becauseL!L(see, e.g., Takayama, 1985).6Using the series expansion of the Leontief inverse (i.e.,L5I 1A1A21
A3 1 . . .) and writing e
k for the kth unit vector, the vector Dx/ Dfk can be written as
Dx/Dfk5Lek5ek1Aek1
o
∞t52Atek.Similarly,
Dx/Dfk5Lek5ek1Aek1
o
∞t52Atek5ek1(12 a)Aek1o
∞t52Atek.Thus,
Dx/Dfk2Dx/Dfk5 2aAek1
o
∞t52(At2At)ek. (4)Per unit final demand for goodk, all outputs decrease because the innovated process k requires less of each input. This is the direct effect as given by2aAek. The production of each of these inputs requires (among other inputs) the input of goodk. In its turn, the production process of goodkis innovated and requires
5See Van der Linden et al. (1993) for an application of (3) in terms of fields of influences (see, e.g., Hewings et al., 1989, or Sonis and Hewings, 1989, 1992).
6For vectors and matrices we adopt the following expressions and notations. Positive,
x@0, ifxi.0 for alli. Nonnegative,x>0, ifxi>0 for alli. Semipositive,x.0, ifx>
less inputs, and so forth. All these effects are captured by the term
o
∞t52(At 2At)ek, the indirect effects.In the same way, the effects of process innovation can be de-scribed per additional unit final demand of good j(≠k). From
Dx/Dfj5ej1Aej1
o
∞t52Atej5ej1Aej1o
∞t52Atej,it immediately follows that
Dx/Dfj2Dx/Dfj5
o
∞t52(At2At)ej. (5)Becausej≠k, the direct effect is absent, implying that all effects are indirect.
The termsDxi/Dfk2Dxi/Dfk(fori51, . . . ,n) express the effects of process innovation as embodied in an additional unit final demand for goodk. The innovation in processk has propagated and its effects are also present in the other final demands. The termsDxi/Dfj2Dxi/Dfj(withj≠k) indicate the effects as embodied in an additional unit final demand for goodj.
In constructing a measure for the amount of propagation, the change in the output of sectoriis related to the change in sector
k, i.e., the sector where the innovation has taken place.
Dxi/Dfj2Dxi/Dfj Dxk/Dfj2Dxk/Dfj
5 lij2lij
lkj2lkj
(6)
Next, it is shown that expression 6 equalslik/(lkk 21). Note that this ratio does not depend onj. Therefore, Equation 6 measures the propagation of the innovation in processk, irrespective of the specific structure of final demands.
Observe that A 5A2 a(Aek)e9k, where a prime is used to denote transposition. Using well-known formulae for the inverse of a sum of matrices (see, e.g., Henderson and Searle, 1981, for an overview) yields
L2L5 2aLAeke9kL/[11 ae9kLAek].
UsingLA5L 2I, it follows that
L2L5 2 a(L2I)eke9kL/[11 ae9k(L2I)ek.
The denominator is a scalar which shall be denoted byhk,
hk511 a(lkk21).
Notice that L 2L is a matrix of rank one. Its typical element
lij2lij5 2 aliklkj/hk, fori?k,
lkj2lkj5 2 a(lkk21)lkj/hk. (7)
Substituting Equation 7 into 6 yields
Dxi/Dfj2Dxi/Dfj Dxk/Dfj2Dxk/Dfj
5 lik
lkk21
, (8)
which holds for allj5 1, . . . ,n.
Note that the ratio in Equation 8 is independent of bothaand the index j. Obviously, the magnitude of the total effects does depend onaand the specific vectorf. Compare, for example, the case after innovationx 5Ax1fwith the case before innovation
x5Ax 1f. Then Equation 7 implies
xi2xi5 2alik
o
jlkjfj/hkxk2xk5 2a(lkk21)
o
jlkjfj/hk.Although the propagation of innovation effects clearly depends uponaandf, its distribution over the sectors is always the same. This is a consequence of the matrixL 2L having rank one.
The spillover of innovation effects is defined as the percentage of the total ouput change that occurs in sectorsi other than the innovated sector k. Define the kth column sum of the Leontief inverse asck, that is,
ck5
o
ilik.Then, the spillover of the effects of process innovation in sector
kis given as sk 5100[
o
i?k(xi2xi)]/[o
i(xi2xi)], which yieldssk5100(ck2lkk)/(ck21).
Alternative measures that are related to sk are the average sectoral spillover defined as sk/(n 21) and the relative spillover 100(ck2lkk)/(lkk21), which relates the output changes in sectors
ito the change in the innovated sectork.
3. PRODUCT INNOVATION
Product innovation in sector kis defined as
akj5(12 a)akj, forj51, . . . ,n (9)
Let the final demand for an arbitrary good, sayj, be increased. This affects the production in sectork. Directly, because process
juses less of productkas an input. And indirectly, because process
juses all products as an input while each of these products requires less inputs from sectork. This yields
Dxk/Dfj2Dxk/Dfj5lkj2lkj5e9k(L2L)ej
5 2aakj1
o
∞t52ek9(At2At)ej. (10)The first term indicates the direct effect, the second term the indirect effects. An additional final demand of productjalso affects the production in sectori(≠k). In this case, however, the decrease in production is due only to indirect effects;
Dxi/Dfj2 Dxi/Dfj5lij2lij5
o
∞t52e9i(At2At)ej. (11)The measure for propagation is based again on the ratio in Equation 6. Using A5A2 aek(e9kA) and substituting AL 5
L2I in the inverse of a sum of matrices yields
L2L5 2aLeke9k(L2I)/[11 ae9k(L2I)ek].
The denominator equalshk 51 1 a(lkk2 1) again, which gives
lij2lij5 2 aliklkj/hk, forj?k,
lik2lik5 2 alik(lkk21)/hk.
Substituting these expressions in Equation 6 yields
Dxi/Dfj2 Dxi/Dfj
Dxk/Dfj2 Dxk/Dfj
5 lik
lkk
, (12)
which holds for all j 5 1, . . . , n. Note that this ratio is again independent of both the specific final demand (fj) and a. The spillover of the product innovation effects is measured as the percentage of the total ouput change that occurs in the sectors i
(≠k). This yields
s˜k5100(ck2lkk)/ck.
The terms lik/(lkk 2 1) in Equation 8 and lik/lkk in Equation 12 provide an alternative interpretation of the elements of the Leon-tief inverse. For example,lik/lkkmeasures the output gain in sector
irelative to the output gain in sector k, induced by an arbitrary increase of the final demands, when product innovation takes place in sectork. That is to say, the propagation to sector iof a product innovation in sectork.
4. EMPIRICAL RESULTS
This section presents the results for the European Union for 1991. The calculations are based on a recently prepared 25-sector table for the entire Union, published by Eurostat (see Ungar and Heuschling, 1994). It should be emphasized, however, that this “is a projection of the harmonized national tables for 1985, based on the Eurostat statistics currently available for the aggregates and branches.” The sector classification is given in the Appendix. With respect to the flows in the input–output table, it should be stressed that the figures for sector 23 (credit and insurance) cannot be given an adequate interpretation in terms of economic activity. It appears that this sector predominantly depends of itself, while other sectors show only a minor dependence on sector 23. Due to the accounting rules in the European System of Integrated Economic Accounts (ESA), the imputed charges are recorded as a delivery of the credit sector to itself. Therefore, the corresponding input coefficient amounts to 0.575, which is by far the largest. A consequence is that the diagonal elementlkkof the Leontief inverse is also unrealistically large. The same holds for the traditional linkage indicators (i.e., the column sumsck).7
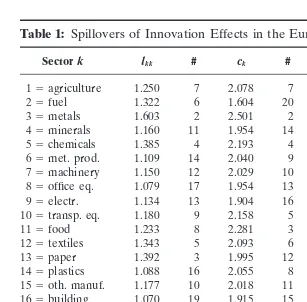
Table 1 presents the results for the diagonal elementslkkof the Leontief inverse, its column sumsck, the spillovers sk of process innovation effects, and the spillovers s˜k of product innovation effects. The spillovers are recorded as a percentage of the total innovation effects. The rankings are presented in the columns under number.
The results in Table 1 indicate that for a process innovation in sectork, on average 80.5 percent of the total output change occurs in sectors other than k. The spillovers range from 42.4 percent
Table 1: Spillovers of Innovation Effects in the European Union, 1991
Sectork lkk # ck # sk # s˜k #
15agriculture 1.250 7 2.078 7 76.8 18 39.8 14
25fuel 1.322 6 1.604 20 46.7 24 17.6 25
35metals 1.603 2 2.501 2 59.8 23 35.9 16
45minerals 1.160 11 1.954 14 83.2 15 40.6 11 55chemicals 1.385 4 2.193 4 67.7 21 36.9 15 65met. prod. 1.109 14 2.040 9 89.5 10 45.6 3 75machinery 1.150 12 2.029 10 85.4 12 43.3 8 85office eq. 1.079 17 1.954 13 91.7 8 44.8 6 95electr. 1.134 13 1.904 16 85.1 13 40.4 12 105transp. eq. 1.180 9 2.158 5 84.5 14 45.3 5
115food 1.233 8 2.281 3 81.8 17 45.9 2
125textiles 1.343 5 2.093 6 68.6 20 35.8 17
135paper 1.392 3 1.995 12 60.6 22 30.2 20
145plastics 1.088 16 2.055 8 91.6 9 47.0 1
155oth. manuf. 1.177 10 2.018 11 82.6 16 41.7 9
165building 1.070 19 1.915 15 92.4 7 44.1 7
175trade 1.035 22 1.518 23 93.3 3 31.8 19
185lodging 1.007 25 1.846 17 99.2 1 45.4 4
195inland tr. 1.025 23 1.713 19 96.5 2 40.2 13 205m&air tr. 1.062 20 1.821 18 92.4 5 41.7 10 215auxil. tr. 1.077 18 1.532 22 85.6 11 29.7 22 225communic. 1.020 24 1.266 25 92.4 6 19.4 23
235credit 2.370 1 3.379 1 42.4 25 29.9 21
245other m.s. 1.104 15 1.341 24 69.6 19 17.7 24 255non-m.s. 1.040 21 1.558 21 92.9 4 33.3 18
Average 1.217 1.950 80.5 36.9
for credit (sector 23) to 99.2 percent for lodging (sector 18). In interpreting the results, recall that for a process innovation the direct effect is either absent or affects all sectors. The indirect effects are related to the total (i.e., direct plus indirect) use of inputs in sectork. The spillovers are thus connected to the extent to which the innovated sectork depends, directly plus indirectly, on inputs from the other sectors. As a consequence, sectors that depend predominantly on itself will exhibit low spillovers. Sectors with large diagonal elementslkkwill typically have small spillovers
but thatlkkshould be viewed in combination withck. For example, fuel has a diagonal element lkk that is somewhat above average, its column sumck, however, is rather small implying that there is little dependence on the other sectors. On the whole, the larger spillovers of process innovation effects are reported for the service sectors. These sectors typically depend to a large extent on other sectors.
The spillovers of product innovation effects are found to be larger for the manufacturing sectors than for the service or raw materials sectors. On average, 36.9 percent of the total output change due to a product innovation in sectorktakes place in the other sectors. The spillovers range from 17.6 percent for fuel (sector 2) to 47.0 percent for rubber and plastic products (sector 14). The spillovers for product innovation are found to be, roughly speaking, two to three times smaller than those for process innova-tion. The basic difference between the spillovers for process inno-vation and those for product innoinno-vation is caused by the direct effect. In the case of a process innovation there are either no direct effects involved or they affect all sectors. Product innovation, however, directly affects the production of sector k. The subse-quent indirect effects then describe the dependence of sector k
on the production sectors (including itself). The spillovers measure the output change in all other sectors as a percentage of the total output change. The inclusion of the direct effect explains why the spilloverss˜kare two to three times smaller than the spillovers sk. A widespread measure for sectoral interdependencies (or link-ages) in an input–output table are the column sums ck of the Leontief inverse.8They are interpreted as the sector’s dependence on inputs (both directly and indirectly) and are usually termed total, or direct plus indirect, backward linkages. Rasmussen (1956) has argued that the column sum (ck), the column sum minus 1 (ck 2 1), and the column sum minus its diagonal element (ck 2
lkk) are all relevant for calculating the strength of an industry’s backward linkages (although the column sum has become the traditional measure). Diamond (1976, p. 762) reports that, when the analysis is carried out on all three measures, “typically incom-patible rankings of industries will be derived.”9 The results in
8See, for example, Oosterhaven (1981), Miller and Blair (1985), or Dietzenbacher (1992) for overviews, also of alternative linkage measures.
Table 1 may serve as a further illustration of this. The rankings ofckandsk(orckands˜krespectively) differ by five or more places in no less than 19 (resp. 14) sectors.
The spillovers have been expressed as the percentage of the total output change that occurs in sectors other than the innovated sector. This percentage was independent of the “size” of the inno-vation (i.e., a) or the final demand vector f. The magnitude of the spillovers, however, does depend onaand onf. To get some indication of the size of the spillovers in money terms, calculations were carried out fora 50.01, while forfthe final demand vector in the original input–output table was taken. The total output change is obtained ase9(x 2 x), where e9 5 (1, . . . , 1) denotes the summation vector. The total output decreases ifais positive. Therefore, the total effect is measured as the output reduction (which is a positive number).
In the case of a process innovation in sectork, the total effect is
tk5e9(x2x)5 a(ck21)xk/hk. (13)
Note thathk 51 1 a(lkk21) so that the relation in Equation 13 is nonlinear. Fora 51 percent, however, hkranges from 1 to 1.014 (or 1.006 if sector 23 is excluded). This implies that for small values ofathe expression in Equation 13 is approximately linear in a. That is, tk ≈ a(ck 2 1)xk, expressing that the total effect depends on the size of the innovated sector (i.e.,xk) and on its backward linkages (i.e.,ck). Given the average value of 1.950 for
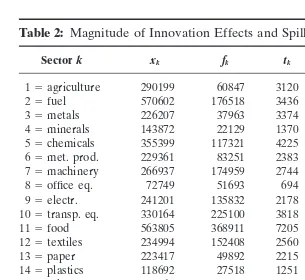
ck in Table 1, this means that a 1 percent process innovation in sectorkwould induce a reduction in total output that equals on average 0.95 percent of this sectors’s output. The magnitude of the spillovers is given bysktk in Table 2.
For a product innovation the total effect is obtained as
t˜k5e9(x2x)5 ack(xk2fk)/hk. (14)
For small aagain, this yieldst˜k ≈ack(xk2 fk). The total effect thus depends on the intermediate deliveries sold by sectork(i.e.,
xk2 fk) and on its backward linkages (i.e.,ck).
Table 2: Magnitude of Innovation Effects and Spillovers, in Mio. ECU
Sectork xk fk tk sktk t˜k s˜kt˜k
15agriculture 290199 60847 3120 2396 4754 1893
25fuel 570602 176518 3436 1604 6301 1108
35metals 226207 37963 3374 2019 4679 1680
45minerals 143872 22129 1370 1140 2375 965
55chemicals 355399 117321 4225 2862 5202 1917 65met. prod. 229361 83251 2383 2133 2978 1359 75machinery 266937 174959 2744 2344 1864 808
85office eq. 72749 51693 694 636 411 184
95electr. 241201 135832 2178 1854 2004 810
105transp. eq. 330164 225100 3818 3226 2264 1027
115food 563805 368911 7205 5893 4435 2037
125textiles 234994 152408 2560 1756 1723 617
135paper 223417 49892 2215 1343 3449 1043
145plastics 118692 27518 1251 1146 1872 880
155oth. manuf. 141065 81394 1433 1184 1202 501 165building 645834 512440 5905 5454 2553 1127
175trade 955141 660614 4944 4614 4469 1423
185lodging 267706 222875 2265 2246 828 376
195inland tr. 200056 84163 1427 1377 1985 798 205m&air tr. 89788 64749 737 681 456 190
215auxil. tr. 86678 21218 461 394 1002 298
225communic. 124242 47276 331 306 974 189
235credit 269732 56432 6330 2684 7110 2122
245other m.s. 1444154 739726 4919 3423 9436 1670 255non-m.s. 1096478 1026491 6120 5685 1090 363
and s˜kt˜k ranges from 1.2 in sectors 3 and 4, to 15.7 in sector 25. This ratio is found to be small for the raw materials sectors and large for service sectors.
5. CONCLUSIONS
In a multisector economy the effects of innovations propagate and get embodied in the products of other sectors. In this paper the propagation was analyzed of the effects of two specific types of innovation. First, process innovation was defined as the case where a sector produces more output with the same amounts of the different inputs. Second, product innovation meant that each sector produces the same amount of output with less input of the innovated product.
The spillovers of innovation effects were defined as the percent-age of the total output change that occurs in sectorsiother than the innovated sectork. It was shown that the spillovers are inde-pendent of the “size” of the innovation and of the specific structure of final demands. The spillover measures are directly related to the diagonal elements of the Leontief inverse and its column sums. This allowed for an alternative interpretation of the elements of the Leontief inverse.
Appendix: Sector classification
Sectork Description
15agriculture agriculture, forestry, and fishery products 25fuel fuel and power products
35metals ferrous and nonferrous ores and metals 45minerals nonmetallic mineral products
55chemicals chemical products
65met. prod. metal products (except machinery and transport equipm.) 75machinery agricultural and industrial machinery
85office eq. office and data processing machines, etc. 95electr. electrical goods
105transp. eq. transport equipment 115food food, beverages, tobacco
125textiles textiles and clothing, leather, footwear 135paper paper and printing products
145plastics rubber and plastic products 155oth. manuf. other manufacturing products 165building building and construction
175trade recovery, repair services, wholesale and retail trade 185lodging lodging and catering services
195inland tr. inland transport services
205m&air tr. maritime and air transport services 215auxil. tr. auxiliary transport services 225communic. communication services 235credit credit and insurance 245other m.s. other market services 255non-m.s. nonmarket services
Source: Ungar and Heuschling (1994).
REFERENCES
Afrasiabi, A., and Casler, S.D. (1991) Product-Mix and Technological Change within the Leontief Inverse.Journal of Regional Science31:147–160.
Barker, T. (1990) Sources of Structural Change for the UK Service Industries 1979–84.
Economic Systems Research2:173–183.
Blair, P.D., and Wyckoff, A.W. (1989) The Changing Structure of the U.S. Economy: An Input–Output Analysis. InFrontiers of Input–Output Analysis(R.E. Miller, K.R. Polenske, and A.Z. Rose, Eds.). New York: Oxford University Press, pp. 293–307. Carter, A.P. (1970)Structural Change in the American Economy.Cambridge: Harvard
University Press.
Davies, S. (1979)The Diffusion of Process Innovations.Cambridge: Cambridge University Press.
Diamond, J. (1973)The Economic Impact of International Tourism in Developing Countries.
D. Phil. Thesis, University of York.
Diamond, J. (1976) Key Sectors in some Underdeveloped Countries: A Comment,Kyklos
Dietzenbacher, E. (1992) The Measurement of Interindustry Linkages: Key Sectors in The Netherlands.Economic Modelling9:419–437.
Dietzenbacher, E., and Los, B. (1997) Analyzing Decomposition Analyses. InPrices, Growth and Cycles—Essays in Honour of Andra´s Bro´dy(A.A. Simonovits and A.E. Steenge, Eds.). London: Macmillan, pp. 108–131.
Feldman, S.J., McClain, D., and Palmer, K. (1987) Sources of Structural Change in the United States, 1963–1978: An Input–Output Perspective.Review of Economics and Statistics69:503–510.
Fujita, N., and James, W.E. (1991) Growth Patterns of the Japanese Economy in the 1980s: Before and After the Depreciation of the Yen.Economic Systems Research
3:399–412.
Henderson, H.V., and Searle, S.R. (1981) On Deriving the Inverse of a Sum of Matrices.
SIAM Review23:53–60.
Hewings, G.J.D., Fonseca, M., Guilhoto, J., and Sonis, M. (1989) Key Sectors and Structural Change in the Brazilian Economy: A Comparison of Alternative Approaches and their Policy Implications.Journal of Policy Modeling11:67–90.
Kanemitsu, H., and Ohnishi, H. (1989) An Input–Output Analysis of Technological Changes in the Japanese Economy: 1970–1980. InFrontiers of Input–Output Analysis
(R.E. Miller, K.R. Polenske, and A.Z. Rose, Eds.). New York: Oxford University Press, pp. 308–323.
Lin, X., and Polenske, K.R. (1995) Input–Output Anatomy of China’s Energy–Demand Change.Economic Systems Research7:67–84.
Miller, R.E., and Blair, P.D. (1985)Input–Output Analysis: Foundations and Extensions.
Englewood Cliffs, NJ: Prentice-Hall.
Miller, R.E., and Shao, G. (1994) Structural Change in the US Multiregional Economy.
Structural Change and Economic Dynamics5:41–72.
Oosterhaven, J. (1981)Interregional Input–Output Analysis and Dutch Regional Policy Problems.Aldershot: Gower.
Pyatt, G., and Round, J.I. (1979) Accounting and Fixed-Price Multipliers in a Social Accounting Matrix Framework.Economic Journal89:850–873.
Rasmussen, P.N. (1956)Studies in Intersectoral Relations.Amsterdam: North-Holland. Rose, A. (1984) Technological Change and Input–Output Analysis: An Appraisal.
Socio-Economic Planning Sciences18:305–318.
Rose, A., and Casler, S. (1996) Input–Output Structural Decomposition Analysis: A Critical Appraisal.Economic Systems Researchvolume 8:33–62.
Round, J.I. (1985) Decomposing Multipiers for Economic Systems involving Regional and World Trade.Economic Journal95:383–399.
Schumann, J. (1994) Does it Make Sense to Apply the Static Open Input–Output Model for Imputation and Structural Decomposition?Economic Systems Research6:171–178. Skolka, J. (1989) Input–Output Structural Decomposition Analysis for Austria.Journal
of Policy Modeling11:45–66.
Sonis, M., and Hewings, G.J.D. (1989) Error and Sensitivity Input–Output Analysis: A New Approach. InFrontiers of Input–Output Analysis(R.E. Miller, K.R. Polenske, and A.Z. Rose, Eds.). New York: Oxford University Press, pp. 232–244. Sonis, M., and Hewings, G.J.D. (1992) Coefficient Change in Input–Output Models: Theory
and Applications.Economic Systems Research4:143–157.
Takayama, A. (1985)Mathematical Economics, 2nd ed. Cambridge: Cambridge University Press.
van der Linden, J.A., Oosterhaven, J., Cuello, F.A., Hewings, G.J.D., and Sonis, M. (1993)
Fields of Influence of Technological Change in EC Intercountry Input–Output Tables, 1970–80. Paper presented at the 10th International Conference on Input–Output Techniques, Seville.
van der Linden, J.A., and Dietzenbacher, E. (1995)The Determinants of Structural Change: A New Application of the RAS Method.Paper presented at the 11th International Conference on Input–Output Techniques, New Delhi.
Wolff, E.N. (1985) Industrial Composition, Interindustry Effects, and the U.S. Productivity Slowdown.Review of Economics and Statistics67:268–277.