The 3 International Conference on Radar, Antenna, Microwave, Electronics and Telecommunications (ICRAMET) 2014
Batam Indonesia | 7 8 May 2014
ICRAMET
i
Proceedings of the 3
rdInternational Conference on Radar, Antenna,
Microwave, Electronics and Telecommunications (ICRAMET) 2014
“Developing Regional and International Scientific Co
-
operations”
Editor
Mashury Wahab
Yadi Radiansah
Syamsu Ismail
Yuyu Wahyu
Purwoko Adhi
Goib Wiranto
Technical Editor
Ken Paramayudha
Arie Setiawan
M. Tajul Miftahushudur
Prasetyo Putranto
Fadil Habibi Danufane
Layout and Cover
Dicky Desmunandar
ISSN : 1979-2921
Published by:
Research Center for Electronics and Telecommunication
Indonesian Institute of Sciences
Kampus LIPI Jl. Sangkuriang Bandung 40135
Phone : +62 22 2504660
Fax : +62 22 2504659
The 3 International Conference on Radar, Antenna, Microwave, Electronics and Telecommunications (ICRAMET) 2014
Batam Indonesia | 7 8 May 2014
ICRAMET
ii
COMMITTEE
Advisory Chair
Prof. Dr. Lukman Hakim, LIPI Chairman
Steering Committee
Syahrul Aiman, LIPI
Hiskia, LIPI
Mashury Wahab, LIPI
Yuyu Wahyu, LIPI
Goib Wiranto, LIPI
Purwoko Adhi, LIPI
Syamsu Ismail, LIPI
Rr. Widhya Yusi S, LIPI
Hammam Riza, BPPT
Arwin D.W. Sumari, MABES AU
Edy Siradj, Balitbang Kemhan
A. Andaya Lestari, IRCTR-I
Endon Bharata, IRCTR-I
Josaphat Tetuko S.S., Chiba Univ.
Raja Syamsul Azmir A., UPM Malaysia
Eko Tjipto Raharjo, UI
Fitri Yuli, UI
Andriyan B. Suksmono, ITB
Nana Rachmana, ITB
Adit Kurniawan, ITB
Sholeh Hadi P, UNIBRAW
Technical Program Committee
Chairman
Yadi Radiansah
Vice Chairman
Zaenul Arifin
Secretariat
Lisdiani
Poppy Sumarni
Finance Division
Wawat Karwati
Program Division
Emil Kristanti
Ratna Dwi Novitasari
Publication Division
Ken Paramayudha
Dicky Desmunandar
Prasetyo Putranto
Arie Setiawan
Fadil Habibi Danufane
M. Tajul Miftahushudur
Documentation & Exhibition Division
Endang Ridwan
Nani Haryati
Patricius Sriyono
Equipment & Transportation Division
Anna Kristina T
Sarip Hidayat Umaran
Sugiantoro
The 3 International Conference on Radar, Antenna, Microwave, Electronics and Telecommunications (ICRAMET) 2014
Batam Indonesia | 7 8 May 2014
ICRAMET
iii
PREFACE
On behalf of the Chairman Organizing Committee of The 3
rdInternational Conference on Radar, Antenna,
Microwave, Electronics and Telecommunications (ICRAMET) 2014, I would like to thank to all the participants for
their participation during the Conference that was held in Batam on May 7 - 8, 2014. We also would like to thank for
their contributions to the Conference program and for their contributions to these Proceedings.
I would like to specifically express my gratitude to the Chairman of Indonesian Institute of Sciences (LIPI) Prof Dr.
Lukman Hakim, who was officially opened the Conference. To the distinguished speakers : Dr. Teguh Rahardjo,
advisor to the Minister of Research and Technology for Defense and Security Affairs; Dr. Timbul Siahaan, directorate
general of defense potential, Ministry of Defense Republic of Indonesia; and Mr. Ali Nasheer Ahmadi from Iran
Electronics Industries.
This proceeding consists of 40 scientific papers. Some of these papers were presented as oral presentations, and the
rests were presented as poster presentations. This Conference would not be hold successfully without contribution of
the Speakers, the Authors, the Advisory Committees, and the members of the Organizing Committees. Therefore, I
would like to take this opportunity to express my sincere appreciation to all of them for their active participation in
The 3
rdInternational Conference on Radar, Antenna, Microwave, Electronics and Telecommunications (ICRAMET)
2014.
Bandung, June 5
th2014
Chairman of the Organizing Committee
The 3 International Conference on Radar, Antenna, Microwave, Electronics and Telecommunications (ICRAMET) 2014
Batam Indonesia | 7 8 May 2014
ICRAMET
iv
LIST OF PAPERS
1. Adjacent Interference Analysis in GSM Network at Purbalingga Area (Alfin Hikmaturokhman,
Eka Wahyudi and
Khoirun Ni’amah
) ...
1
2. Design and Fabrication of UWB Bandpass Filter for S-Band Application using Microstrip Stub
Loaded Resonator Added Notch Structure (Arief Budi Santiko and Fajri Darwis) ...
7
3. Wireless Weather Instrument for Multi-altitude Monitoring of Skydiving Landing Area (Asif
Awaludin, Rachmat Sunarya, Edy Maryadi, Halimurrahman, Ginaldi Ari Nugroho and Laras
Tursilowati)...
11
4. Design on Multi-Coupled Ring-Resonators of Interleave Filter with Large Free-Spectral Range by
Applying The Vernier Effects (D. Mahmudin, Y. Taryana and N. Armi) ...
15
5. Simulation of Stacked Patch Antenna by Moment of Method (Dian Tresnawan)...
18
6. Total Electron Content Data Correction Using Interpolation And Shifting (Dwiko Unggul
Prabowo, Timbul Manik and Peberlin Sitompul) ...
21
7. Design Hairpin Bandpass Filter at 400 MHz for DDS Clock on Radar System (Fajri Darwis and
Taufiqqurrachman)...
24
8. Picocell Antenna in 3-Band Global System for Mobile Communication (Folin Oktafiani and Yussi
Perdana Saputera)...
28
9. The Comparison of a Pulse Electromagnetic Field Effect on CaCl
2and FeSO
4Solutions (Hanif
Fakhrurroja, Hariyadi and Novan Agung Mahardiono)...
33
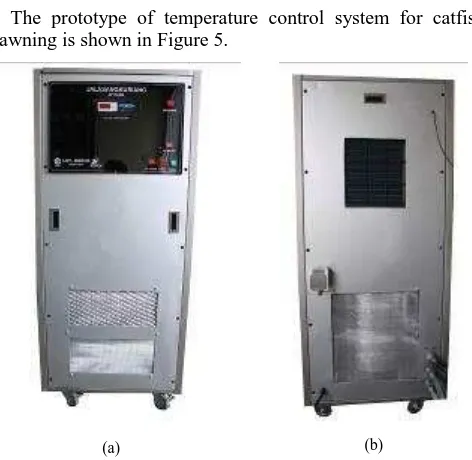
10. Design and Development of A Temperature Control System for Catfish Spawning (Hanif
Fakhrurroja and Hariyadi)...
38
11. Dye-sensitized Solar Sub-Modules (Lia Muliani, Jojo Hidayat and Lilis Retnaningsih) ...
42
12. Proposing Two SLC Structures Based on NLMS and RLS for Improving ECCM Capability of
Array Radar (M.H Ghamat, B.Abbasi and Sh. Salemian) ...
46
13. Designing High PRF Pulsed-Doppler Radar Using Robust Chines Remainder Theorem (Mohsen
Askari, Shamsollah Salemian, and Bijan Abbasi Arand) ...
51
14. Performance of Spectrum Sensing Technique in Cognitive Radio System (Nasrullah Armi, Arief
Suryadi and Purwoko Adhi)...
58
15. Image Processing Using Mathematical Morphology to Enhance Result of Surveillance Radar
Imaging (Vicky Zilvan and Octa Heriana) ...
63
16. Tri-Band Ring Square Slot Using Parasitic Element (Indra Surjati, Yuli Kurnia Ningsih and
The 3 International Conference on Radar, Antenna, Microwave, Electronics and Telecommunications (ICRAMET) 2014
Batam Indonesia | 7 8 May 2014
ICRAMET
v
17. Application of SMT Filter on The FMCW Technology Radar System for Maritime Purpose (Sri
Hardiati and Topik Teguh Estu) ...
72
18. Using of the Okumura-Hata Propagation Model for Pathloss Determination in Tarakan (Syahfrizal
Tachfulloh)...
77
19. Design
and
Implementation
Resonator
Spurline
L-Type
at
Frequency
2.4GHz
(Taufiqqurrachman, Fajri Darwis, I Dewa Putu Hernida and Deni Permana)...
80
20. Design and Simulation of Bandpass Filter Microstrip Using Hairpin Method with Seven
Resonators (Teguh Praludi, Iqbal Syamsu and Bagus Edy Sukoco) ...
85
21. Development of Space Weather Observation System in Radio-Frequency-Based Using Callisto
(Timbul Manik, Peberlin Sitompul and Dwiko Unggul Prabowo) ...
89
22. Characterization of Barrium Ferrite Permanent Magnet for Circulator Components Working at S
Band ( 2.45 GHz
–
4.00 GHz) (Tony Kristiantoro, Nanang Sudrajat, Novrita Idayanti and Asep
Yudi Hercuadi)...
94
23. Application of The Hairpin Microstrip Band Pass Filters 456 MHz for FMCW Radar Systems
(Topik Teguh Estu, Sulistyaningsih and Sri Hardiati)...
98
24. Frequency Selection Analysis of Long Term Evolution (LTE) Technology in Indonesia (Uke
Kurniawan Usman and Galuh Prihatmoko) ...
103
25. UMTS/HSPA Network KPI Value Optimization Analysis in UMTS State Transformation Feature
Activation (Defika Fianti, Uke Kurniawan Usman and Yuyun Siti Rohmah) ...
107
26. Image Processing using Median Filter to Minimize Noise of Surveillance Radar Imaging (Octa
Heriana and Vicky Zilvan)...
113
27. Digital Modulation Simulation Through AWGN Channel and Rayleigh Fading Channel Using
Phase Shift Keying Modulation (Anggun Fitrian Isnawati, Wahyu Pamungkas and Abny Irawan) ...
116
28. Intercomparison of Ceilometer and Mie lidar Retrievals for Aerosol and Cloud Height
Over Kototabang, Indonesia (Wendi Harjupa and Syafrijon) ...
121
29. Two Stage Low Noise Amplifier 3 GHz using Non Simultaneous Conjugate Match Technique
(Yana Taryana, Achmad Munir, Yaya Sulaeman and Suhana Hermana) ...
125
30. High Gain Low Noise Amplifier 9.4 GHz for Radar Application using Microstip Line Matching
Network (Yana Taryana, Yaya Sulaeman, Nasrullah Armi and Mashury Wahab) ...
132
31. Bandwidth Enhancement of Rectangular Microstrip Patch Antenna Using Electromanetically
Coupled Technique for Wimax Applications (Yudi Yuliyus Maulana, Yuyu Wahyu, Folin
Oktafiani and Fadil Habibi Danufane) ...
136
32. Design and Simulation 4 x 1 Wilkinson Combiner / Power Divider for Application of LPI Radar
X-Band Frequency with Impact of Casing (Yussi Perdana Saputera, Arif Budi Santiko,
The 3 International Conference on Radar, Antenna, Microwave, Electronics and Telecommunications (ICRAMET) 2014
Batam Indonesia | 7 8 May 2014
ICRAMET
vi
33. Surface Acoustic Wave (SAW) Device Application as Mercury Sensor (Grace Mambu, Goib
Wiranto)...
147
34. Hybrid Polymer Solar Cell Based on Nanocrystalline Zinc Oxide and Poly (Phenylene Vinylene)
Blend (Erlyta Septa Rosa, Shobih, and Muhammad Amiruddin) ...
151
35. Microstrip Antenna Side Lobe Suppression Using Left-Handed Metamaterial Structure (Fitri Yuli
Zulkifli, Pamela Kareen, Basari and Eko Tjipto Rahardjo) ...
155
36. Optical Properties on Blending Paste of TiO2 Nanoparticles and Reflector for Dye Solar Cell
Photoelectrode (Lilis Retnaningsih , Lia Muliani and Goib Wiranto)...
160
37. Study of Fabrication of Dye-Sensitized Solar Cells with Spray Coated Carbon Nanotube (CNT)
Based Counter Electrodes (Slamet Widodo, Goib Wiranto, Lilis Retnaningsih, I Dewa Putu
Hermida and Mirza Nur Hidayat) ...
164
38. Noise Cancellation of Recorded EEG using Robust Principal Component Analysis (Arjon Turnip,
Dwi Esti Kusumandari and Hanif Fakhurroja)...
170
39. Integrated of Advanced Oxidation Processes with Reverse Osmosis for Water Treatment (Arjon
Turnip, Demi Soetraprawata, and Sutrisno Salomo Hutagalung) ...
173
40. Development of Peat Water Treatment Technology based Advanced Oxidation Processes with O
3The 3 International Conference on Radar, Antenna, Microwave, Electronics and Telecommunications (ICRAMET) 2014
Batam– Indonesia | 7 – 8 May 2014
ICRAMET
1
Adjacent Interference Analysis In GSM Network at
Purbalingga Area
Alfin Hikmaturokhman1, Eka Wahyudi2, Khoirun Ni’amah3
Program Studi D3Teknik Telekomunikasi, Purwokerto Sekolah Tinggi Teknologi Telematika Telkom Purwokerto JL.D.I Panjaitan No.128 Purwokerto, Telp (0281) 641629
1
[email protected], [email protected] [email protected]
Abstract—Evaluation of network performance is very important because it changes and developments continue to occur in the world of telecommunications, especially in mobile telecommunications. To continue improving the best performance of a system it is necessary to evaluate in the system through the performance evaluation of cellular networks based on the problem in the network one of which is signal disturb such as interference. Research by the author is to overcame the interference that occur in Purbalingga area base on network performance with the optimization (retune frequency) on Site has interference. Results of research conducted that condition Site Padamara and Selabaya has adjacent interference, so that to solve that with retune frequency on Padamara Site. Condition
RxLevel ≥ 95 dBm before retune BCCH is 96,81% and after retune BCCH is increase became 99,28%, condition RxQual ≤ 5
before retune BCCH is 46,30% and after retune BCCH is
increase became 67,04%, and condition SQI ≥18 before retune
BCCH is 69,49% and after retune BCCH is increase became 73,95%, condition C/I before retune BCCH has percentage 43,31% and after retune BCCH is increase became 54,47%. Also that performance SDSR before retune BCCH is 95,77% and after retune BCCH is increase became 97,078%, performance HOSR before retune BCCH 94,29% and after retune BCCH is increase became 97,078% and performance TDR before retune BCCH is 1,68% and after retune BCCH is increase became 1,43%.
Keywords: performance, optimization, adjacent channel interference, BCCH,retune frequency
I. INTRODUCTION
A. Background
The sound quality is very important thing required by each customer. A poor signal quality can be caused by several things, such as a weak power levels, high interference and others. Differences in the level and quality of the signal strength, the number of subscribers in a cell and geographical conditions may affect the performance of GSM network.
Optimization is one of the best method to analyze the performance and general quality of customer communication network to be maintained..
B. Problem Formulation
Based on the background, the authors formulate the problem :
1) Factors that result the interference and appropriate solution to reduce interference?
2) How does the quality and performance of site before
and after the turn of the BCCH (frequency retune)
C. The purpose and the benefits
The purpose and the benefits to be achieved in this study are:
1) Knowing the factors that result in interference and knowing how solutions to reduce interference
2) Knowing how to quality and performance of site
The methodology of the research are :
1) Research Methods
The research method used was to observe the interference.
2) Data collection method
The data collection method used two methods:
Literature
Field Data Collection
3) Research instrument
The 3 International Conference on Radar, Antenna, Microwave, Electronics and Telecommunications (ICRAMET) 2014
Batam– Indonesia | 7 – 8 May 2014
ICRAMET
2
5) Analysis Methods
The data from drive test using TEMS Investigation 10.0.5 software to find an area that is susceptible to interference, and how the right solution to handle the problem on interference
II. BASICTHEORY
A. GSM Cellular Communication Systems
1) Concept and Development of GSM
Global System for Mobile Communication
(GSM) is a second-generation mobile
telecommunications technology that has been using a digital system. Advantages of the use of digital-based technology are able to have a
greater capacity than analog-based
telecommunications technology.[1]
2) GSM Network Interface
Interface is a subsystem of a liaison with another subsystem on the GSM network. The GSM network image interface can be seen in Figure 1.
Figure 1 GSM Network Interface [2]
3) GSM Frequency Allocation
GSM use frequency band of 900 MHz for operation , the frequency are 890-915 MHz uplink and 935-960 MHz downlink . GSM have 25 MHz bandwidth (915-890 = 960-935 = 25 MHz), and GSM channel width is 200 kHz, it have 125 channels, 124 channels are used for voice and one channel for signaling. [3]
B. Interference In GSM Networks
Interference caused by the presence of another signal whose frequency is the same and the other signal power is big enough. The measures used to assess the quality of the signal to interference expressed by C/I (dB).
In TEMS application, interference can be check by observing the radio parameters. The possibility of interference are when RxQual, C / I or SQI testing performed on the TRX bad but Rx Level in good condition, [4]
Figure 2. Interference Checking [5] The causes of interference are::
1) Frequency planning
2) There is no dominant cell that causes the C / I is low
3) The lack of frequency hopping.
4) The influence from the outside.
Various kinds of interference in mobile
communication system are::
A. The co-channel interference
An inter-cell interference using the same frequency
Figure 3 Co-Channel Interference [5]
B. The Adjacent Channel Interference
Interference caused by signals that frequency adjacent (side by side) with the frequency of the signal that is becoming the focus of attention as the next channel interference.
Figure 4, The Adjacent Channel Interference [5]
C. Drive Test and Optimization
1) Principle of Drive Test [6]
Drive Test is the process of measuring the mobile communication system in which the radio waves from the BTS to the MS or vice versa by using a mobile phone designed specifically for the measurement.
2) Drive Test Parameters [7]
a) Broadcast Control Channel (BCCH).
b) Absolute Radio Frequency Channel
c) Cell Global Identity (CGI)
d) Base Station Identity Code (BSIC).
The 3 International Conference on Radar, Antenna, Microwave, Electronics and Telecommunications (ICRAMET) 2014
Batam– Indonesia | 7 – 8 May 2014 interference and site performance are :[8-10]
1) RxLevel
RxLevel is received signal strong at the receiver side ( mobile station )
3) Speech Quality Index (SQI)
SQI is the sound quality received by the Mobile Station ( MS ).
(3) 4) Carrier to Interference (C/I)
C/I is the ratio between the signal strong information bits and signal strong interference bits (4)
5) SDCCH Success Rate (SDSR)
SDCCH Success Rate ( SDSR ) is the TCH_DR failure channel occupation . Equation ( 6 )
7) Handover Success Rate (HOSR)
Handover Success Rate ( HOSR ) is the percentage of success of the Mobile Station to move services from one cell to its neighboring cell . Equation ( 7 )
III. DATAANALYSISANDDISCUSSION
A. Data Collection Before Optimization
The area around Padamara and Selabaya site based on the results of test drives have a strong level of poor signal with -86 dBm (RxLevel Value) and very poor signal quality with 7 (RxQual value).
1) Interference checking
Figure 5 Interference Checking In TEMS
Based on figure 5 it can be concluded RxLevel: -86 dBm (category quite well), RxQual: 7, SQI: 3 and C / I: 8.20 dB (poor category), so the conclusion Padamara area and the Selabaya site got interference. The results of the drive test site Selabaya sectors 1 with BCCH 59 is a site have interference. Interference caused not only by one site also be caused by two or more sites.
2) RxLevel Observations Before Optimization
TABLE 1 RXLEVELOBSERVATIONSRESULTSBEFORE
OPTIMIZATION
Value Sample Precentage
-75 to 0 5.866 16.35% drive was -84.894 dBm ( good category)
3) RxQual Observations Before Optimization
TABLE3RXQUALOBSERVATIONSRESULTSBEFORE OPTIMIZATION
Value Sample Precentage
0 to 5 4.562 46.30%
5 to 6 1.621 16.45%
6 to 8 3.670 37.25%
Total Sample 9.853 100%
KPIs with RxQual Value 5 is 46.30%. These results are below the targets and signal quality in the area surrounding the Padamara siteconsidered very bad. This problem is due to interference between two sectors, between the Padamara site and the Selabaya site so we need some network repair.
TABLE 4 RXQUALVALUEOBSERVATIONSRESULTS
BEFOREOPTIMIZATION
The average RxQual value is 2.451 very bad signal quality category
4) SQI Observations Before Optimization
TABLE 5 SQIOBSERVATIONSRESULTSBEFORE
The 3 International Conference on Radar, Antenna, Microwave, Electronics and Telecommunications (ICRAMET) 2014
Batam– Indonesia | 7 – 8 May 2014
ICRAMET
4
Value Sample Precentage
18 to 30 23.365 69.49%
TABLE 6 C/IOBSERVATIONSRESULTSBEFORE
OPTIMIZATION
Value Sample Precentage
12 to 55 15.654 43.31% -5 to 12 11.277 31.20% All Others 9.213 25.49% Total Sample 36.144 100%
Padamara Site have C / I Value below 12 dB, that is indicating interference in the area.
TABLE 7 C/IOBSERVATIONRESULTSVALUE BEFORE
OPTIMIZATION
Value rata-rata C/I yang didapat adalah 21,822 dB, Value maksimum adalah 35 dB dan Value minimum yang didapat adalah 6,3 dB.
B. Data Collection After Optimization
In the window GSM Serving+ Neighbor BCCH sector 1 at Padamara site was already replaced, the first 58 (946.6 MHz) become 53 by using this frequency Fd = 935.2 + 0.2 * (53-1) = 945.6 Mhz.
So the site Selabaya sector 1 and sector 1 Padamara site already has a difference of 6 or difference BCCH 1.2 MHz (6 × 200 kHz = 1200 kHz = 1.2 MHz)
Figure 6 Padamara siteBCCH Substitution
1) RxLevel Observations After Optimization
TABLE8RXLEVELOBSERVATIONSRESULTSAFTER
OPTIMIZATION
Value Sample Precentage
-75 to 0 6.866 22.09%
-97 to -75 24.067 77,19%
-120 to -95 224 0,72%
Total Sample 35.871 100%
The RxLevel value (95 dBm) precentage is 22.09% +77.19% = 99.28%. The signal level around the Padamara site area is increased and the categorized is good.
TABLE 9 RXLEVELVALUEOBSERVATIONSRESULTS
BEFORE OPTIMIZATION
Average value is -78,674 dBm.
2) RxQual Observations After Optimization
TABLE 10 RXQUALOBSERVATIONSRESULTSAFTER
OPTIMIZATION
Value Sample Precentage
0 to 5 4.686 67,04%
5 to 6 2.001 28,63
6 to 8 302 4,32
Total Sample 6.989 100%
RxQual value (5) is 67.04%, when compared to the old value was 46.30%, then the quality of the signal after the turn of the BCCH much better..
TABLE 11 RXQUALOBSERVATIONSVALUEAFTER
OPTIMIZATION signal quality at good category.
3) SQI Observations After Optimization
TABLE 12 SQIOBSERVATIONSRESULTSAFTEROPTIMIZATION
Value Sample Precentage
18 to 30 24.169 73.95%
5 to 18 2.651 8,11%
-20 to 5 5.863 17,94%
Total Sample 32.683 100%
The sound quality of the signal after the turn of the
BCCH is much better than before (SQI value ≥ 18 is
change from 69.49% to 73.95%).
4) C/I Observation After Optimization
TABLE 13 C/I OBSERVATIONSRESULTSAFTEROPTIMIZATION
Value Sample Precentage
12 to 55 8.124 54,47%
-5 to 12 4.523 30,32%
All Others 2.268 15,21% Total Sample 36.144 100%
The results of MapInfo plotting for C/I Value Percentage is > 12 after the previous optimization, that is increased from 43.31% to 54.47%.
TABLE 14 C/IOBSERVATIONSVALUEAFTERTHEOPTIMIZATION
The 3 International Conference on Radar, Antenna, Microwave, Electronics and Telecommunications (ICRAMET) 2014
Batam– Indonesia | 7 – 8 May 2014
ICRAMET
5
Average C/I value obtained during the data collection process are 25.564 dB, the maximum Value 30.8 dB and The Minimum Value 11.4 dB. Its mean the category is good .
C. Padamara Site Performance Data Analysis
1) SDCCH Success Rate (SDSR) Analysis
Figure 7 SDSR Graph Padamara Site
Research carried out 7 days before and after the turn of the BCCH. BCCH replaced on August 19 2013. SDSR Values ranged 95.77% on the date August 12 2013 until August 18 2013 which means that the Value is included in the normal category KPI standards. SDSR increased to the range of 97.078% on the date of August 20 2013 until August 27 2013, which means the category standard KPI Value. Increased capacity occurred after the turn of the BCCH on August 19, 2013.
2) Analysis of Handover Success Rate (HOSR) and TCH
Drop Rate (TDR)
Figure 8 Grafik HOSR dan TDR
HOSR ranges from 94.29% at the date of August 12 2013 until August 18 2013 which means that the Value is the normal category. HOSR value increased to the range of 95% on the date of August 20 2013 until August 27 2013, which means a good category.
TDR ranges from 1.68% at the date of August 12 2013 until August 18 2013 Value means the category is still normal. TDR increased to the range of 1.43% on August 20 2013 until August 27 2013, which means a good category.
D. The Observed parameter comparison Before and After BCCH Substitution
TABLE 15 PERFORMANCECOMPARISONBEFOREANDAFTER
BCCHTURNPERFORMANSI
No Performa nce paramete rs
KPI percentage Average Enhacmen t
Selabaya site is adjacent channel interference because the sector one Padamara site and sector one Selabaya site differing only one BCCH ARFCN. That is Padamara site sector 1 has BCCH 58 ( 946.6 MHz ) and site Selabaya sector 1 has BCCH 59 ( 946.8 MHz ).
2) Interference that occurs resolved by retune frequency
( BCCH turnover ) on Padamara site that originally had BCCH 58 ( 946.6 MHz ) is changed to BCCH53 ( 945.6 MHz ) . So after the turn of the BCCH site Selabaya own Padamara and BCCH difference of 6 ( with 6 × 200 KHz bandwidth = 1200 kHz = 1.2 MHz ).
3) The entire network performance parameters after the turn of the BCCH (BCCH retune) has increased so that network performance in areas Padamara-Selabaya much better.
B. Suggestion
For the improvement and development of research, are suggestion :
1) The next development, the observations made are not
only adjacent channel interference but also can be added to the co-channel interference observations.
2) Using planning software provider to be able to see a
The 3 International Conference on Radar, Antenna, Microwave, Electronics and Telecommunications (ICRAMET) 2014
Batam– Indonesia | 7 – 8 May 2014
ICRAMET
6
REFERENCES
[1] Wardhana, Lingga dan Nuraksa Makodian, Teknologi Wireless Communication dan Wireless Broadband, Edisi 1, Yogyakarta, Daerah Istimewa Yogyakarta Indonesia, Andi,2010.
[2] Puspita, Riana Dewi, Analisis Optimalisasi Kapasitas Trafik Dengan Multiband Cell (MBC) Pada Jaringan GSM di PT.XL Axiata Puwokerto. Purwokerto:Akademi Teknik Telkom Sandy Putra Purwokerto, Tugas Akhir, 2011.
[3] Ulva, Andi T Wello, Analisis Performansi Pada Jaringan GSM 900/1800 di Area Purwokerto Studi Kasus di PT EXCELCOMINDO PRATAMA.Purwokerto, Program Studi D3 Teknik Telkom, Purwokerto, Tugas Akhir, 2009.
[4] Hikmaturokhman, Alfin, Konsep Interferensi Selular, Program Studi D3 Teknik Telkom, Purwokerto, Diktat Kuliah Teknik Selular, 2013. [5] Wardana, Lingga, 2G/3G RF Planning and Optimization for Consultant,
Edisi 1, Jakata, DKI Jakarta, Indonesia,2013.
[6] Grasindo, Sunomo, Pengantar Sistem Komunikasi Nirkabel, Jakarta, DKI Jakarta, Indonesia, PT Gramedia Widiasarana,2004.
[7] Mauliya, Fatimah Ahmad dan Muh. Danudhirka, Optimasi Base Transceiver Station (BTS) Pada Jaringan Berbasis Global System For Mobile Communication (GSM) Dengan Metode Drive Test di Area
Operator Hutchison Charoen Pokphand Telecom (HCPT) Makassar”.
Makassar : Fakultas Teknik Universitas Muslim Indonesia Makassar, Tugas Akhir, 2011.
[8] Tarigan, Novyanti, (2013, Desember), Analisis Gangguan Spektrum Frekuensi pada Jaringan GSM PT. Indosat, Tbk, Program Pendidikan Sarjana Ekstensi Fakultas Teknik Sumatera Utara, Medan, Tugas Akhir,
2011. Dokumen PDF. [Online].
http://repository.usu.ac.id/bitstream/123456789/30704/6/Cover.pdf [9] Ardhita, Reza, (2013, Desember), Laporan Studi Kasus Kinerja Layanan
Data Paket GPRS PT Nexwave Regional Jawa-Yogyakarta Divisi HCPT (Three) Semarang, Jurusan Teknik Elektro Fakultas Teknik Universitas Diponegoro, Semarang, Tugas Akhir. Dokumen PDF. [Online]. http://eprints.undip.ac.id/32028/1/Reza_Ardhita.pdf
The 3 International Conference on Radar, Antenna, Microwave, Electronics and Telecommunications (ICRAMET) 2014
Batam– Indonesia | 7 – 8 May 2014
ICRAMET
7
Design and Fabrication of UWB Bandpass Filter
S-Band Application Using Microstrip Stub Loaded
Resonator Added Notch Structure
Arief Budi Santiko1 and Fajri Darwis21,2Research Center for Electronics and Telecommunication – Lembaga Ilmu Pengetahuan Indonesia (LIPI)
Kampus LIPI Jl. Sangkuriang Building 20 4th floor Bandung, 40135 – Indonesia Phone. +62-22-2504661, Fax. +62-22-2504659
Email : ariefbudi[dot][20[at]gmail.co.id
Abstract— This paper present the Ultra-Wideband (UWB) bandpass filter for S-band application. A bandpass filter was designed using microstrip stub-loaded resonator added notch structure. The bandwitdh for this filter controlled by changing the width between stub loaded resonator. The notch structure was added for sharp rejection typical in the upper pass band. The design was simulated using ADS 2011.10 and fabricated using RT/duroid 5880. For the measurement results, a bandpass filter have operation band from 2 to 4 GHz, minimum insertion loss of 0.6 dB at center frequency 3 GHz, good VSWR and 50 ohm impedance in both of ports. The Simulation and measurement results are found in good agreement.
Keywords- bpf; S-band; microstrip; notch structure
I. INTRODUCTION
This letter is focused on the development of microstrip bandpass filter (BPF) for operating in S-band application. The development of this filter is focused on the operating bandwidth, because this filter is used to select the applications which operating in S-band. The narrow, wideband or ultra wideband of bandwidth filter are chosen according to their applications. This paper, explains how to design the filter which has ultra wideband bandwidth.
Various techniques have been developed to design microstrip bandpass filter especially using microstrip stub loaded resonator by [1], [2], and [3]. The demands of filter which has sharp rejection band are bring us to looking for new method to achieve it. One of the solutions is introducing notch structured. Many design have been proposed related this technique [4]-[9]. Ultra-wideband (UWB) microstrip bandpass filter using ring resonator employing notch structure has been proposed by [4]. In [5] a UWB filter is developed using dual notch filter at S and C Band. In [6] a compact UWB BPF with embedded band notch structures has been presented for center frequency 5.8 GHz using short-circuited stubs.
In this research, we designed and fabricated the ultra-wideband (UWB) bandpass filter for S-band application. The filter was designed using microstip stub-loaded
dual-mode resonator doublets with the various length of separated position between the resonant. The various position of length of separated position between the resonant is to optimize and get the desire bandwidth and added the notch structure. The notch structure is used to obtain sharp rejection on upper passband (fp2). The center frequency of bandpass filter is 3 GHz and the passband is from 2 GHz (fp1) until 4 GHz (fp2). The bandpass
filter has fractional bandwidth 66.67%. When if the fractional bandwidth greater than 25%, the bandpass filter is categorized as ultra-wideband [9]. For the simulation and optimization of bandpass filter, we used ADS 2011.10 software.
II. FILTER DESIGN AND SIMULATION
Figure 1 shows the structure of stub loaded resonator. As in [10] the length of L is about λ/2. The stub positions at center of L with dimensions of stub are width is denoted by w, and length by h.
Figure 1. A microstrip stub loaded resonator.
As was discussed in [1] and [10] the resonant frequencies of the odd- modes are given by
√
(1)
And the resonant frequencies of the even-modes are given by
√
(2)
Where n = 1, 2, 3, ..., c is the speed of light in the free space and
The 3 International Conference on Radar, Antenna, Microwave, Electronics and Telecommunications (ICRAMET) 2014
Batam– Indonesia | 7 – 8 May 2014
ICRAMET
8
The proposed design of bandpass filter for S-band application is shown in Figure 2. As in [1] and [10], the structure of the design consists of two parallel microstrip stub-loaded dual-mode resonator doublet but oppositely placed stub-loaded resonators.
Figure 2. The proposed design of bandpass filter.
By using ADS 2011.10, we obtain the simulation results of s-parameter are close to design. The values of parameters in the bandpass filter which were designed are L = 42.4 mm, L1 = 20.3 mm, L3= 2 mm, W1 = 0.4 mm, W2 = 1.6 mm, S1 =
0.65 mm, S2 = 0.65 mm and for notch structure L2 = 11 mm,
W3 = 0.2 mm. For this design we must consider the width or
length of the microstrip line is ease to fabricate.
The results of simulation which have been done using ADS 2011.10 are shown below.
Figure 3. S-Parameter result of bandpass filter from ADS 2011.
Figure 3 shows the device response formed on simulation using s = 0.65 because using those separated length is have high percentage value than length other.
With change the separate between resonant microstrip lines, we can get the desired bandwidth as shown in figure 4. By using the software simulation, we optimize and plan the bandwidth with change values of separated (s) between the resonant.
Figure 4. The space factor of the bandpass filter.
Figure 5 shows the device response S21 by changing the
distance between resonant. Increasing wide range separated(s) is made the operational bandwidth is narrow. Otherwise the smaller distance range of separated can make operational bandwidth wider.
S = 0.65 mm
S = 0.8 mm
S = 1.00 mm
S = 1.20 mm
Figure 5. The response of bandpass when the width space of (S) are 0.65 mm, 0.8 mm, 1.0 mm, 1.2 mm.
The influence of the separated (s) values is depicted in Figure 5, when the s is 0.65 mm and 0.8 mm, the bandwidth response has approximately similar performance. When s = 1.0 mm and s = 1.2 mm the response narrow approach, so for this design we choose the value of s = 0.65 because the desired bandwidth for wideband is good.
III. FABRICATION AND MEASUREMENT
The 3 International Conference on Radar, Antenna, Microwave, Electronics and Telecommunications (ICRAMET) 2014
Batam– Indonesia | 7 – 8 May 2014
ICRAMET
9
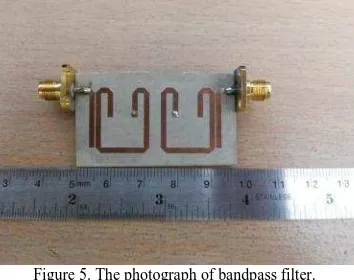
Figure 6. The photograph of the fabricated bandpass filter.
The measurement results were taken using an Advantest vector network analyzer. For the measurement, a microstrip feed line of 80 mm was added at both input and output sma connector. The insertion loss at the center frequency 3 GHz is -0.6 dB, response device is almost flat. In the operating frequency of 2 GHz and 4 GHz, at the lower passband frequency (fp1) is 2.082 GHz and at the upper passband frequency (fp2) is 4.164 GHz. It shows the operational frequency is shifted.
Knowing the approximate desired bandwidth with simulation, need be added notch structure. Additional notch structure is depicted in Figure 7. The notch structure at the upper passband is aim to produce a sharp rejection.
Figure 7. The S21 measure characteristic of the bandpass filter.
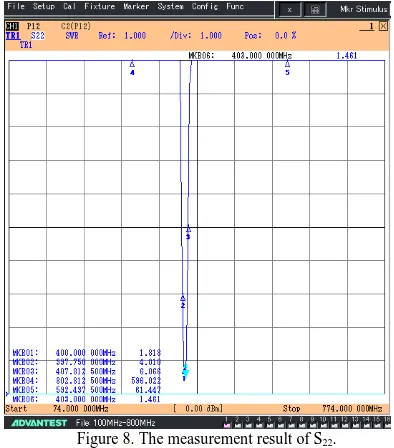
Figure 8 shows the S11 characteristic. The VSWR at the
center frequency is about 1.282 and the VSWR at 2.082 GHz is 1.267 and VSWR at 4.164 GHz is 3.465.
Figure 8. The S11 characteristic of the bandpass filter.
The phase characteristic of the bandpass filter is shown in Figure 9. At the center frequency 3 GHz, the phase is-11.48 deg. We can tune the phase by changing the length of transmission line if we want the phase have another value.
Figure 9. The phase characteristic.
From the simulation and fabrication we obtain that the characteristic of S21 are approximately similar. The desire sharp
The 3 International Conference on Radar, Antenna, Microwave, Electronics and Telecommunications (ICRAMET) 2014
Batam– Indonesia | 7 – 8 May 2014
ICRAMET
10
IV. CONCLUSION
The results of measurement and simulation show a good filter performance. On the other hand, results of fabrication will find differences with the simulation, depending on the number of mesh during the simulation run. The insertion loss in simulation almost same with fabricated filter is about 0.6db greater than -1.5 dB, VSWR its less than 1:1.5 good condition to pass the desire signal bandwidht by using this filter. Good experiment is fabricated from simulation results that we have designed. Fabrication process containing predictions of the frequency shift from simulation results. The results of the measurement filter were close to with the values in required specifications.
ACKNOWLEDGMENT
The author say thank you to all radar team PPET-LIPI and The author would like say thanks to my colleagues who discussion about the filter in this paper.
REFERENCES
[1] Zhewang Ma, Wenqing He, Chun-Ping Chen,Yoshio Kobayashi, and
Tetsuo Anada, “A Novel Compact Ultra-Wideband Bandpass Filter Using Microstrip Stub-Loaded Dual-Mode Resonator Doublets”, 978 -1-4244-1780-IEEE.
[2] Xiu Yin Zhang, Jian-Xin Chen, Quan Xue, and Si-Min Li, “Dual-Band Bandpass Filters Using Stub-Loaded Resonators”, IEEE Microwave
And Wireless Components Letters, Vol. 17, no. 8, August 2007 [3] Cheng-Yuan HUNG, Min-Hang WENG, Yan-KuinSU, Ru-Yuan
YANG, Hung-Wei WU, “Design of Compact and Sharp-Rejection Ultra Wideband Bandpass Filters Using Interdigital Stepped-Impedance Resonators”, IEICE Trans. Electron., Vol.E90–C, NO.8 August 2007.
[4] Amanulla Khan, “Compact Ultra-Wideband Bandpass and Notched
Bandpass Filter Using Dual-Line Coupling Structure”, mini Project
Report, IISc, Bangalore.
[5] Thirumalaivasan K and Nakkeeran R, “Development of UWBBandpass Filter with Two Notch Bands to Reject IEEE 802.11a/b Services”,
International Journal of Computer and Electrical Engineering, Vol. 3, No. 3, June 2011.
[6] Hussein Shaman, and Jia-Sheng Hong, “Ultra-Wideband (UWB) Bandpass Filter With Embedded Band Notch Structures”, IEEE
Microwave And Wireless Components Letters, Vol. 17, NO. 3, March 2007.
[7] Harish Kumar and MD. Upadhayay, “Design of UWB Filter with WLAN Notch”, International Journal of Antennas and Propagation, Volume
2012, Article ID 971097. Hindawi Publishing Corporation.
[8] Bowen Liu, Yingzeng Yin, Yi Yang, Yuqing Wei, Anfeng Sun, “UWB Bandpass Filter with Notched Band Using Broadside-Coupled Microstrip-Coplanar Waveguide Structure”, 978-1-4244-8559-8/11 IEEE 2011.
[9] Lembrikov. B. 2010. “Ultra Wideband”. Croatia: Sciyo.
[10] Taufiqqurrachman and Darwis F, ” Design anf Fabrication of Compact
The 3 International Conference on Radar, Antenna, Microwave, Electronics and Telecommunications (ICRAMET) 2014
Batam– Indonesia | 7 – 8 May 2014
ICRAMET
11
Wireless Weather Instrument for Multi-altitude
Monitoring of Skydiving Landing Area
Asif Awaludin, Rachmat Sunarya, Edy Maryadi, Halimurrahman, Ginaldi Ari Nugroho, Laras Tursilowati
Center for Atmospheric Science and Technology, National Institute of Aeronautics and Space (LAPAN) Jl. dr. Djundjunan 133, Bandung, Indonesia, phone +62226037445, fax +62226037443,
e-mail: [email protected]
Abstract— Army are often conducting skydiving for many purposes, such as training, deliver personnel, equipment, and supplies. Therefore it is needed an instrument to monitor weather condition in skydiving area. A wireless weather instrument for multi-altitude monitoring of skydiving landing area has been developed. This instrument was able to measure wind speed, pressure, temperature, and humidity of an area. In its operation, this instruments are installed at 50 m, 100 m, 150 m, and 200 m of altitude by using a PVC plastic inflatable balloon tethered at around 202 m height. Measurement results showed that its telemetry system has coverage around 850 m. Its wind speed, pressure, temperature and pressure data have similar pattern to MAWS201 Vaisala data.
Keywords-component; skydiving; instrument; weather; wireless
I. INTRODUCTION
Skydiving is a method usually conducted by army to deliver personnel, equipment, and supplies from a transport aircraft. As it is important part in military strategy, every soldier should possess good skydiving skills. Hence, skydiving training is carried out by the army in frequent time. One of important factors should be considered for continuous monitoring before doing skydiving is weather condition, particularly wind condition, due to the fact that weather can change very quickly. This consideration must be taken in order to be able to land in the designated landing area and also to although local circumstances may demand that more restrictive limits be adopted [5].
There are several instruments can provide wind speed data of some altitude levels continuously, such as radar and sodar wind profiler. But, these instruments require a lot of money to realize it. Therefore, it is necessary to develop low cost instrument for wind speed monitoring in several altitude levels. In addition, the instrument should also provide pressure, temperature, and humidity information. Further, mobility aspect should be considered as mobile instruments will give a lot of benefits.
In this paper will be described development of a wireless weather instrument for low altitude skydiving preparation. This instrument is able to measure wind speed, pressure, temperature, and humidity in several altitudes (50 m, 100 m, 150 m, and 200 m above ground surface) and transmit the data to receiver in ground segment. Installation of the instrument is carried out by mounting it at rope of PVC plastic inflatable balloon tethered at around 202 m height. This configuration will make the instrument become movable and easy to reinstall as it is forbidden to build a 202 m height of permanent tower.
II. DESIGNANDREALIZATION
A. Design
The instrument is designed to measure wind speed, pressure, temperature, and humidity at 50 m, 100 m, 150 m, and 200 m altitude above ground surface. Therefore, by considering atmospheric condition in its related altitude, this instrument should use sensors which able to measure wind speed from 0 to 20 ms-1, pressure from 600 to 1013 mbar, temperature from 15 to 35 °C, and humidity from 50 to 90 %.
The 3 International Conference on Radar, Antenna, Microwave, Electronics and Telecommunications (ICRAMET) 2014
Batam– Indonesia | 7 – 8 May 2014
ICRAMET
12
As the data will be monitored from maximum distance of 500 m, the instrument is equipped with radio transmitter and its counterpart radio receiver in ground segment. The transmitter should be able to communicate with its receiver in maximum coverage of 540 m properly. All of the sensors and radio transmitter is controlled by a microcontroller module. Instrument weight also taken into consideration as it will be lifted by the balloon which only has maximum load 14 kg weight. Since the balloon will lift four instruments, two 4 kg ropes, and two 2 kg ropes as well, each instrument weight should not exceed 2 kg and easy to carry. General diagram of the instrument is shown by Fig. 1.
B. Realization
Development of wireless weather instrument is utilizing electronic components and modules existing in local market. As the main controller of this instrument, a tiny microcontroller module Arduino Pro Mini 328, which has embedded microcontroller ATMega328, was used. This module already has some needed features for this development such as TTL logic serial communication, I2C digital two wire interface, and analog to digital conversion. The function of this module is to acquire data from the sensors, synthesize it, and then transfer the result to radio transmitter for transmission toward receiver.
For wind speed sensor, Lutron AM-4204 hot wire anemometer was chosen. This sensor has measurement range from 0.2 to 20 ms-1, high precision for low air velocity measurement, LCD display, and RS232 data communication [3]. As requirement for the sensor is it should be light and easy to carry, the sensor was modified by removing its LCD display and box. Its battery was also removed and the voltage supply was integrated into one shared battery with other sensors and electronic modules. The microcontroller module acquire data from this sensor by using RXD pin of serial communication line where AM-4204 hot wire anemometer always send 16 bit serial data, consisting of wind speed and temperature data, through this line. Because microcontroller module and the sensor have different logic level for serial communication, a RS233 to TTL converter was installed to facilitate data transfer between them.
Pressure data was acquired using BMP085 barometric pressure sensor which also useful to obtain altitude information. It has measurement range from 300 to 1100 mbar (9000 to -500 m above sea level) with resolution 0.01 mbar.
Recently, there are many temperature sensor and humidity sensor integrated in one package, such as Sensirion SHT11. This sensor can measure temperature from -40 to 123.8 °C and
humidity from 0 to 100 % with accuracy ±0.4 °C and ±3 %RH respectively [4]. SCK and MOSI pins of microcontroller must be connected to clock and data pins of the sensor to acquire temperature and humidity data in a two wire serial interface communication.
The collected sensor data is synthesized by microcontroller module to obtain composite data consisting of altitude, pressure, temperature, humidity, and wind speed information. This result is ready to be transferred to radio transmitter forwarding it directly toward the radio receiver in ground segment. Both transmitter and receiver are using YS-C20S radio transceiver module which has 10 dBm power, 433 MHz center frequency with 8 channels, -110 dBm receiving sensitivity at 9600 bps serial communication, and small size with just 25 g weight.
Radio module ability for transmitter and receiver should be analyzed by determining its link margin using link budget calculation. By considering maximum altitude is 200 m and distance of monitoring site is 500 m, the transmitter and receiver radio must be able to communicate properly with maximum range of 540 m. Hence, with transmitter power is 10 dBm without cable line, receiver and transmitter antenna gain is 3 dB, and free space loss (LFS) calculated using Eq. (2) [2]
for 433 MHz frequency (fGHz) and 540 m distance (Dkm) is
-79.828 dB. the expected received signal power will be -63.828 dBm. As the receiver sensitivity is -110 dBm, the link margin will be 46,172 dB which is much higher than 10 dB limit for building reliable communication network.
(2)
Development result of wireless weather instrument is shown by Fig. 2a. The instrument is light with just 370 g weight. Wind sensor is located inside a spaced four-level disk. Whereas pressure, temperature, and humidity sensors, they are installed in the bottom of the box (right side). The other components such as radio transmitter, microcontroller module, and wind sensor module transmitter are stored inside the box. Technical data of this instrument is described by Table 1.
The 3 International Conference on Radar, Antenna, Microwave, Electronics and Telecommunications (ICRAMET) 2014
Batam– Indonesia | 7 – 8 May 2014
ICRAMET
13
(b)
Figure 2. Wireless weather instrument (a) and its receiver (b).
Receiver module for the instrument is shown by Fig. 2b. This receiver will be connected to a computer which running a HTML file on local web server. The HTML file always read a text file created and contained with text data received from the
transmitter by Ubuntu’s minicom application, subsequently use
it to display visualization graphics of the data.
TABLE I. WIRELESS WEATHER INSTRUMENT TECHNICAL DATA. instrument, its receiver, and PVC plastic inflatable balloon were working properly. Two methods were used for this test. The first method was carried out by mounting the instruments at rope of the balloon tethered at around 20 m height. The balloon was raised by filling it with hydrogen gas until loaded completely. Only two instruments were tested and mounted at the rope. The receiver was connected to computer located on the ground.
The second method was by installing the receivers at a tower located at fifth floor of building, 18 m above ground, and transmitters were carried around as far as possible. These two methods were described by Fig. 3.
(a) (b)
Figure 3. (a) The first test method using balloon to lift the instruments and the receiver on the ground, the red arrows showing instruments position, (b) second method of test by installing receiver at a tower and the transmitter on the ground.
According to the test result, transmitters and receiver were able to communicate properly in 850 m coverage, beyond the target design. The instruments has also been able to measure wind speed, pressure, temperature and humidity using their sensors, then transmit it to the receiver in the ground. The receiver has been succeeded displaying the data into graphics as shown by Fig. 4.
Figure 4. HTML file in Local web server for displaying instrumentation results.
The 3 International Conference on Radar, Antenna, Microwave, Electronics and Telecommunications (ICRAMET) 2014
Batam– Indonesia | 7 – 8 May 2014
ICRAMET
14
Figure 5. Wind speed data comparison between wind speed sensor of wireless weather instrument (WWI) and vane anemometer of MAWS201 Vaisala.
Pressure, temperature and humidity sensors were tested and
compared its results to MAWS201 Vaisala’s sensors as well, as described by Fig. 6. In this test, the first instrument was installed at 1 m of height above ground level. Recorded pressure value in this place was 927.8 mbar. By using Eq. (1), obtained value of altitude is 736 m above sea level. The second instrument was installed together with MAWS201 Vaisala at 17 m of height above ground level. Recorded pressure value in this place was 926.1 mbar. By using Eq. (1), obtained value of altitude is 752 m above sea level.
(a)
(b)
Figure 6. Temperature and humidity data comparison between wireless weather
instrument’s (WWI) sensors and MAWS201 Vaisala’s sensors.
Fig. 6.a indicate that area of 752 m height has warmer temperature compared to the one at 736 m height as it was placed at the top of building and has direct sunlight, whereas the surface area was surrounded by trees. The instrument
temperature data also has similar pattern to MAWS Vaisala’s
temperature sensor but it has higher value, therefore it should be calibrated. Relative humidity of 752 m height area has lower humidity compared to the one at 736 m (surface) as it was warmer. The instrument data also has similar pattern to MAWS
Vaisala’s humidity sensor but it has lower value, therefore it
should be calibrated as well. This was described by Fig. 6b.
IV. CONCLUSIONS
A wireless weather instrument for multi-altitude monitoring of skydiving landing area has been developed. This instrument was able to measure wind speed, pressure, temperature, and humidity of an area. In its operation, this instruments are installed at 50 m, 100 m, 150 m, and 200 m of altitude by using a pvc plastic inflatable balloon tethered at around 202 m height. Measurement results showed that its telemetry system has coverage around 850 m. Its wind speed, pressure, temperature and pressure data have similar pattern to MAWS201 Vaisala data.
ACKNOWLEDGMENT
The authors would like to thank to all Atmospheric Technology Division’s staffs of LAPAN for their support in conducting the tests. We also thanks to Letkol Untung and his team from West Java Indonesia army for the cooperation in skydiving landing area weather monitoring project.
REFERENCES
[1] Bosch Sensortec Gmbh, “BMP085 Digital Pressure Sensor Datasheet”. 2008.
[2] J. Butler, et al., “Wireless Networking in The Developing World third edition,” The WNDW Project, 2013.
[3] Lutron Electronic, “Hot Wire Anemometer Model : AM-4204”. [4] Sensirion, “Datasheet SHT1x (SHT10, SHT11, SHT15) Humidity and
Temperature Sensor IC,” 2011.
Electronics and Telecommunications (ICRAMET) 2014
Batam– Indonesia | 7 – 8 May 2014
ICRAMET
15
Design on Multi-Coupled Ring-Resonators of
Interleave Filter with Large Free-Spectral Range by
Applying The Vernier Effects
D. Mahmudin1, Y. Taryana2 and N. Armi3
Research Center for Electronics and Telecommunication Indonesian Institute of Sciences (LIPI)
Jl. Sangkuriang, Cisitu, bandung 40135 Indonesia
Abstract— Recently, optical networks are widely used as the backbone of communications since they have large bandwidth and low transmission loss. With a wide of Free-Spectral Range (FSR), the more the number of channels that can be accomodated. They can transfer data about a hundred Gbps. The proposed Multi-Coupled Ring-Resonator (MCRR) is designed by applying the Vernier effects. In this paper was shown that a large FSR can be obtained since many resonances are induced in the proposed MCRR. The proposed MCRR is promising for optical filters with large bandwidth.
Keywords: Free-Spectral Range, multi-coupled ring-resonator, Vernier effect
I. INTRODUCTION
Explosive growth in the internet requires larger channel capacity. Dense wavelength-division multiplexing (DWDM)
is an important solution for this demand. This growth requires high performance of optical devices. One of key devices for DWDM is wavelength filter. Recently, DWDM has had channel spacing narrower than 100GHz. In order to satisfy this requirement, waveguide-based filters are pro
-posed. A concept of interleave filter or interleaver (or wavelength splitter) was also introduced to DWDM system with channel spacing <50GHz using Mach-Zhender Inter
-ference[1].
In this paper, we report our investigation of interleaver by using Multi-Coupled Ring Resonator (MCRR) . Micro
-ring resonators have been widely studied as a potential device for dense wavelength filter due to its advantages in smaller size and integratable with other devices[2]. Since microring resonators have 2 outputs, i.e. resonance output and antiresonance output, and also have periodic spectrum characteristics, they are applicable for interleavers. Another advantage of a microring resonator interleaver is that the denser DWDM channel will require larger ring radius. As a result, bending loss is negligible because the bending loss decreases with increasing ring radius. Based on optical
lattice structure theory[3], the cascade structure is provided to obtain better characteristics.
II. DEVICE MODELING
Figure 1 shows an example of Multi-Coupled Ring Resonator with ring radius r. Out-1 and Out-2 are antiresonance and resonance outputs, respectively. In 1x2 interleavers, one outport is used to passthrough odd channels and the other port passthroughs even channels. Figure 1 illustrates that resonance wavelength is set to even channels.
In
Out-2
r
K
a
K
b
K
b
K
a
Electronics and Telecommunications (ICRAMET) 2014
Batam– Indonesia | 7 – 8 May 2014
ICRAMET
16
Fig. 1 MCRR Structure
Power coupling ratios from input waveguide to ring and
from ring to output waveguide are denoted by Ka,
respectively. Power coupling ratios between two rings are
denoted by Kb. The couplings between waveguide and ring,
and between two rings are assumed as symmetric directional couplers.
Fig. 2 Block Diagram for MCRR
There are some methods to analyze microring resonator. Finite difference time domain (FDTD) method is usually used if both time and space response of fields are required. However, it will consume much memory and calculation time. In this study, since only the steady-state characteristic of microring resonator is needed, transfer matrix method[4] is simpler to be used. Signal flow chart is also applied to derive transfer function of cascaded microring resonator. Figure 2 shows block diagram of MCRR cosisting of transfer matrices of directional coupler Hci and factor of double delay lines Hdj. Equations of Hci
and Hdj are defined in the following equations:
…(1)
(2)
where and r are propagation constant, attenuation factor of waveguides and ring radius, respectively. In this analysis we assume that propagation constants of ring and input-output waveguides are same. The waveguides are also assumed as single mode. The excess loss of coupler is also neglected.
using signal flow chart. In this paper, evaluating of spectra characteristics is based on the transmittance spectrum of Out-2 (resonance output).
III. ANALYSIS : Vernier Effect
Electronics and Telecommunications (ICRAMET) 2014
Batam– Indonesia | 7 – 8 May 2014
ICRAMET
17
) 1 2 (
2
N q
L ,q 1,2,3,... (5)
(b)
Fig 5, Frequency Response of MCRR
The proposed device was analyzed using transfer matrix and signal flow-graph methods . The parameters of the designed device are set as following N = 20, L = 21, M = 22 , Ka= 10-1 and Kb= 10-3. Fig 5b shown that the vernier
effect occuring on the MCRR. The result of FSR on MCRR is 4 THz . The Band width of MCRR is 4.5 GHz as shown in Fig 5a.
IV. CONCLUSION
Design of MCRR by applying the Vernier effect is proposed. A large FSR and Bandwidth have been obtained in this design.
REFERENCES
[1] M. Oguma, K. Jinguji, K. Kitoh, T. Shibata and A.
Himeno, “Flat-passband interleave filter with 200GHz channel spacing based on planar lightwave circuit-type
lattice structure”, Elec. Lett., 36, pp.1299-2000, (2000) [2] B. E. Little, S. T. Chu, H. A. Haus, J. Foresi and J.P.
Laine, “Microring resonator channel dropping filters”,
J. Lightwave Technol., 15, pp. pp.998-1005, (1997) [3] K. Jinguji and M. Kawachi, “Synthesis of coherent
two-port lattice-form optical delay line circuit”, J. Lightwave Technol., 13, pp.73-82, (1995)
[4] J. Capmany and M.A. Muriel, “A new transfer matrix formalism for the analysis of fiber ring resonator:
compound coupled structures for FDMA
demultiplexing”, J. Lightwave Technol., 8, pp.1904 -1919, (1990)
[5] H. Nishihara, M. Haruna and T. Suhara, “Optical
integrated circuits”, McGraw Hill, p.160, (1989)
.
-20 -10 0 10 20
-20 -10 0
Relative Optical Frequency [GHz]
Transmission [dB]
N=20,L=21,M=22 Ka=10
-1
,Kb=10 -3
4.5GHz -1dB
0
1
2
3
4
-40
-20
0
Relative Optical Frequency [THz]
Transmission [dB]
The 3 International Conference on Radar, Antenna, Microwave, Electronics and Telecommunications (ICRAMET) 2014
Batam– Indonesia | 7 – 8 May 2014
ICRAMET
18
Simulation of Stacked Patch Antenna by
Moment of Method
Dian Tresnawan, B.Eng., M.EngProgram Studi Teknik Elektro , Falkutas Elektronika Industri Universitas Internasional Batam
Jl.Gajah Mada, Baloi, Sei Ladi Batam 29442
Email :[email protected]
.
Abstract—Nano Technology advances provide a larger effect on the development of the electronics world, as we have known that electronic products getting small and smaller in dimensions with high reliability for example hand phone. Antenna as supporting the advancement of Telecommunication world growth fast also, in this research focusing in Microstrip antenna for communication application. Microstrip antenna application is very wide from wireless communication, imaging and sensor. The bandwidth of microstrip antenna is quite wide but not enough wide to cover several frequencies that separated too far. In this study applied a case study making a wifi antenna of (802.11a/g) that can operate both at 2.4GHz and 5GHz. The structure of antenna element is rectangular and will be design to work at 2.4GHz, and parasitic element to cover 5GHz.The design of Microstrip antenna is to put parasitic element above the antenna element, the width of antenna element is 85mm, Gap between Ground
Plate and Element Antenna is 5.3mm and parasitic element’s
wide is 62.7mm and varying the heigh of parasitic element are 10.6mm, 15.9mm The result of study shows that the Antenna can covered 2 different bandwidth, but addition Parasitic Element at the antenna Structure does not give significant change to bandwidth.
Key Words: Microstrip Antenna, Antenna Element,Parasitic Element
I. INTRODUCTION
Telecommunication advances provide a larger effect on society, wireless communication become popular, For daily activity for example handphone until security systems, recently at many public area we can found wifi antenna can be design depend on the purpose on it. In this study focusing in Microstrip antenna for communication application.
Microstrip antenna application is very wide from wireless communication, imaging and sensor. The bandwidth of microstrip antenna is quite wide but not enough wide to cover several frequencies that separated too far [3]. To cover that problem one solution is to put parasitic element above the antenna element. By doing this, we can increase variations of current distribution besides antenna element which give the result of broaden the operation frequency as well as the bandwidth.
In this study take a case for a wifi antenna of (802.11a/g) that can operate both at 2.4GHz and 5GHz.
II. LITERATURE REVIEW
The Moment of Method (MoM) is method are usually used to
solved the problem for linear equations, in this study the method are used as follows;
1. MoM in general
If we have linier system equation as below
(1) Where:
g : known function
f : unknown to be determined L : Linier operator
To determine unknown f function we need to discretized as below
(2)
Where:
: constant value
: expansion function
From equation above we get,
(3)
![Figure 2. Structure of molecule clusters of water [3].](https://thumb-ap.123doks.com/thumbv2/123dok/3340773.1410269/41.595.357.508.467.644/figure-structure-molecule-clusters-water.webp)