DOI: 10.5897/AJB2015.15062 Article Number: A82759858323 ISSN 1684-5315
Copyright © 2016
Author(s) retain the copyright of this article http://www.academicjournals.org/AJB
African Journal of Biotechnology
Full Length Research Paper
Morphological and molecular genetic diversity of Syrian
indigenous goat populations
Halima Hassen
1*, Barbara Rischkowsky
2, Adnan Termanini
3, Ghassen Jessry
3,
Aynalem Haile
2, Michael Baum
1and Samir Lababidi
31
International Center for Agricultural Research in the Dry Areas (ICARDA), P. O. Box 6299, Rabat-Institutes, Morocco.
2
ICARDA-C/o ILRI, P. O. Box 5689, Addis Ababa, Ethiopia. 3
ICARDA, Aleppo, Syria.
Received 22 October, 2015; Accepted 8 April, 2016
Domestic goats in Syria may provide an interesting source of genetic variability due to its proximity to the centers of domestication. This study aimed to assess the morphological variation, genetic diversity and population substructure of the Syrian goat populations. Commonly, three goat genotypes are distinguished in Syria, namely Jabali or mountain goat, Baladi or local goat and Shami or Damascus (a well-known dairy goat). A pre-tested semi-structured questionnaire was used in recording both qualitative (coat color, eye color, horn length, horn orientation, nose profile) and quantitative (height at wither, chest girth, cannon length, body length, ear lengthand ear width) morphological data. Data from a total of 5,730 individual goats of the three goat populations reared in ten representative provinces of Syria were collected and analyzed using GenStat version 14 statistical packages. Results of the morphological analysis confirmed that there were clear morphological variations among the three goat populations. The three goat populations are mainly distinguished by their straight (Baladi, 71.1% and Jabali, 82.8%) and curved (Shami, 89.5%) nose profiles. Substantial phenotypic variability was found among and within the breeds suggesting that these goat breeds have not yet undergone an organized breeding program. The genetic variability and population substructures from 398 individual animals of the three breeds were genotyped using 12 DNA microsatellite markers from Food and Agricultural Organization (FAO) panel. All microsatellites typed were found to be polymorphic and a total of 41 distinct alleles were detected on Baladi, Jabali and Shami goat populations. The Syrian goat populations had observed and expected heterozygosity values that ranged from 0.50 to 0.62 and 0.74 to 0.85, respectively, and an average of 13.97 alleles per locus across breeds. For all loci, an average inbreeding values (FIS) of low to moderate level was obtained across the three goat breeds, which ranged from 0.29 (Shami goats) to 0.34 (Baladi goats) indicating the absence of mating between close relatives within these populations. The observed positive FIS coefficients among the studied goat breeds also suggested heterozygote deficiencies. The analyses of the molecular data using STRUCURE program indicated there were two primary populations, which did support the results based on morphological data of the same goat populations that clustered these goat populations into two main groups and confirmed the admixture nature of the Baladi and Jabali goat populations, while the Shami goat breed was well differentiated and grouped into a separate cluster that suggests its evolutionary and genetic uniqueness. The analysis of molecular variance (AMOVA) results detected genetic variations within individuals in a population (96%). The high genetic variability within individuals in a population provides a good base for designing genetic improvement programs under the existing goat management systems.
INTRODUCTION
Syria covers an area of 18.6 million ha and nearly half of
Syria’s land mass is classified as rangeland. The agriculture sector accounts for about 26% of Syria’s
Gross Domestic Product. Livestock provides over 34% of the total value of agricultural production, and contributes 17.7% of the value of agricultural exports. The livestock adaptability to harsh local environmental conditions and represent important genetic resources. These native breeds did not undergo extensive artificial selection by humans and are generally well-adapted to semi-arid or even arid conditions and such adaptive characteristics contribute to a growing interest on indigenous species for conservation and breeding programs.
The majority of Syria’s goat population of 2.29 million
heads consists of indigenous goats which are distributed all over the country (FAOSTAT, 2011) and raised for multipurpose uses. The economic importance of small ruminants has been increasing in Syria in recent years due to the erratic rainfall and related risk of crop failures. Besides, indigenous goat populations are known in general for heat tolerance, disease resistance, mothering and walking abilities, and the ability to efficiently metabolize low quality feeds (Trail and Gregory, 1984). Thus, indigenous goats are very valuable genetic resources adapted and suited for low-inputs-outputs agricultural production systems of the developing countries like Syria. The Mediterranean countries, namely Lebanon, Syria and Cyprus are considered as the main goat milk and cheese producer next to India (Dubeuf et al., 2004) and the Shami (Damascus) goat is well appreciated for its high milk yield and twinning ability. Recognizing the value of the Shami goats, the Syrian Ministry of Agriculture and Agrarian reform established
seven Shami goats’ improvement and conservation
research and development centers in representative provinces of the country to maintain and improve this unique goat breed. The genetic relationships and differentiation between Shami and other native goat populations available in Syria have not yet been characterized and established in a way to contribute to the declared aim of the Food and Agriculture Organization (FAO) of the United Nations to preserve the genetic diversity of domestic animals including goats.
Phenotypic and molecular characterizations have been widely used to quantify morphological and genetic diversity in small ruminants (Gizaw et al., 2007; FAO,
2012). Morphological polymorphisms are the first to be used to determine the relationship between breeds (Weigend and Romanov, 2002) and considered as an essential component of breed characterization that can be used to physically identify, describe, and recognize a breed, and also to classify livestock breeds into broad categories (FAO, 2012). The magnitude of phenotypic variability differs under different environmental conditions, in which morphometric characters are continuous characters describing aspects of body shape. In addition, microsatellite markers have also been successfully used to study the biodiversity and genetic relationship and repeat number of polymorphism, suitability for amplification by polymerase chain reaction (PCR), co-dominant inheritance and random distribution in the organism's genome have facilitated their extensive use for molecular characterization of domestic animals. Therefore, the present study was aimed to analyse the Syrian goat genetic diversity and differentiation using recommended morphological traits (FAO, 2012) and microsatellite markers (FAO, 2004) to inform the design of rational goat breeds improvement and utilization strategies.
MATERIALS AND METHODS
Description of the study area
The Syrian Arab Republic is one of the Mediterranean countries
and is located in the Middle East between 32° 19’ and 37° 30’N and 35° 45’ and 42° E with a total area of 185,400 km2. Ten out of the
fourteen Syrian provinces were selected following purposive sampling techniques by considering agro-ecology, socioeconomic importance of the indigenous goat populations, goat production systems, types of indigenous goats, the main challenges and opportunities of goat keeping. The study areas were also chosen based on previous informal and/or formal studies carried out on Syrian Jabali goats (Wurzinger et al., 2008) and other goat breeds elsewhere in North Africa and West Asia (Iniguez, 2005a, b). The ten targeted provinces were Aleppo, Al-Raqua, Al-Hasakeh, Idleb, Hama, Homs, Damascus Rural, Al-Seweida, Deir Al Zour and Tartous (Figure S1). The districts in each province were randomly selected and fifty-seven districts from the total sixty-four districts were chosen for collecting morphological data and blood samples from the targeted goat populations.
Goat populations and morphometric measurements
The agricultural development experts who were involved in the
*Corresponding author. E-mail: h.hassen@cgiar.org. Fax: +212 537 67 54 96.
actual field survey were trained on characterization of the indigenous goat populations at morphological levels. The targeted goat populations were Baladi, Jabali and Shami, which are raised and distributed almost all over the country. The populations were varied on their physical appearance and in population sizes. The Baladi goats were the most dominant followed by the Jabali goats, while the Shami goats were the least in number per flock in each
targeted study areas. These goats’ breeds were normally kept
together by smallholder farmers, which were managed under extensive management practices and studied goat populations
were sampled from farmers’ flocks. To capture the largest possible
representation of the existing genetic diversity, we sampled relatively unrelated animals from several flocks in each population for morphological and molecular characterizations of the aforementioned goat breeds. In these flocks, veterinary health care and proper small ruminant feeding are rarely practiced, mating was uncontrolled and performance recording scheme was also not existing.
Field surveys were carried out in ten representative and accessible provinces across Syria covering all agro-ecological zones for generating socioeconomic data, goat herd structure (results of the goat production system analysis and goat management systems are not presented here), and recording the physical appearances and also for measuring selected phenotypic traits. In addition, in each of the study provinces, goat owners, key informants and extension agents were interviewed using a pre-tested semi-structured questionnaire and 3 to 5 mature unrelated animals per herd were randomly selected (that would help to avoid sampling of closely related individuals) and used to measure morphological traits. In addition, a list of physical descriptors was used to record morphological variations on goats coat color, eye color, horn length, horn orientation and nose profile. Moreover, quantitative data on linear body measurements (cm) such as height at wither, chest girth, cannon length, body length, ear length and ear width were measured using a measuring tape following the descriptor list of the Food and Agriculture Organization of the United Nations FAO (1986). Besides, focus group discussions were held with livestock keepers and knowledgeable key informants for generating general information regarding the history of the various goat types and special distinguished features of the targeted goats. These descriptors were used for identifying and refining the goat populations available in Syria. Depending upon the number of each goat population within a flock (data not shown in this paper) data on a total of 5,730 individual goats of both sexes (male, n=1,071 and female, n= 4,659): 409, 2,071 and 3,250 goats of Shami, Jabali and Baladi, respectively were recorded from ten provinces following the FAO goat descriptor manual (FAO, 1986).
Blood sampling and DNA extraction
The blood samples were collected from eight representative provinces, namely Aleppo, Al-Raqua, Al-Hasakeh, Idleb, Hama, Homs, Damascus Rural and Al-Seweida which followed the distribution and the density of the Baladi, Jabali and Shami goat populations across the country (Figure S1). A total of 398 blood samples from the three targeted goat populations (Baladi, n=236, Jabali, n= 90 and Shami, n= 12) were collected from different villages and herds (one blood sample per herd). Samples were also collected from 60 Shami goats (30 samples from each station) captured in Hmemeh Shami research station in Aleppo and Karahta Shami goat research station in Damascus provinces. Samples were taken from mature genetically unrelated herds that represented the three morphologically identified goat populations. The samples were collected by puncturing the jugular vein of each animal using the 10 ml vacutainer tubes having K3-EDTA as anticoagulants, field
collection, all samples were extracted following the DNA extraction procedure described for peripheral blood lymphocytes (PBL) stored with Urea (Tapio et al., 2007). Subsequently, DNA concentrations were estimated by a Nano-DNA spectrophotometer (Pharmacia LKB-Ultraspec III) in which the quality of DNA was assessed using the ratio of A260/A280.
PCR amplification and genotyping
The DNA was amplified by PCR in a thermal cycler (GeneAmp PCR System 2700 96-well cyclers) using 12 microsatellite markers selected from FAO/ISAG panel list (FAO, 2004) described in Table 3. The forward primers of each pair were labeled with either NED (Yellow), FAM (Blue), and VIC (Green) dyes, which were supplied by Applied Biosystems Company, Warrington, UK. The primers were screened from the list of microsatellite markers recommended by FAO/ISAG in which only 12 fluorescently labelled microsatellite markers were chosen based on the degree of polymorphism obtained using genomic DNA extracted from Syrian goats. These markers were also used by different researchers for livestock genetic variability studies such as on Ethiopian goats (Hassen et al., 2012), Hamdani sheep (Al-Barzinji et al., 2011) and the characterization of other goat populations elsewhere (Visser and van Marle-Koster, 2009; Martinez et al., 2006). The 20 μl amplification reactions contained genomic DNA, 10× standard polymerase chain reaction (PCR) buffer, dNTPs, Amplicon Taq
DNA polymerase, forward and reverse primer mix and double-distilled sterilized water, which was formulated following a standard protocol (Sambrook et al., 1989) and were performed in a single PCR amplification for each locus. The reactions were processed on a thermal cycler following a step down amplification method. The PCR products were initially visualized in agarose gels stained with Ethidium bromide to identify possible imperfections and to decrease the rate of failure in capillary electrophoresis. Only the amplified PCR products were multiplexed based on their reported allele size range and the type of fluorescent labels used for each locus which were finally analyzed by capillary electrophoresis using an automated ABI Prism® 3100 DNA genetic analyzer. The data was captured using GeneScan version 3.1 software with 350 ROX labeled internal size standards and the allele sizes (bp) were determined using GeneMapper version 3.7 software (Applied Biosystems, Foster City, CA, USA). Finally, an allelic table was created from this dataset and exported to Microsoft Excel for further statistical analysis using appropriate molecular genetic analyses software.
Statistical data analyses
provinces were collected from unrelated goats of both sexes and breeds. The quantitative traits considered were height at withers, chest girth, cannon length, ear width, body length, ear length and ear width while the qualitative traits recorded were coat color, eye color, horn length, horn orientation and nose profile. Hierarchical cluster analysis was conducted and a dendrogram constructed based on Euclidean distances between populations derived from morphological variables using the unweighted pair-group method to describe morphological clustering pattern of the targeted goat populations. In the hierarchical cluster analysis, the major quantitative (height at wither, chest girth, cannon length, body length, ear length and ear width) and qualitative (coat color, eye color, horn length, horn orientation and nose profile) morphometrical variables were included, in which the data for individual traits were pooled for both sexes in each breed.
The Genetic Analysis in Excel (GenAlEx) version 6.5 (Peakall and Smouse, 2012) program and PowerMarker version 3.25 (Liu and Muse, 2005) statistical package were used to generate population genetic diversity parameters (total and average number of alleles, allele frequency, observed and expected heterozygosity). The Genetic diversities within and among goat populations were measured as the mean number of alleles (MNA) per locus and breeds as well as effective number of alleles (Ne). The effective number of alleles (Ne) per locus and breed were computed using PopGene version 1.32 software (www.ualberta.ca/~fyeh/popgene). The observed mean number of alleles (MNA), observed (Ho) and
expected heterozygosity (gene diversity) (He) values were also
computed. Using the variance-based method of Weir and Cockerham (1984) fixation indices (FIS, FIT, FST), estimated genetic
differentiation (Gst), Shannon diversity index (I) and gene flow (Nm) values for each locus and overall loci were calculated based on GenAlEx software. P-value for inbreeding coefficients (FIS) within
samples was calculated on FSTAT version 2.9.3.2 (Goudet, 2001). The MNA detected in each population and the He values are in
general good indicators of genetic polymorphism. MNA was counted as the average number of alleles observed in a population, while the He value is estimated as the proportion of heterozygote
expected in a population. The GenAlEx program was used for testing deviation or departure from Hardy-Weinberg Equilibrium (HWE) at each locus for each studied goat populations.
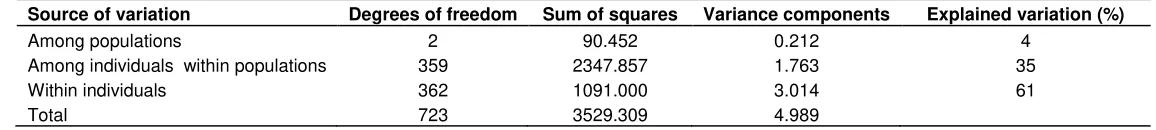
Pair-wise Reynolds’ linearized standard genetic distances between populations were calculated from allele frequencies following Nei et al. (1983) procedure in GenAlEx package. Distances obtained were used to construct a dendrogram following unweighted pair group method with arithmetic mean (UPGMA). Bootstrap (n=1,000) re-sampling was carried out to check the robustness of the phylogenetic tree and the resulting tree was visualized in TREEVIEW version 1.6.6 software. The analysis of molecular variance (AMOVA) was also performed by the GeneAlEx using the codominant allelic distance matrix with 999 permutations to partition the total covariance components into group, inter-populations within group and within population components.
The Bayesian cluster analysis using STRUCTURE version 2.3.4 software (Pritchard et al., 2000) was run to infer the genetic relationships between the Syrian goats and also to assess level of admixture. To estimate the number of subpopulations (K), ten independent runs of K = 1 to 15 were carried out with a 100,000 burn-in period at 100,000 Markov Chain Monte Carlo iterations by considering correlated allele frequencies and an admixture model. The averaged likelihood at each K was used to calculate ΔK (Evanno et al., 2005) to further investigate results from STRUCTURE using STRUCTURE HARVESTER version 0.6.94 website based program (Earl and vonHoldt, 2012), which was used as an ad hoc indicator of population number or cluster number. characterization of Syrian indigenous goat production and management systems. Rather, this part will be attempted to cover as a separate manuscript. This paper provides a range of research results on phenotypic and molecular characterization of Syrian goat populations (Baladi, Jabali and Shami) which identified substantial phenotypic and genotypic variability among and within the targeted breeds. As mentioned earlier in the methodology part, agro-ecological zones, distributions and goat densities were the main criteria used for collecting morphological data and blood samples from the purposely targeted goats breed of the Baladi, Jabali and Shami goat populations across the country (Figure S1).
Qualitative variations
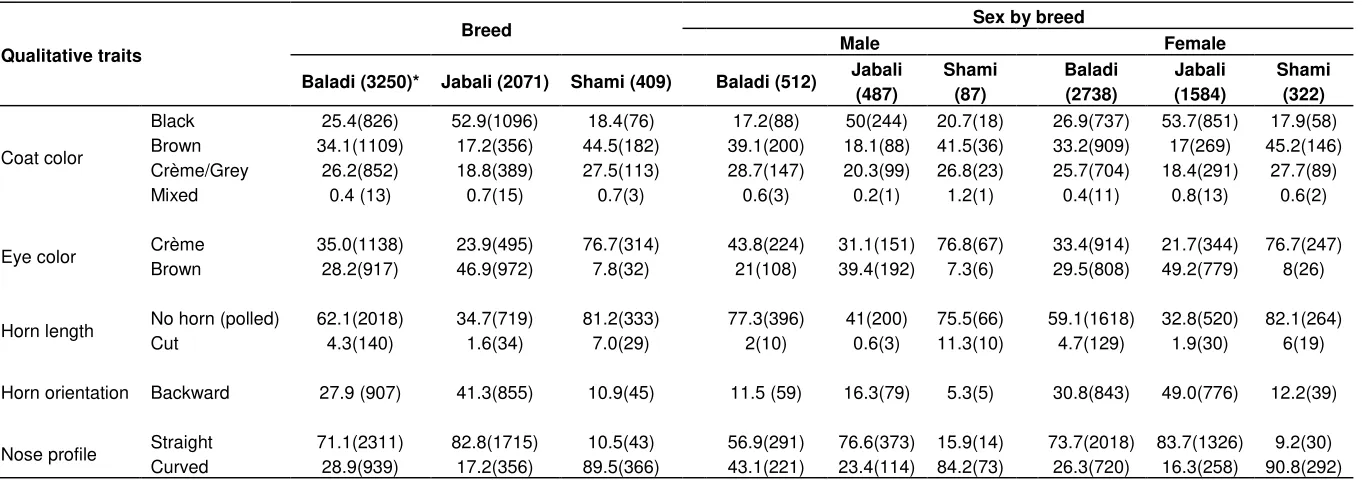
The physical body characteristics for Syrian goat breeds and their coat colors as well as their appearances are presented in Table 1. The majority of the Syrian indigenous goat populations had varying percentages of different coat color types and compositions, which could be used in most cases to distinguish the three goat populations (Figure 1). Commonly, three goat genotypes are distinguished in Syria, namely Jabali, Baladi and Shami. The majorities of the Baladi, Jabali and Shami goat populations of both sexes have predominant brown, black and brown coat colors, respectively. The most common and frequent body coat colors for these goats were black (32.23%) and brown (31.93%). Most Syria male (29.3%) and female (32.83%) goats had black coat color followed by brown. In addition, goats with crème and admixture of black, grey and brown coat colors were also observed. Such colors might have resulted from continuous selection practiced by goat owners for developing breeds with preferred colors. The most common eye color observed on Syrian goat breeds of Baladi, Jabali and Shami were crème (35%), brown (23.9%) and crème (76.9%), respectively along with the presence of various percentages of other eye colors.
Table 1. Observed mean frequency (%) values for selected qualitative traits on Syrian goat populations.
Qualitative traits
Breed Sex by breed
Male Female
Baladi (3250)* Jabali (2071) Shami (409) Baladi (512) Jabali (487)
Shami (87)
Baladi (2738)
Jabali (1584)
Shami (322)
Coat color
Black 25.4(826) 52.9(1096) 18.4(76) 17.2(88) 50(244) 20.7(18) 26.9(737) 53.7(851) 17.9(58) Brown 34.1(1109) 17.2(356) 44.5(182) 39.1(200) 18.1(88) 41.5(36) 33.2(909) 17(269) 45.2(146) Crème/Grey 26.2(852) 18.8(389) 27.5(113) 28.7(147) 20.3(99) 26.8(23) 25.7(704) 18.4(291) 27.7(89) Mixed 0.4 (13) 0.7(15) 0.7(3) 0.6(3) 0.2(1) 1.2(1) 0.4(11) 0.8(13) 0.6(2)
Eye color Crème 35.0(1138) 23.9(495) 76.7(314) 43.8(224) 31.1(151) 76.8(67) 33.4(914) 21.7(344) 76.7(247) Brown 28.2(917) 46.9(972) 7.8(32) 21(108) 39.4(192) 7.3(6) 29.5(808) 49.2(779) 8(26)
Horn length No horn (polled) 62.1(2018) 34.7(719) 81.2(333) 77.3(396) 41(200) 75.5(66) 59.1(1618) 32.8(520) 82.1(264) Cut 4.3(140) 1.6(34) 7.0(29) 2(10) 0.6(3) 11.3(10) 4.7(129) 1.9(30) 6(19)
Horn orientation Backward 27.9 (907) 41.3(855) 10.9(45) 11.5 (59) 16.3(79) 5.3(5) 30.8(843) 49.0(776) 12.2(39)
Nose profile Straight 71.1(2311) 82.8(1715) 10.5(43) 56.9(291) 76.6(373) 15.9(14) 73.7(2018) 83.7(1326) 9.2(30) Curved 28.9(939) 17.2(356) 89.5(366) 43.1(221) 23.4(114) 84.2(73) 26.3(720) 16.3(258) 90.8(292)
*- numbers in bracket refers to sample sizes taken for each qualitative trait per breed.
cutting to avoid the damage of goat ears during browsing and/or grazing. A set of distinguishable and unique characters to each goat breed is presented in pictures (Figure 1).
Quantitative variations
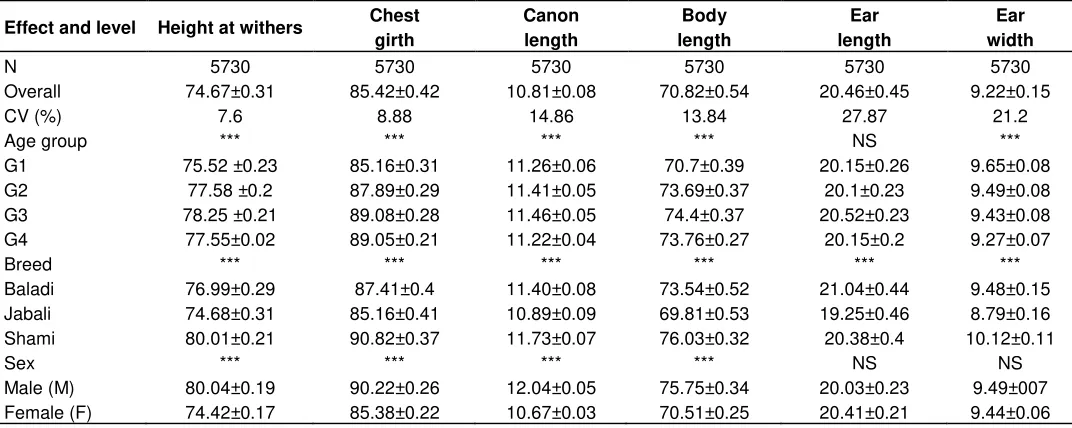
Least squares means (± SE) of the body measurements (cm) for Syrian goat breeds are depicted in Table 2. Age, breed and sex consistently showed a highly significant (p<0.001) effect on height at wither, chest girth, cannon and body length. In addition, a highly significant difference was obtained (p<0.001) among goat
breeds on ear length and difference on ear width were obtained on age and breed. The linear body measurements like height at wither, chest girth, cannon, and body length and ear width of the Syrian Shami goats were the highest followed by Baladi goats, while the Jabali goats were the smallest for all the aforementioned measured traits. Mavrogenis et al. (2006) reported comparable results regarding the body length of the Damascus (Shami) goats, which were imported into Cyprus more than 70 years ago with the aim to upgrade the local Cypriot goat population.
Majority of the Shami, Baladi and Jabali goat breeds can be distinguished by their dominant
qualitative and quantitative traits. For instance, most of the Shami goats have brown coat color, no horn and curved nose profile, while the Jabali goats have black coat, and brown eye color, no horn and have straight nose structure (Table 1 and Figure 2).
Microsatellite marker polymorphism and allelic variations
Figure 1. Physical appearance of indigenous Syrian goat populations
Table 2. Least squares means (± SE) for effects of breed, sex and age of Syrian goat breeds on quantitative traits.
Effect and level Height at withers Chest girth
Canon length
Body length
Ear length
Ear width
N 5730 5730 5730 5730 5730 5730
Overall 74.67±0.31 85.42±0.42 10.81±0.08 70.82±0.54 20.46±0.45 9.22±0.15
CV (%) 7.6 8.88 14.86 13.84 27.87 21.2
Age group *** *** *** *** NS ***
G1 75.52 ±0.23 85.16±0.31 11.26±0.06 70.7±0.39 20.15±0.26 9.65±0.08 G2 77.58 ±0.2 87.89±0.29 11.41±0.05 73.69±0.37 20.1±0.23 9.49±0.08 G3 78.25 ±0.21 89.08±0.28 11.46±0.05 74.4±0.37 20.52±0.23 9.43±0.08 G4 77.55±0.02 89.05±0.21 11.22±0.04 73.76±0.27 20.15±0.2 9.27±0.07
Breed *** *** *** *** *** ***
Baladi 76.99±0.29 87.41±0.4 11.40±0.08 73.54±0.52 21.04±0.44 9.48±0.15 Jabali 74.68±0.31 85.16±0.41 10.89±0.09 69.81±0.53 19.25±0.46 8.79±0.16 Shami 80.01±0.21 90.82±0.37 11.73±0.07 76.03±0.32 20.38±0.4 10.12±0.11
Sex *** *** *** *** NS NS
Male (M) 80.04±0.19 90.22±0.26 12.04±0.05 75.75±0.34 20.03±0.23 9.49±007 Female (F) 74.42±0.17 85.38±0.22 10.67±0.03 70.51±0.25 20.41±0.21 9.44±0.06
***, p<0.001; NS, Non-significant; *- G1, G2, G3 and G4 are referred to the age of the goats from 1 to 2, >2 to 3, > 3 to 4 and > 4 years old, respectively.
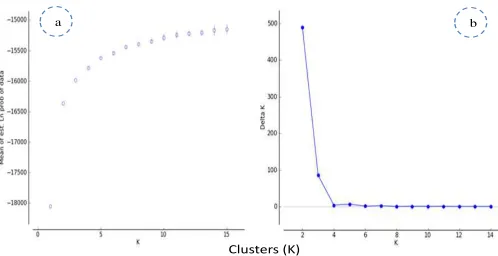
Figure 2. (a) Dendrogram showing morphological and (b). molecular variabilities among Syrian goat populations.
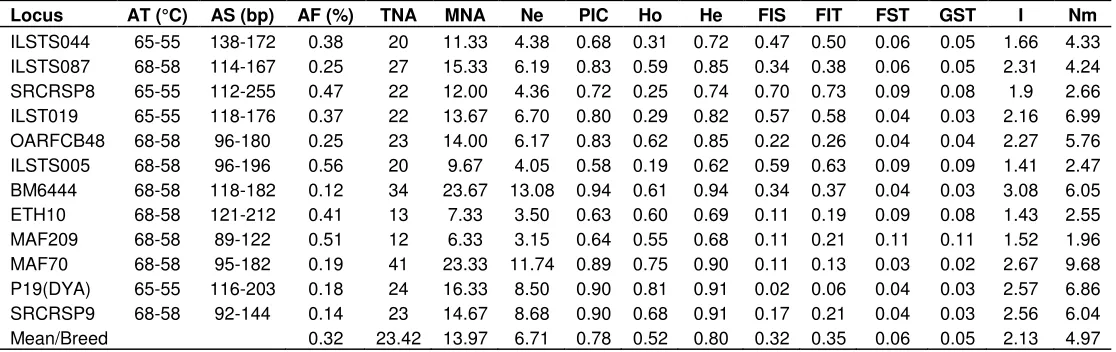
Table 3. Basic characteristics of each microsatellite loci used, annealing temperature (AT), observed allele size (AS) range, major allele frequency (AF), total number of alleles (TNA), mean number of alleles (MNA), effective number of alleles (Ne), polymorphic information content (PIC), Observed heterozygosity (Ho), Expected Heterozygosity (He), Wright’s F-statistics (FIT, FIS, FST), observed genetic
differentiation (GST), Shannon diversity index (I) and gene flow (Nm) values by locus across studied Syrian goat populations
Locus AT (°C) AS (bp) AF (%) TNA MNA Ne PIC Ho He FIS FIT FST GST I Nm
ILSTS044 65-55 138-172 0.38 20 11.33 4.38 0.68 0.31 0.72 0.47 0.50 0.06 0.05 1.66 4.33 ILSTS087 68-58 114-167 0.25 27 15.33 6.19 0.83 0.59 0.85 0.34 0.38 0.06 0.05 2.31 4.24 SRCRSP8 65-55 112-255 0.47 22 12.00 4.36 0.72 0.25 0.74 0.70 0.73 0.09 0.08 1.9 2.66 ILST019 65-55 118-176 0.37 22 13.67 6.70 0.80 0.29 0.82 0.57 0.58 0.04 0.03 2.16 6.99 OARFCB48 68-58 96-180 0.25 23 14.00 6.17 0.83 0.62 0.85 0.22 0.26 0.04 0.04 2.27 5.76 ILSTS005 68-58 96-196 0.56 20 9.67 4.05 0.58 0.19 0.62 0.59 0.63 0.09 0.09 1.41 2.47 BM6444 68-58 118-182 0.12 34 23.67 13.08 0.94 0.61 0.94 0.34 0.37 0.04 0.03 3.08 6.05 ETH10 68-58 121-212 0.41 13 7.33 3.50 0.63 0.60 0.69 0.11 0.19 0.09 0.08 1.43 2.55 MAF209 68-58 89-122 0.51 12 6.33 3.15 0.64 0.55 0.68 0.11 0.21 0.11 0.11 1.52 1.96 MAF70 68-58 95-182 0.19 41 23.33 11.74 0.89 0.75 0.90 0.11 0.13 0.03 0.02 2.67 9.68 P19(DYA) 65-55 116-203 0.18 24 16.33 8.50 0.90 0.81 0.91 0.02 0.06 0.04 0.03 2.57 6.86 SRCRSP9 68-58 92-144 0.14 23 14.67 8.68 0.90 0.68 0.91 0.17 0.21 0.04 0.03 2.56 6.04 Mean/Breed 0.32 23.42 13.97 6.71 0.78 0.52 0.80 0.32 0.35 0.06 0.05 2.13 4.97
characteristics and the nature of the twelve selected microsatellite markers used in this study are summarized in Table 3. Results of molecular genetic analysis showed that all twelve loci were polymorphic; none of the markers were monomorphic and were adhered to the parameters for studying genetic diversity. A total of 281 alleles were detected at the 12 microsatellite loci on three studied goat breeds. The observed mean number of alleles per locus ranged from 6.33 (MAF 209) to 23.67 (BM6444), with an average of 13.97 alleles per locus across breeds. The observed number of alleles at a locus (Table 3) and the genetic distance values (Table 5) indicated genetic variability at that locus, which suggested the appropriateness of the loci to be used to analyze genetic diversity on goats. It was also suggested that for studies
of genetic diversity and genetic distance within and among populations, microsatellite markers should have no fewer than four alleles which could help to reduce standard errors of distance estimate (Barker et al., 2001). The effective number of alleles (Ne) ranged from 3.15 (MAF209) to 13.08 (BM6444), with an overall mean of 6.71 alleles per locus. All the loci used to analysis the Syrian goat diversity were highly informative which make them useful in genetic diversity studies. This is due to the fact that if a locus has PIC value > 0.5 that locus is considered as highly polymorphic loci; while a locus with PIC values ranging from 0.25 to 0.5 is clustered as a medium polymorphic marker (Vanhala et al., 1998). In this investigation, all loci were highly polymorphic, with PIC value range from 0.58 (ILSTS005) to 0.94 (BM6444),
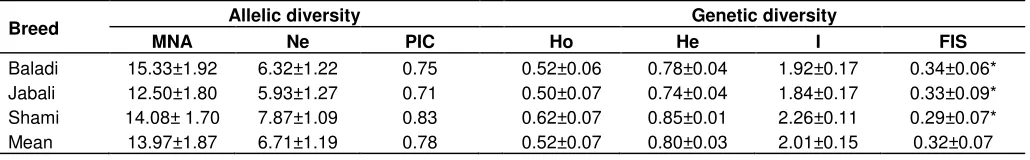
Table 4. Breed level allelic and genetic diversity: mean number of alleles (MNA), Polymorphic Information Content (PIC), effective
number of alleles (Ne), Shannon’s diversity index (I), observed (Ho), and expected (He) heterozygosity and inbreeding coefficient (FIS)
values for Syrian goat populations.
Breed Allelic diversity Genetic diversity
MNA Ne PIC Ho He I FIS heterozygosity value ranged between 0.62 (ILSTS005) and 0.94 (BM6444) with an overall mean of 0.80, whereas the observed heterozygosity value ranged from 0.19 (ILSTS005) to 0.81 (P19) with an average value of 0.52 (Table 3).
Genetic diversity and differentiation
The genetic variability of each subpopulation was initially studied in terms of observed and effective number of alleles, as shown in Table 3 and the three goat breeds were having varied mean number of alleles. Genetic diversity analyses also suggested substantial genetic variability within the studied goats breeds (96%) (Table S2) in which its value supported by the morphological characterization study carried out on the same goat populations (Tables 1 and 2). The genetic diversity of each goat breed also showed considerable differences when measured in MNA per breed across all loci that ranged between 12.50 for Jabali goat and 15.33 for Baladi goat breeds. The Syrian Jabali goats had less than the average number of allele, while the Shami and Baladi goat breeds had higher mean number of alleles (Table 4). It was suggested that the observed MNA over a range of loci across different population is considered to be a good indicator of genetic variation within a given animal population (MacHugh et al., 1997).
Observed mean heterozygosity value was lower than the expected mean heterozygosity for all studied goat populations. The average observed and expected heterozygozity values ranged from 0.50 to 0.62 and 0.74 to 0.85, respectively. Moreover, the mean observed and expected heterozygosity values across all loci on studied goat populations were 0.52 and 0.80, respectively (Table 4), which were comparable with studies carried out on other domestic goat breeds (Kumar et al., 2005; Aggarwal et al., 2007; Dixit et al., 2008; Hassen et al., 2012). Due to its geographical location, Syria is considered as one of the countries believed to be home for small ruminant populations including the present domesticated goat breeds. The presence of long
term natural selection for adaptation and the existence of interbreeding as result of the free movement of animals in the area are thought to contribute at large to the broad genetic diversity of the Syrian goats. The genetic diversity observed in Syrian goat breeds was comparable with the results reported on South-East Asian goats (Barker et al., 2001), Chegu goats (Behl et al., 2003), Indian goats relatively high polymorphism for analyzing genetic diversity in goats.
Populations genetic differentiation were evaluated base on fixation indices (FIS, FIT and FST) according to Weir
and Cockerham (1984), genetic differentiation (GST),
Shannon diversity index (I) and gene flow (Nm) values using 12 microsatellite markers across three goat breeds (Table 3). The mean estimates of F-statistics obtained over loci were FIS = 0.32, FIT = 0.35 and FST = 0.06. The
within breed deficit or excess in heterozygosity value was assessed by the inbreeding coefficients (FIS), ranged between 0.02 (P19) to 0.70 (SRCRSP8), with an average of 0.32 across all loci, while the degree of differentiation The mean FST value (0.06) indicates that most of the total
genetic variation corresponds to differences among individuals within goat populations (Table S2). Both high FIS and FST values imply considerable degree of
inbreeding and genetic differentiation among goat populations, respectively. Values of GST ranging from
0.02 (MAF70) to 0.11 (MAF209), with a mean of 0.05 (Table 3), reveal that genetic variation among the studied goat breeds was relatively low (5%).
At goat breed level, the inbreeding coefficients (FIS
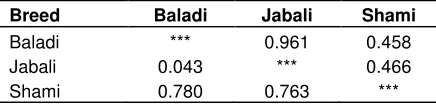
Table 5. Pair wise estimate of genetic identity (above diagonal) and genetic distance (below diagonal) values for Syrian goat populations. goat populations (Table 4), respectively. It was suggested that less inbreeding values of less than 0.5 or closer to zero (Wang, 1996) might have happened due to the absence of mating between close relatives and/or within individuals. Similarly, such comparable inbreeding values were also reported for Asian (Barker et al., 2001), Indian goat populations (Kumar et al., 2005; Aggarwal et al., 2007; Dixit et al., 2008; Dixit et al., 2010) and local Albanian goat breeds (Hoda et al., 2011).
The HWE test results revealed that most of the markers used to study Syrian goats were not in HWE, except one locus (that is, ETH10) did show adherence to HWE for Jabali goats (Table S1). Several researchers (Laval et al., 2000; Barker et al., 2001) reported similar results of deviation from HWE for goat diversity studies using microsatellite markers. A population is considered to be within HWE when it is able to maintain its relative allele frequencies. Departure from HWE occurred when there is no excess heterozygotes due to the presence of null alleles (Pemberton et al., 1995), small sample size, migration, selection intensity, uncontrolled goat breeding practices, presence of less heterozygosity (Wahlund effect) and decreased heterozgosity due to inbreeding (Kumar et al., 2006).
Genetic relationships and phylogenetic analyses based on morphological and molecular data
The mean morphological values of both qualitative and quantitative characters were used as classifying variable, and the three goat populations were grouped into two main clusters as indicated in the dendrogram (Figure 2a). Cluster one contains Baladi and Jabali goat populations, while cluster two contains the Shami goats indicating that the Shami goats is relatively different from the two goat populations and was consistent with our earlier assumptions. Further subdivisions between Baladi and Jabali goats showed that these subpopulations were developed from different but closely related goat populations which were also consistent with our earlier hypothesis. Substantial phenotypic variability was found among and within these breeds suggesting that these
goat breeds are not under an-organized breeding program.
The Syrian goat populations genetic dissimilarity was computed using molecular data and the smallest genetic distance value was detected between Baladi and Jabali goat populations (0.043), while the largest genetic morphological dataset from the same goat populations.
Population genetic structure analyses
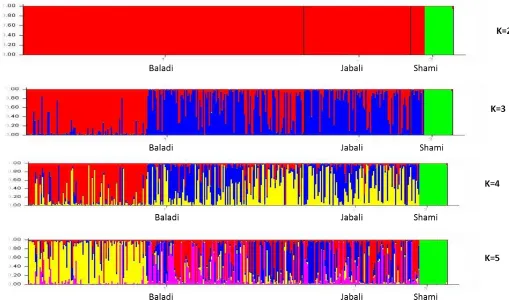
Figure 3. Depicts the clustering of all samples at k= 2, k=3, k= 4 and k=5, and each individual is represented by a vertical bar and
partitioned into different colored segments with the length of each segment representing the proportion of the individual’s genome, and populations are separated by backlines and each population is labeled.
inseparable subpopulation were also created. Hence, at K = 3, all three goat breeds appeared to have distinguishable admixture patterns, especially the Shami goat population was clearly separated from the rest of the Syrian goat populations at K= 2 to K= 5 with some levels of genetic dilution present with other Syrian goats. The Shami goat population had the least cases of genome admixtures, which is consistent with the phylogenetic tree constructed using the morphological data generated from the same goat populations (Figure 2a). This might be due to the fact that the Shami goats are raised mainly for milk and used as a milk-improver breed for crossing with other goat breeds in Syria and beyond (for example, in Cyprus). This might be due to the fact that the Shami goat owners might not erode and dilute the genetic identity of this goat breed by crossing with other goats breeds kept in a flock, which actually needs further investigation. The admixture plot at K = 3 could best describe the Syrian goat structure in which the three indigenous goat populations were represented by three predominating colors and distinct admixture patterns. These results suggest that Syrian indigenous goat breeds may descend from the same ancestor(s).
Further, to elucidate the relationships between the Syrian goat populations and provide finer quantification of
the different ancestral contributions, STRUCTURE HARVESTER analysis was conducted by evaluating
replicate likelihoods and resultant ΔK statistics for
different values of K ( K= 1 to 15). The Ln (K) values increased from K= 1 to K=2, and somewhat less quickly from K= 2 to K= 3, before reaching a plateau at successive values (Figure S2a). The largest value of ΔK
occurred for K= 2 (ΔK = 488.67) and, secondarily, for K= 3 (ΔK =85.26) (Figure S2b).
Conclusion
separate subpopulations. However, only the Shami goat population was structurally different and clustered into a separate group as a result of its high genetic distance compared to the other two goat breeds of Syria. The higher genetic variability in Shami goats may mean the presence of private or unique alleles suggesting the presence of certain functional genes which may result to better adaptability and performances. The results also reveal the presence of higher genetic variability within the goat population (96%) and such high variation within breed provides an excellent base for designing genetic improvement program.
Conflict of Interests
The authors have not declared any conflict of interests.
ACKNOWLEDGEMENT
The authors thank gratefully the International Center for Agricultural Research in the Dry Areas (ICARDA)-Science for Better Livelihoods in the Dry Areas for the financial support and the farmers for their kind cooperation and willingness of sharing their knowledge with the research team.
REFERENCES
Aggarwal RA, Dixit SP, Verma NK, Ahlawat SPS, Kumar Y, Kumar S, Chander R, Singh KP (2007). Population genetics analysis of Mehsana goat based on microsatellite markers. Curr. Sci. 92:1133-1137.
Al-Barzinji YM, Lababidi S, Rischkowsky B, Al-Rawi AA, Tibbo M, Hassen H, Baum M (2011). Assessing genetic diversity of Hamdani sheep breed in Kurdistan region of Iraq using microsatellite markers. Afr. J. Biotechnol. 10(67):15109-15116.
Barker JSF, Tan SG, Moore SS, Mukherjee TK, Matheson JL, Selvaraj OS (2001). Genetic variation within and relationships among populations of Asian goats (Capra hircus). J. Anim. Breed Genet. 118(4):213-233.
Baumung R, Cubric-Curik V, Schwend K, Achmann R, Solkner J (2006). Genetic characterization and breed assignment in Austrian sheep breeds using microsatellite marker information. J. Anim. Breed. Genet. 123:265-271.
Behl R, Sheoran N, Behl J, Vijh RK, Tantia MS (2003). Analysis of 22 heterologous microsatellite markers for genetic variability in Indian goats. Anim. Biotechnol. 14:167-175.
Bizhan M, Majnoun ShB (2009). The investigation of genetic variation in Taleshi goat using microsatellite markers. Biol. Sci. 4(6):644-646. Dixit SP, Verma NK, Aggarwal RAK, Vyas MK, Rana J, Sharma A,
Tyagi P, Arya P Ulmek BR (2010). Genetic diversity and relationship among southern Indian goat breeds based on microsatellite markers. Small Rumin. Res. 91:153-159.
Dixit SP, Verma NK, Ahlawat SPS, Aggarwal RAK, Kumar S Singh KP (2008). Molecular genetic characterization of Kutchi breed of goat. Curr. Sci. 95:946-952.
Dubeuf JP, Morand-Fehr P, Rubino R (2004). Situation, changes and future of goat industry around the world. Small Rumin. Res. 51:165-173.
Earl D, vonHoldt B (2012). STRUCTUREHARVESTER: a website and program for visualizing STRCUTURE output and implementing Evanno method. Conserv. Genet. Resour. 4:359-361.
Evanno G, Regnaut S, Gaudet J (2005). Detecting the number of clusters of individuals using the software STRUCTURE: a simulation study. Mol. Ecol. 14:2611-2620.
FAO (1986). Animal genetic resource data banks-2. Descriptor lists for cattle, buffalo, pigs, sheep and goats, Rome, Italy.
FAO (2004). Secondary guidelines for development of national farm animal genetic resources management planes. Measurement of domestic animal diversity (MoDAD): Recommended microsatellite markers, Rome, Italy.
FAO (2012). Phenotypic characterization of animal genetic resources, Rome, Italy.
FAOSTAT (2011). http://faostat.fao.org.
Gizaw S, van Arendonk JAM, Komen H, Windig JJ, Hanotte O (2007). Population structure, genetic variation and morphological diversity in indigenous sheep of Ethiopia. Anim. Genet. 38:621-628.
Goudet J (2001). FSTAT, a program to estimate and test gene diversities and fixation indices (version 2.9.3). Updated from Goudet, J (1995). FSTAT v-1.2. A computer program to calculate F-statistics. J. Hered. 86:485-486.
Hajar B (2006). Sheep trade in Syria. Ministry of Agriculture and Agrarian Reform- National Agricultural Policy Center NAPC), Commodity Brief No. 4, (http://www.napcsyr.org).
Hancock J, Louca A (1975). Polledness and intersexuality in the Damascus breed of goat. Anim. Prod. 21:227-231.
Hassen H, Lababidi S, Rischkowsky B, Baum M Tibbo M (2012). Molecular characterization of Ethiopian indigenous goat populations. Trop. Anim. Health Prod. J. 44(6):1239-1246.
Hoda A, Hyka G, Dunner S, Obexer-Ruff G, Econogene Consortium (2011). Genetic diversity of Albanian goat breeds based on microsatellite marker. Arch. Zootec. 60(230):605-613.
Iniguez LC (2005a). Characterization of small ruminant breeds in West Asia and North Africa. Vol. 1. West Asia. International Center for Agricultural Research in the Dry Areas (ICARDA), Aleppo, Syria. Iniguez LC (2005b). Characterization of small ruminant genetic
resources in West Asia and North Africa, Vol. 2. North West Asia. International Center for Agricultural Research in the Dry Areas (ICARDA), Aleppo, Syria.
Jakobsson M, Rosenberg NA (2007). CLUMPP: a cluster matching and permutation program for dealing with label switching and multimodality in analysis of population structure. Bioinformatics 23(14):1801-1806.
Kumar D, Dixit SP, Sharma R, Pandey AK, Sirohi G, Patel AK, Aggarwal RAK, Verma NK, Gour DS, Ahlawat SPS (2005). Population structure, genetic variation and management of Marwari goats. Small Rumin. Res. 59:41-48.
Kumar S, Gupta J, Kumar N, Dikshit K, Navani N, Jain P, Nagarajan M (2006). Genetic variation and relationships among eight Indian Riverine Buffalo breeds. Mol. Ecol. 15:593-600.
Kumar S, Dixit SP, Verma NK, Singh DK, Pande A, Chander R, Singh LB (2009). Genetic diversity analysis of the Gohilwari breed of Indian goat (Capra hircus) using microsatellite markers. Am. J. Anim. Vet. Sci. 4:49-57.
Laval G, Lannuccelli N, Legault C, Milan D, Groenen MA, Giuffra E, Andersson L, Nissen PH, Jorgensen CB, Beckmann P, Geldermann H, Foulley JL, Chevalet C, Olivier L (2000). Genetic diversity of eleven European Pig breeds. Genet. Sel. Evol. 32(2):187-203. Liu K, Muse SV (2005). PowerMarker: An integrated analysis
environment for genetic marker analysis. Bioinformatics 21:2128-2129.
MacHugh DE, Shriver MD, Loftus RT, Cunningham P, Bradley DG (1997). Microsatellite DNA variation and the evolution, domestication and phytogeography of Taurine and Zebu cattle (Bos taurus and Bos indicus). Genetics 146:1071-1086.
Martinez AM, Acosta J, Vega-Pla JL, Delgado JV (2006). Analysis of the genetic structure of the Canary goat populations using microsatellites. Livest. Sci. 102:140-145.
Mavrogenis AP, Antoniades NY, Hooper ERW (2006). The Damascus (Shami) goat of Cyprus. Anim. Genet. Resour. 38:57-65.
Nei M, Tajima F, Tateno Y (1983). Accuracy of estimated phylogenetic trees from molecular data- II-Gene frequency data. J. Mol. Evol. 19(2):153-170.
Population genetic software for teaching and research– an update. Bioinformatics 28:2537-2539.
Pemberton J M, Slate J, Bencroft D R, Barrett JA (1995). Non-amplifying alleles at microsatellite loci: A caution for parentage and population studies. Mol. Ecol. 4:249-252.
Pritchard JK, Stephens M, Donnelly P (2000). Inference of population structure using multi-locus genotype data. Genetics 155:945-959. Rosenberg NA (2004). DISTRUCT: a program for the graphical display
of population structure. Mol. Ecol. Resour. 4:137-138.
Ruane J (1999). A critical review of the value of genetic distance studies in conservation of animal genetic resources. J. Anim. Breed. Genet. 116:317-323.
Sambrook J, Fritsch EF, Maniatis T (1989). Molecular cloning: a laboratory manual, 2nd edn. Cold Spring Harbor Laboratory, Cold Spring Harbor, New York.
Tapio M, Lababidi S, David M, Olivier H, Massoud M, Baum M (2007). A practical approach to microsatellite genotyping with special reference to livestock population genetics. International Center for Agricultural Research in the Dry Areas (ICARDA), Aleppo, Syria.
Toro MA, Fernandez J, Caballero A (2006). Scientific basis for policies in conservation of farm animal genetic resources. Proceedings of the 8th World Congress on Genetics Applied to Livestock Production, 13-18 August 2006, Belo Horizonte, Brazil.
Trail CM, Gregory KE (1984). Animal breeding in sub-Saharan Africa towards an integrated program for improving productivity: Livestock development in sub-Saharan Africa. Western Press, Boulder, Colorado,
Vahidi SMF, Tarang AR, Naqvi A, Anbaran MF, Boettcher P, Joost S, Colli L, Garcia JF, Ajmone-Marsan P (2014). Investigation of the genetic diversity of domestic Capra hircus breeds reared within an early goat domestication area in Iran. Genet. Sel. Evol. 46(27):1-12.
Vanhala T, Tuiskula-Haavisto M, Elo K (1998). Evaluation of genetic distances between eight chicken lines using microsatellite markers. Poult. Sci. 77:783-790.
Visser C, van Marle-Koster E (2009). Genetic variation of the reference population for quantitative trait loci research in South African angora goats. Anim. Genet. Resour. 45:113-119.
Wang J (1996). Deviation from Hardy–Weinberg proportions in finite populations. Genet. Res. 68:249-257.
Weigend S, Romanov MN (2002). The world watch list for domestic animal diversity in the context of conservation and utilization of Poultry biodiversity. Worlds Poult. Sci. J. 58 (4):411-430.
Weir BS, Cockerham CC (1984). Estimating F-statistics for the analysis of population structure. Evolution 38(6):1358-1370.
Wilson RT, Durkin JW (1984). Age at permanent incisor eruption in indigenous goats and sheep in semi-arid Africa. Livest. Prod. Sci. 11(4):451-455.
Figure S1. Map of Syria showing sampled provinces.
Figure S2 (a, b). Mean Log-likelihood (left-a) and ΔK (right-b) based on 10 replicated STRUCTURE runs for Syrian goat breeds.
717
340
705
663
523
501 611
658
Morphological data
508
504
Blood samples
Table S1. Analyzed mean number of alleles (MNA), effective number of alleles (Ne), Polymorphic Information Content (PIC), expected (He) and observed heterozygosity (Ho) values, Shannon diversity index (I), inbreeding coefficient (FIS) and Hardy Weinberg equilibrium (HWE) p-values.
Locus Baladi Jabali Shami
MNA Ne PIC He Ho I HWE MNA Ne PIC He Ho I HWE MNA Ne PIC He Ho I HWE
ILSTS044 10 3.16 0.65 0.69 0.30 1.41 0.000*** 12 3.52 0.62 0.67 0.26 1.54 0.000*** 12 6.46 0.82 0.84 0.56 2.14 0.000***
ILSTS087 18 5.46 0.8 0.82 0.61 2.02 0.000*** 15 5.72 0.79 0.81 0.60 2.11 0.000*** 13 7.38 0.84 0.86 0.39 2.26 0.000***
SRCRSP8 14 3.41 0.72 0.74 0.30 1.66 0.000*** 10 2.88 0.53 0.56 0.20 1.53 0.000*** 12 6.80 0.81 0.83 0.09 2.26 0.000***
ILST019 17 4.85 0.79 0.80 0.26 1.97 0.000*** 10 4.70 0.74 0.76 0.19 1.87 0.000*** 14 10.56 0.89 0.89 0.69 2.52 0.000***
OARFCB48 14 6.20 0.8 0.82 0.59 2.11 0.000*** 13 5.00 0.81 0.83 0.63 1.90 0.003** 15 7.32 0.87 0.88 0.86 2.18 0.000***
ILSTS005 9 2.15 0.5 0.54 0.14 1.09 0.000*** 7 2.52 0.5 0.58 0.19 1.09 0.000*** 13 7.49 0.85 0.86 0.50 2.22 0.000***
BM6444 31 15.99 0.94 0.94 0.61 2.99 0.000*** 26 18.08 0.92 0.93 0.69 3.05 0.000*** 14 5.17 0.77 0.78 0.47 2.27 0.000***
ETH10 7 2.79 0.58 0.65 0.58 1.17 0.030* 7 2.93 0.57 0.64 0.72 1.22 0.948ns 8 4.77 0.76 0.79 0.46 1.80 0.000***
MAF209 8 2.85 0.63 0.67 0.58 1.34 0.000*** 4 2.27 0.42 0.47 0.39 0.97 0.000*** 7 4.32 0.73 0.77 0.76 1.62 0.000***
MAF70 21 7.92 0.86 0.87 0.73 2.36 0.000*** 21 8.64 0.88 0.89 0.75 2.46 0.000*** 28 18.65 0.94 0.94 0.86 3.16 0.000***
P19(DYA) 18 10.57 0.9 0.91 0.81 2.48 0.000*** 15 6.93 0.85 0.86 0.80 2.20 0.001*** 16 8.00 0.87 0.88 0.89 2.31 0.000***
SRCRSP9 17 10.51 0.89 0.90 0.67 2.47 0.000*** 10 8.00 0.86 0.88 0.61 2.14 0.000*** 17 7.54 0.87 0.88 0.89 2.34 0.000***
Mean 15.33 6.32 0.75 0.78 0.52 1.92 12.5 5.93 0.71 0.74 0.50 1.84 14.08 7.87 0.83 0.85 0.62 2.26
ns = not significant, *p < 0.05, **p < 0.01, ***p < 0.001 did not adhere to HWE.
Table S2. Analysis of molecular variance (AMOVA) for Syrian goat populations using genotyped data from twelve microsatellite markers.
Source of variation Degrees of freedom Sum of squares Variance components Explained variation (%)
Among populations 2 90.452 0.212 4
Among individuals within populations 359 2347.857 1.763 35
Within individuals 362 1091.000 3.014 61