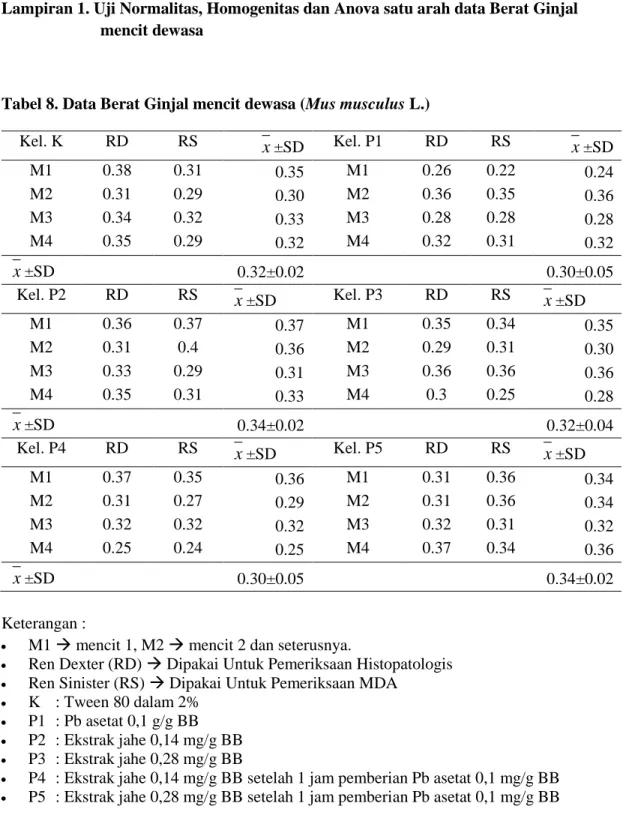
Tabel 8. Data Berat Ginjal mencit dewasa (Mus musculus L.)
Kel. K RD RS x ±SD Kel. P1 RD RS x ±SD
M1 0.38 0.31 0.35 M1 0.26 0.22 0.24
M2 0.31 0.29 0.30 M2 0.36 0.35 0.36
M3 0.34 0.32 0.33 M3 0.28 0.28 0.28
M4 0.35 0.29 0.32 M4 0.32 0.31 0.32
x ±SD 0.32±0.02 0.30±0.05
Kel. P2 RD RS x ±SD Kel. P3 RD RS x ±SD
M1 0.36 0.37 0.37 M1 0.35 0.34 0.35
M2 0.31 0.4 0.36 M2 0.29 0.31 0.30
M3 0.33 0.29 0.31 M3 0.36 0.36 0.36
M4 0.35 0.31 0.33 M4 0.3 0.25 0.28
x ±SD 0.34±0.02 0.32±0.04
Kel. P4 RD RS x ±SD Kel. P5 RD RS x ±SD
M1 0.37 0.35 0.36 M1 0.31 0.36 0.34
M2 0.31 0.27 0.29 M2 0.31 0.36 0.34
M3 0.32 0.32 0.32 M3 0.32 0.31 0.32
M4 0.25 0.24 0.25 M4 0.37 0.34 0.36
x ±SD 0.30±0.05 0.34±0.02
Keterangan :
M1 mencit 1, M2 mencit 2 dan seterusnya.
Ren Dexter (RD) Dipakai Untuk Pemeriksaan Histopatologis
Ren Sinister (RS) Dipakai Untuk Pemeriksaan MDA
K : Tween 80 dalam 2%
P1 : Pb asetat 0,1 g/g BB
P2 : Ekstrak jahe 0,14 mg/g BB
P3 : Ekstrak jahe 0,28 mg/g BB
P4 : Ekstrak jahe 0,14 mg/g BB setelah 1 jam pemberian Pb asetat 0,1 mg/g BB
P5 : Ekstrak jahe 0,28 mg/g BB setelah 1 jam pemberian Pb asetat 0,1 mg/g BB
a. Uji distribusi normal data berat ginjal mencit:
Tests of Normality
.155 4 . .998 4 .995
.151 4 . .993 4 .972
.237 4 . .939 4 .650
.262 4 . .895 4 .408
.131 4 . .999 4 .998
.250 4 . .945 4 .683
Kelompok K P1 P2 P3 P4 P5 Berat _ginjal
St at ist ic df Sig. St at ist ic df Sig.
Kolmogorov -Smirnova Shapiro-Wilk
Lillief ors Signif icance Correction a.
b. Uji variansi data:
Test of Homogeneity of Variance
2.267 5 18 .092
2.242 5 18 .095
2.242 5 11.108 .122
2.266 5 18 .092
Based on Mean Based on Median Based on Median and with adjusted df
Based on t rimmed mean Berat _ginjal
Lev ene
St at ist ic df 1 df 2 Sig.
Hasil: Berdistribusi normal (shapiro-Wilk; p>0,05) dan variansi data homogen (p>0,05).
Data dapat dinalisis dengan Anova stau arah pada kesalahan taraf 5% karena lebih dari 2 perlakuan.
Oneway Anova:
ANOVA Berat _ginjal
.006 5 .001 .940 .479
.023 18 .001
.029 23
Between Groups Within Groups Total
Sum of
Squares df Mean Square F Sig.
Hasil analisis Anova menunjukkan tidak ada perbedaan yang nyata antara kelompok-
kelompok perlakuan. Maka tidak perlu dilakukan uji lanjut.
Tabel 9. Data Konsentrasi MDA Ginjal mencit jantan dewasa (Mus musculus L.)
K P1 P2 P3 P4 P5
Konsentrasi MDA
19.313 16.450 26.008 23.746 12.167 11.767
17.946 26.267 12.892 20.633 11.950 17.867
13.929 24.583 17.275 19.013 12.333 13.500
14.729 16.183 17.533 28.896 9.867 12.033
x ±SD 16.479
±2.565
20.871
±5.305
18.427
±5.485
23.072
±4.351
11.579
±1.152
13.792
±2.822 Keterangan :
K : Tween 80 dalam 2%
P1 : Pb asetat 0,1 mg/g BB P2 : Ekstrak jahe 0,14 mg/g BB P3 : Ekstrak jahe 0,28 mg/g BB
P4 : Ekstrak jahe 0,14 mg/ gBB setelah 1 jam pemberian Pb asetat 0,1 mg/g BB P5 : Ekstrak jahe 0,28 mg/ gBB setelah 1 jam pemberian Pb asetat 0,1 mg/g BB
x : rata-rata SD : standar deviasi
Tests of Normal ity
.252 4 . .908 4 .474
.298 4 . .813 4 .127
.315 4 . .909 4 .478
.212 4 . .941 4 .659
.376 4 . .752 4 .041
.291 4 . .824 4 .153
Kelompok K P1 P2 P3 P4 P5 MDA
Stat istic df Sig. Stat istic df Sig.
Kolmogorov -Smirnova Shapiro-Wilk
Lillief ors Signif icance Correction a.
Hasil: Selain kelompok P4 (P<0,05) merupakan satu-satunya data yang tidak berdistribusi normal.
Test of Homogeneity of Variance
2.230 5 18 .096
1.514 5 18 .235
1.514 5 7.697 .289
2.139 5 18 .107
Based on Mean Based on Median Based on Median and with adjusted df
Based on t rim med mean MDA
Lev ene
St at ist ic df 1 df 2 Sig.
Hasil: Variansi Data homogen.
3.1 3.0
2.9 2.8
2.7 2.6
2.5 2.4
Level
2.5
2.0
1.5
1.0
0.5
Spread
Slope = 2.092 Power for transformation = -1.092
* Plot of LN of Spread vs LN of Level
Spread vs. Level Plot of MDA by Kelompok
Berarti data kelompok P4 harus ditransformasi. Karena nilai Slope dan Powernya adalah; 2,1 dan -1,1, maka bentuk transformasi datanya adalah: 1/n
Tests of Normality
.238 4 . .908 4 .470
.295 4 . .797 4 .097
.246 4 . .954 4 .740
.196 4 . .974 4 .868
.389 4 . .731 4 .025
.241 4 . .872 4 .304
Kelompok K P1 P2 P3 P4 P5 trans_MDA
Stat istic df Sig. Stat istic df Sig.
Kolmogorov -Smirnova Shapiro-Wilk
Lillief ors Signif icance Correction a.
Test of Homogeneity of Variance
.374 5 18 .860
.400 5 18 .842
.400 5 9.719 .838
.381 5 18 .855
Based on Mean Based on Median Based on Median and with adjusted df
Based on t rim med mean trans_MDA
Lev ene
St at ist ic df 1 df 2 Sig.
Hasil: Data kelompok P4 tetap berdistribusi tidak normal, berarti data di atas dianalisis dengan Uji Non-parametrik “Kruskal Wallis”.
NPar Tests
Kruskal-Wallis Test
Ranks
4 13.25
4 16.75
4 14.00
4 20.00
4 3.75
4 7.25
24 Kelompok
K P1 P2 P3 P4 P5 Total MDA
N Mean Rank
Test Statisticsa,b
14.500 5 .013 Chi-Square
df
Asy mp. Sig.
MDA
Kruskal Wallis Test a.
Grouping Variable: Kelompok b.
Hasil: Ada perbedaan yang nyata (P<0,05) Kadar MDA antara kelompok K, P1 s/d P5.
Maka dilakukan uji lanjut “Mann Whitney” untuk melihat perbedaan antara masing-
masing kelompok perlakuan.
NPar Tests
Mann-Whitney Test
Ranks
4 3.50 14.00
4 5.50 22.00
8 Kelompok
K P1 Total MDA
N Mean Rank Sum of Ranks
Test Statisticsb
4.000 14.000 -1.155 .248 .343a Mann-Whitney U
Wilcoxon W Z
Asy mp. Sig. (2-tailed) Exact Sig. [2*(1-tailed Sig.)]
MDA
Not corrected f or t ies.
a.
Grouping Variable: Kelompok b.
Ranks
4 4.50 18.00
4 4.50 18.00
8 Kelompok
K P2 Total MDA
N Mean Rank Sum of Ranks
Test Statisticsb
8.000 18.000 .000 1.000 1.000a Mann-Whitney U
Wilcoxon W Z
Asy mp. Sig. (2-tailed) Exact Sig. [2*(1-tailed Sig.)]
MDA
Not corrected f or t ies.
a.
Grouping Variable: Kelompok b.
Ranks
4 2.75 11.00
4 6.25 25.00
8 Kelompok
K P3 Total MDA
N Mean Rank Sum of Ranks
Test Statisticsb
1.000 11.000 -2.021 .043 .057a Mann-Whitney U
Wilcoxon W Z
Asy mp. Sig. (2-tailed) Exact Sig. [2*(1-tailed Sig.)]
MDA
Not corrected f or t ies.
a.
Grouping Variable: Kelompok b.
Ranks
4 6.50 26.00
4 2.50 10.00
8 Kelompok
K P4 Total MDA
N Mean Rank Sum of Ranks
Test Statisticsb
.000 10.000 -2.309 .021 .029a Mann-Whitney U
Wilcoxon W Z
Asy mp. Sig. (2-tailed) Exact Sig. [2*(1-tailed Sig.)]
MDA
Not corrected f or t ies.
a.
Grouping Variable: Kelompok b.
Ranks
4 6.00 24.00
4 3.00 12.00
8 Kelompok
K P5 Total MDA
N Mean Rank Sum of Ranks
Test Statisticsb
2.000 12.000 -1.732 .083 .114a Mann-Whitney U
Wilcoxon W Z
Asy mp. Sig. (2-tailed) Exact Sig. [2*(1-tailed Sig.)]
MDA
Not corrected f or t ies.
a.
Grouping Variable: Kelompok b.
Ranks
4 6.00 24.00
4 3.00 12.00
8 Kelompok
P1 P5 Total MDA
N Mean Rank Sum of Ranks
Test Statisticsb
2.000 12.000 -1.732 .083 .114a Mann-Whitney U
Wilcoxon W Z
Asy mp. Sig. (2-tailed) Exact Sig. [2*(1-tailed Sig.)]
MDA
Not corrected f or t ies.
a.
Grouping Variable: Kelompok b.
Ranks
4 5.50 22.00
4 3.50 14.00
8 Kelompok
P2 P5 Total MDA
N Mean Rank Sum of Ranks
Test Statisticsb
4.000 14.000 -1.155 .248 .343a Mann-Whitney U
Wilcoxon W Z
Asy mp. Sig. (2-tailed) Exact Sig. [2*(1-tailed Sig.)]
MDA
Not corrected f or t ies.
a.
Grouping Variable: Kelompok b.
Ranks
4 6.50 26.00
4 2.50 10.00
8 Kelompok
P3 P5 Total MDA
N Mean Rank Sum of Ranks
Test Statisticsb
.000 10.000 -2.309 .021 .029a Mann-Whitney U
Wilcoxon W Z
Asy mp. Sig. (2-tailed) Exact Sig. [2* (1-tailed Sig.)]
MDA
Not corrected f or t ies.
a.
Grouping Variable: Kelompok b.
Ranks
4 3.75 15.00
4 5.25 21.00
8 Kelompok
P4 P5 Total MDA
N Mean Rank Sum of Ranks
Test Statisticsb
5.000 15.000 -.866 .386 .486a Mann-Whitney U
Wilcoxon W Z
Asy mp. Sig. (2-tailed) Exact Sig. [2*(1-tailed Sig.)]
MDA
Not corrected f or t ies.
a.
Grouping Variable: Kelompok b.
Ranks
4 6.50 26.00
4 2.50 10.00
8 Kelompok
P3 P4 Total MDA
N Mean Rank Sum of Ranks
Test Statisticsb
.000 10.000 -2.309 .021 .029a Mann-Whitney U
Wilcoxon W Z
Asy mp. Sig. (2-tailed) Exact Sig. [2* (1-tailed Sig.)]
MDA
Not corrected f or t ies.
a.
Grouping Variable: Kelompok b.
Ranks
4 6.50 26.00
4 2.50 10.00
8 Kelompok
P2 P4 Total MDA
N Mean Rank Sum of Ranks
Test Statisticsb
.000 10.000 -2.309 .021 .029a Mann-Whitney U
Wilcoxon W Z
Asy mp. Sig. (2-tailed) Exact Sig. [2*(1-tailed Sig.)]
MDA
Not corrected f or t ies.
a.
Grouping Variable: Kelompok b.
Ranks
4 6.50 26.00
4 2.50 10.00
8 Kelompok
P1 P4 Total MDA
N Mean Rank Sum of Ranks
Test Statisticsb
.000 10.000 -2.309 .021 .029a Mann-Whitney U
Wilcoxon W Z
Asy mp. Sig. (2-tailed) Exact Sig. [2* (1-tailed Sig.)]
MDA
Not corrected f or t ies.
a.
Grouping Variable: Kelompok b.
Ranks
4 3.25 13.00
4 5.75 23.00
8 Kelompok
P2 P3 Total MDA
N Mean Rank Sum of Ranks
Test Statisticsb
3.000 13.000 -1.443 .149 .200a Mann-Whitney U
Wilcoxon W Z
Asy mp. Sig. (2-tailed) Exact Sig. [2* (1-tailed Sig.)]
MDA
Not corrected f or t ies.
a.
Grouping Variable: Kelompok b.
Ranks
4 4.00 16.00
4 5.00 20.00
8 Kelompok
P1 P3 Total MDA
N Mean Rank Sum of Ranks
Test Statisticsb
6.000 16.000 -.577 .564 .686a Mann-Whitney U
Wilcoxon W Z
Asy mp. Sig. (2-tailed) Exact Sig. [2* (1-tailed Sig.)]
MDA
Not corrected f or t ies.
a.
Grouping Variable: Kelompok b.
Uji beda nyata terkecil antar kelompok perlakuan:
P1 P2 P3 P4 P5
K 0,248 1,000 0,043 0,029 0,114
P1 0,083 0,564 0,021 0,083
P2 0,149 0,021 0,248
P3 0,021 0,021
P4 0,386
Hasil: p<0,05 = berbeda nyata; p>0,05 = tidak berbeda nyata
Mencit K P1 P2 P3 P4 P5
M1 0 0 0,8 0,8 0,4 0,6
M2 0 2,0 0 0,4 0,6 1,0
M3 0 1,8 0 2,2 0,8 1,0
M4 0 1,8 0,8 0,8 0,2 1,0
x
±SD 0,00±0,00 1,40±0,94 0,40±0,46 1,05±0,79 0,50±0,26 0,90±0,20 Keterangan :M1 mencit 1, M2 mencit 2 dan seterusnya.
K : Tween 80 dalam 2%
P1 : Pb asetat 0,1 mg/g BB P2 : Ekstrak jahe 0,14 mg/g BB P3 : Ekstrak jahe 0,28 mg/g BB
P4 : Ekstrak jahe 0,14 mg/ gBB setelah 1 jam pemberian Pb asetat 0,1 mg/g BB P5 : Ekstrak jahe 0,28 mg/ gBB setelah 1 jam pemberian Pb asetat 0,1 mg/g BB
x
: rata-rata, SD = standar deviasiNPar Tests; Kruskal-Wallis Test
Ranks
4 4.00
4 17.50
4 9.50
4 15.88
4 11.00
4 17.13
24 Kelompok
K P1 P2 P3 P4 P5 Total histopatologi
N Mean Rank
Test Statisticsa,b
11.726 5 .039 C hi- Square
df
Asy mp. Sig.
histopatologi
Kr uskal W allis Test a.
Grouping Variable: Kelompok b.
Hasil: ada perbedaan histopatologi antara masing-masing perlakuan (p<0,05). Untuk melihat kelompok perlakuan yang berbeda maka diuji lanjut dengan uji Mann-Whitney.
Mann-Whitney Test
Ranks
4 3.00 12.00
4 6.00 24.00
8 Kelompok
K P1 Total histopatologi
N Mean Rank Sum of Ranks
Test Statisticsb
2.000 12.000 -2.000 .046 .114a Mann-Whitney U
Wilcoxon W Z
Asy mp. Sig. (2-tailed) Exact Sig. [2* (1-tailed Sig.)]
histopatologi
Not corrected f or ties.
a.
Grouping Variable: Kelompok b.
Ranks
4 3.50 14.00
4 5.50 22.00
8 Kelompok
K P2 Total histopatologi
N Mean Rank Sum of Ranks
Test Statisticsb
4.000 14.000 -1.528 .127 .343a Mann-Whitney U
Wilcoxon W Z
Asy mp. Sig. (2-tailed) Exact Sig. [2* (1-tailed Sig.)]
histopatologi
Not corrected f or ties.
a.
Grouping Variable: Kelompok b.
Mann-Whitney Test
Ranks
4 2.50 10.00
4 6.50 26.00
8 Kelompok
K P3 Total histopatologi
N Mean Rank Sum of Ranks
Dewasa (lanjutan)
Test Statisticsb
.000 10.000 -2.477 .013 .029a Mann-Whitney U
Wilcoxon W Z
Asy mp. Sig. (2-tailed) Exact Sig. [2* (1-tailed Sig.)]
histopatologi
Not corrected f or ties.
a.
Grouping Variable: Kelompok b.
Mann-Whitney Test
Ranks
4 2.50 10.00
4 6.50 26.00
8 Kelompok
K P4 Total histopatologi
N Mean Rank Sum of Ranks
Test Statisticsb
.000 10.000 -2.460 .014 .029a Mann-Whitney U
Wilcoxon W Z
Asy mp. Sig. (2-tailed) Exact Sig. [2*(1-tailed Sig.)]
histopatologi
Not corrected f or ties.
a.
Grouping Variable: Kelompok b.
Mann-Whitney Test
Ranks
4 2.50 10.00
4 6.50 26.00
8 Kelompok
K P5 Total histopatologi
N Mean Rank Sum of Ranks
Test Statisticsb
.000 10.000 -2.530 .011 .029a Mann-Whitney U
Wilcoxon W Z
Asy mp. Sig. (2-tailed) Exact Sig. [2* (1-tailed Sig.)]
histopatologi
Not corrected f or ties.
a.
Grouping Variable: Kelompok b.
Mann-Whitney Test
Ranks
4 5.75 23.00
4 3.25 13.00
8 Kelompok
P1 P2 Total histopatologi
N Mean Rank Sum of Ranks
Test Statisticsb
3.000 13.000 -1.498 .134 .200a Mann-Whitney U
Wilcoxon W Z
Asy mp. Sig. (2-tailed) Exact Sig. [2* (1-tailed Sig.)]
histopatologi
Not corrected f or ties.
a.
Grouping Variable: Kelompok b.
Mann-Whitney Test
Ranks
4 5.50 22.00
4 3.50 14.00
8 Kelompok
P1 P4 Total histopatologi
N Mean Rank Sum of Ranks
Test Statisticsb
4.000 14.000 -1.162 .245 .343a Mann-Whitney U
Wilcoxon W Z
Asy mp. Sig. (2-tailed) Exact Sig. [2*(1-tailed Sig.)]
histopatologi
Not corrected f or ties.
a.
Grouping Variable: Kelompok b.
Ranks
4 5.50 22.00
4 3.50 14.00
8 Kelompok
P1 P5 Total histopatologi
N Mean Rank Sum of Ranks
Test Statisticsb
4.000 14.000 -1.191 .234 .343a Mann-Whitney U
Wilcoxon W Z
Asy mp. Sig. (2-tailed) Exact Sig. [2* (1-tailed Sig.)]
histopatologi
Not corrected f or ties.
a.
Grouping Variable: Kelompok b.
Ranks
4 3.50 14.00
4 5.50 22.00
8 Kelompok
P2 P3 Total histopatologi
N Mean Rank Sum of Ranks
Test Statisticsb
4.000 14.000 -1.239 .215 .343a Mann-Whitney U
Wilcoxon W Z
Asy mp. Sig. (2-tailed) Exact Sig. [2*(1-tailed Sig.)]
histopatologi
Not corrected f or ties.
a.
Grouping Variable: Kelompok b.
Mann-Whitney Test
Ranks
4 4.25 17.00
4 4.75 19.00
8 Kelompok
P2 P4 Total histopatologi
N Mean Rank Sum of Ranks
Test Statisticsb
7.000 17.000 -.298 .766 .886a Mann-Whitney U
Wilcoxon W Z
Asy mp. Sig. (2-tailed) Exact Sig. [2* (1-tailed Sig.)]
histopatologi
Not corrected f or ties.
a.
Grouping Variable: Kelompok b.
Ranks
4 3.00 12.00
4 6.00 24.00
8 Kelompok
P2 P5 Total histopatologi
N Mean Rank Sum of Ranks
Test Statisticsb
2.000 12.000 -1.797 .072 .114a Mann-Whitney U
Wilcoxon W Z
Asy mp. Sig. (2-tailed) Exact Sig. [2* (1-tailed Sig.)]
histopatologi
Not corrected f or ties.
a.
Grouping Variable: Kelompok b.
Ranks
4 4.00 16.00
4 5.00 20.00
8 Kelompok
P3 P5 Total histopatologi
N Mean Rank Sum of Ranks
Test Statisticsb
6.000 16.000 -.595 .552 .686a Mann-Whitney U
Wilcoxon W Z
Asy mp. Sig. (2-tailed) Exact Sig. [2* (1-tailed Sig.)]
histopatologi
Not corrected f or ties.
a.
Grouping Variable: Kelompok b.
Ranks
4 2.88 11.50
4 6.13 24.50
8 Kelompok
P4 P5 Total histopatologi
N Mean Rank Sum of Ranks
Test Statisticsb
1.500 11.500 -1.935 .053 .057a Mann-Whitney U
Wilcoxon W Z
Asy mp. Sig. (2-tailed) Exact Sig. [2* (1-tailed Sig.)]
histopatologi
Not corrected f or ties.
a.
Grouping Variable: Kelompok b.
Uji beda nyata terkecil antar perlakuan
P1 P2 P3 P4 P5
K 0,046 0,127 0,013 0,014 0,011
P1 0,134 0,770 0,245 0,234
P2 0,215 0,766 0,072
P3 0,180 0,552
P4 0,053
Hasil: p<0,05 = berbeda nyata; p>0,05 = tidak berbeda nyata
Nonparametric Correlations
Correlations
1.000 .199
. .196
24 24
.199 1.000
.196 .
24 24
Correlation Coef f icient Sig. (2-tailed)
N
Correlation Coef f icient Sig. (2-tailed)
N MDA
histopatologi Kendall's tau_b
MDA histopatologi
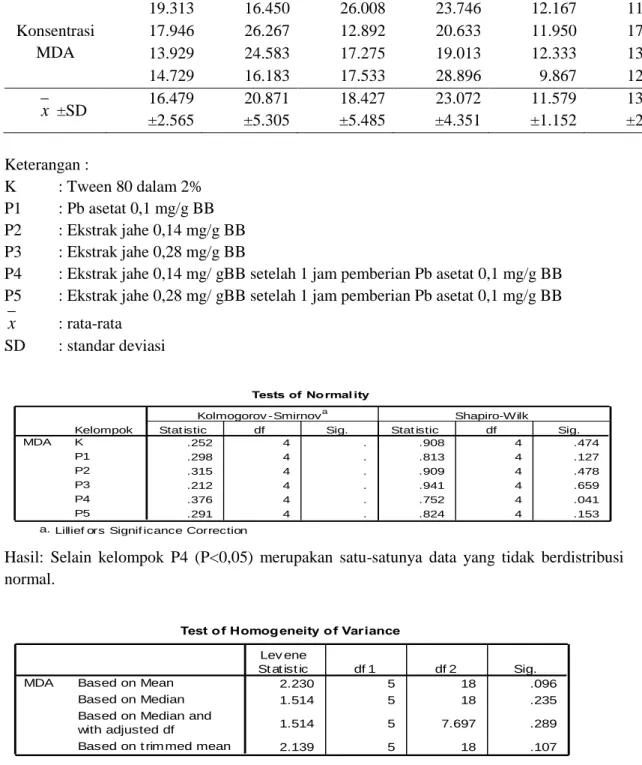
![Gambar 13. Kelompok P2,M4 (1) : (a) Degenerasi hidrophilik, dengan perubahan sel dan inti yang membengkak [Tanda panah] (HE – 400 X)](https://thumb-ap.123doks.com/thumbv2/123dok/3601725.3877320/26.918.216.803.220.542/gambar-kelompok-degenerasi-hidrophilik-perubahan-membengkak-tanda-panah.webp)
