SUB THEME: EDUCATION
AN ANALYSIS ITEM OF FINAL EXAMINATION OF ECONOMIC
SUBJECT OF SENIOR HIGH SCHOOL IN YOGYAKARTA CITY
USING RASCH MODEL
Fitri Alfarisa1, Eka Ary Wibawa1 1Yogyakarta State University, Indonesia
Email: [email protected]
Abstract
This research aims to analyze and describe the items characteristic of final semester examination of economics subject of senior high school in Yogyakarta using Rasch Model. This research is a quantitative research. The object of this research was the students response of final semester examination of economics subject with totaling 3540 students. The sample of this research was determined by using stratified proportional random sampling with totaling 455 students response/ Uhe data were collected by using documentation technique. The data analysis of this research using Winsteps Software. The results of the research show that the reliability of instruments is 0.77. According to OUTFIT MNSQ, upper limit shows 1,52 while the lower limit shows 0,78, with 39 items describe as model fit. Test difficulty scores between -2,49 to 1,63. The maximum information from the test scores 20,41 logit at the ability around 0,1 with the error measurement test in the amount of 0,21.
Keywords:final semester examination, economics subject, rasch model.
INTRODUCTION
The quality of education is closely related to the quality of human resource. Quality human resource could result from quality education. UN (Ujian NasionalOational Fxamination* is one of the efforts that the government makes in the course of accelerating quality improvement in education. From data obtained from Puspendik (Pusat Penilaian Pendidikan Denter of Fducational Fvaluation*- it is known that the average grade of TNB )Sekolah Menengah Atassenior high school* students for the school subject of Fconomics in the city of Yogyakarta in the school year of 2014/2015 was 5.80. It has caused quite a concern in all related parties. In view of the importance of education, it is felt that the government needs to improve the quality of economics education.
students so that they could record the economic events occurring in their surroundings and take benefit from them for betterment in their life. Uhe students learned abilitiescould be viewed through the evaluation system used by the teacher in the process of learning conducted at school
The system of evaluation and the quality of learning are two interrelated matters. A good learning system would result in a good learning quality (Djemari Mardapi, 2012: 12). The evaluation is intended not only to let one know whether the predetermined objectives are attained or not but also to let one know whether the objectives are important for the students and how they attain them. Results of studies indicate that up to 87% of teachers still experience difficulty in understanding the ways to conduct evaluation (Rusilowati, 2013). Insufficient dissemination of the steps in conducting evaluation becomes one of the constraints.
Good evaluation could be done by means of gathering accurate evidence related to
students learning achievement andit makes the classroom evaluation process and its results beneficial for students by being able to improve their learning motivation and achievement (Stiggins & Chappuis, 2012: 3). A test is one of the ways to indirectly estimate how great
the degree of human ability is by going through ones response to a number of stimuli or
questions (Djemari Mardapi, 2008: 67). A test of good quality has item and test characteristics that are also good.
A test results in information of the characteristics of an individual or a group (Harun Rasyid & Mansur, 2008: 11). Therefore, in order that accurate information is obtained, a reliable test is needed. The evaluation through the technique of giving a teacher-made test at present is not yet adequate. It is known from the results of interviews with several SMA teachers of the school subject of Economics in the city of Yogyakarta. According to them, teacher-made tests do not yet undergo any empirical testing of either the classical or modern type so that the results of their use are not yet able to represent the real ability of students.
Item analysis could be done in classical and modern ways. Hambleton & Swaminathan (1985: 1-3) also state several weaknesses of classical test theory, which are, among others, (1) the item difficulty and discrimination index depend on the group of test participants doing the test, (2) test analysis is done by comparing student ability in the upper, middle, and lower groups, (3) the concept of score reliability is defined by starting from the term of parallel tests, (4) there is no theoretical basis for the purpose of determining how test participants get a test that is appropriate for the ability of the participants concerned, and (5) the same SEM (standard error of measurement) applies on all the test participants.
one-parameter logistic model (Wright & Stone, 1979: x). A simple and accurate idea
obtained by observing the results of primary school students examinations in the 2;61s has
brought Georg Rasch to a new finding, namely, that the probability for a student to answer
an item correctly is the same as that when the students ability is compared with item difficulty (Sumintono & Widhiarso, 2015).
In the Rasch model, a person is given the characteristic of latent ability and an item is given the characteristic of difficulty. The probability for a person to answer an item correctly is a function of a comparison between the persons ability and item difficulty/ Jn working with the Rasch model, it is assumed that item difficulty is the only item characteristic influencing test performance. In addition, in the Rasch model, the matter of item selection for the construction of a test is an effort to design a test with quality suiting the needs and aims of the testing (Bambang & Wahyu, 2015).
RESEARCH METHOD
The research concerned here was descriptive research with a quantitative approach. The research subjects were SMA students in the city of Yogyakarta with the response of the students in Grade X (the term used to call the last grade of SMA) to the school subject of Economics in UAS as basis. The schools concerned in the research were those using KTSP (Kurikulum Tingkat Satuan Pendidikan Fducational-Unit Level Curriculum or
School-Cased Durriculum* for the reason that the majority of schools in the city of Zogyakarta still
used it.
The sample was determined by using the technique of proportional random sampling. The schools concerned were determined by grouping them into three categories, namely, the high, medium, and low categories. The grouping into these categories was based on the mean score in UN for the school subject of Economics in the academic year of 2014/2015. The
schools of the high category were with the mean score in VO 6/98- those of the medium
category were with the mean score in UN ranging from 4.11 to 5.86, and those of the low category were with the mean score in UN < 4.1. The research subjects were sampled by
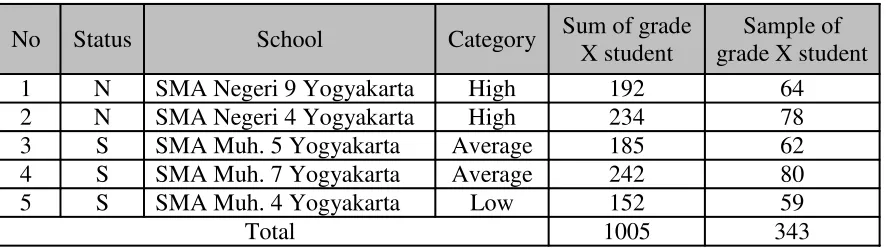
using Jsaacs ' Nichaels tableas basis with a degree of confidence of 95% and 343 students were selected as sample.The sample of students is presented as follows in Table 1.
Table 1. The Sample of Reseach
No Status School Category Sum of grade
X student
Sample of grade X student
1 N SMA Negeri 9 Yogyakarta High 192 64
2 N SMA Negeri 4 Yogyakarta High 234 78
3 S SMA Muh. 5 Yogyakarta Average 185 62
4 S SMA Muh. 7 Yogyakarta Average 242 80
5 S SMA Muh. 4 Yogyakarta Low 152 59
The variable under study was student ability as seen from the results of UAS for the school subject of Economics. The data were collected by using a dichotomous test. A dichotomous test of the multiple choice model was used because that form was considered
more objective and reliable in viewing students response- not being under the influence of the scorers subjectivity/ Uhe VBT test instrument consisted of forty test items with each
item having five answer choices.
Content validity testing was used on the test instrument of the research. Content validity of the test instrument was considerably emphasized so that the validity testing was done in two ways, meaning that after a qualitative review was done, its results were processed by means of the Aiken formula using V. The qualitative review is commonly
based on experts judgment with the review criteria based on aspects of test material-
construction, and language (Badrun Kartowagiran, 2012). The qualitative review was done by five experts consisting of three practitioners who were SMA economics teachers with experience and competence in their field, one university teacher of economics, and one university teacher who was an expert in measurement and evaluation.
As result of the test of validity, it was found that all items of UAS on Economics were already valid. It was known from the the average V value of 0.91. In line with that, Aiken (1985: 134) informs that the V value for each item said to be good is at least 0.87 when five raters are employed with four scale categories. An estimation of test reliability using KR-20 showed that the coefficient of instrument reliability was 0.84. It indicated that the test instrument reliability was already good by having a coefficient of reliability greater than 0.70 (in line with Linn, 1989: 106). An item analysis using the data obtained by means of the instrument for UAS of the school subject of Economics was done through the IRT approach of the Rasch model with the aid of the Winstep computer software program.
RESEARCH RESULTS AND DISCUSSION
This section about the research results concerns the characteristic given to items, namely, item difficulty, in relation with the test items for the school subject of Economics, based on IRT with the Rasch model approach.According to the approach to IRT used, IRT assumption testing needed to be done. It consisted of unidimensionality assumption testing, local independence assumption testing, and parameter invariance assumption testing.
Unidimensionality Assumption Testing
The testing of the unidimensionality assumption was done with factor analysis. The factor analysis results first checked were of KMO MSA (Kaiser-Meyer-Olkin measure of sampling
adequacy* and Cartletts test of sphericity/ Jn Uable 3- it is seen that the value of KMO MSA of the test instrument of UAS for the school subject of Economics in Grade X was 0.656 and
the level of significance according to Cartletts sphericity test was 1/111/ Cased on those
test of sphericity < 0.05, it means that the test fulfilled the requirements for processing by using factor analysis.
Table 2. KMO and Bartlett's Test Grade X
Kaiser-Meyer-Olkin Measure of Sampling Adequacy. .656
Bartlett's Test of Sphericity
Approx. Chi-Square 3.553.890
Df 780
Sig. .000
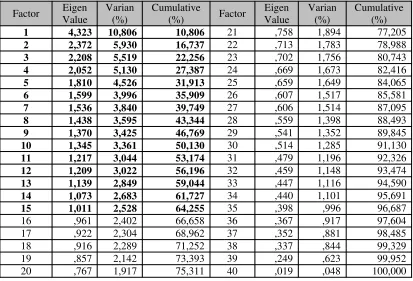
Hambleton & Swaminathan (1985: 16) state that the unidimensionality is fulfilled if the test is proven to measure only one dominant dimension, namely, the same ability. This requirement for unidimensionality could be seen in the column of the obtained eigenvalue of the test instrument presented in Table 3.
Table 3. Eigen Value of Economics Test for Grade X
Factor Eigen
1 4,323 10,806 10,806 21 ,758 1,894 77,205
2 2,372 5,930 16,737 22 ,713 1,783 78,988
3 2,208 5,519 22,256 23 ,702 1,756 80,743
4 2,052 5,130 27,387 24 ,669 1,673 82,416
5 1,810 4,526 31,913 25 ,659 1,649 84,065
6 1,599 3,996 35,909 26 ,607 1,517 85,581
7 1,536 3,840 39,749 27 ,606 1,514 87,095
8 1,438 3,595 43,344 28 ,559 1,398 88,493
9 1,370 3,425 46,769 29 ,541 1,352 89,845
10 1,345 3,361 50,130 30 ,514 1,285 91,130
11 1,217 3,044 53,174 31 ,479 1,196 92,326
12 1,209 3,022 56,196 32 ,459 1,148 93,474
13 1,139 2,849 59,044 33 ,447 1,116 94,590
14 1,073 2,683 61,727 34 ,440 1,101 95,691
15 1,011 2,528 64,255 35 ,398 ,996 96,687
16 ,961 2,402 66,658 36 ,367 ,917 97,604
17 ,922 2,304 68,962 37 ,352 ,881 98,485
18 ,916 2,289 71,252 38 ,337 ,844 99,329
19 ,857 2,142 73,393 39 ,249 ,623 99,952
20 ,767 1,917 75,311 40 ,019 ,048 100,000
A factor having an eigenvalue > 1.00 is one that could be used as indicator of what is here called a trait (Wagiran, 2014: 302).The factor analysis results in Table 3 indicate that there are fifteen components having eigenvalues > 1.00 so that it is said that the forty test instrument items could form fifteen factors. The analysis results also indicated that Factor 1 was the dominant factor because the eigenvalue related to it was 4.323, which was the largest, and, therefore, in a way, the most dominant, among the eigenvalues.
plot in Figure 1 reinforces the conclusion that the test instrument of Economics in Grade X had the quality of being unidimensional.
Figure 1. Scree Plot Eigen Value of Economic Test for Grade X
Local Independence Assumption Testing
The testing of the local independence assumption could be viewed based on test taker ability in responding to items. Local independence of test participant response to an item has the meaning that however correctly or incorrectly a test participant answers an item is not affected by however correctly or incorrectly other test participants answer the item. Local independence of test participant response to an item also has the meaning that however correctly or incorrectly a test participant answers an item is not affected by however correctly or incorrectly the test participant answers other items.
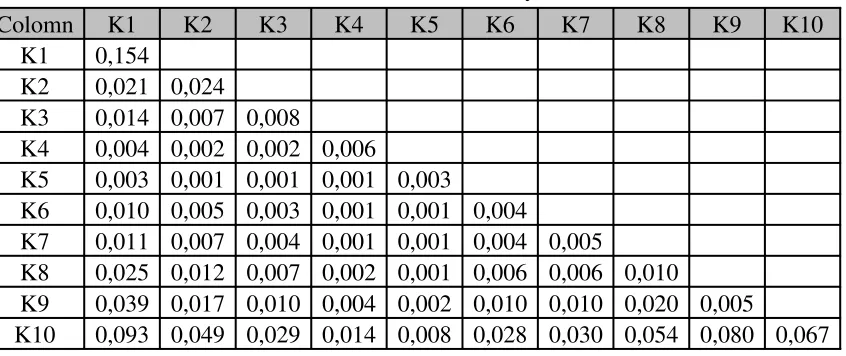
The local independence is automatically fulfilled after being proven by means of unidimensionality and test takers response to a test )Ieri Setnawati- 3125< 8*/ Cesides- the local independence assumption testing could be calculated by using a covariance matrix based on student ability in each test instrument tested (Greiff et al., 2013: 8). As for the covariance matrix, it is presented in Table 4.
Table 4. Matriks Covarian Based on the ability of Grade X Students
Colomn K1 K2 K3 K4 K5 K6 K7 K8 K9 K10
K1 0,154
K2 0,021 0,024
K3 0,014 0,007 0,008
K4 0,004 0,002 0,002 0,006
K5 0,003 0,001 0,001 0,001 0,003
K6 0,010 0,005 0,003 0,001 0,001 0,004
K7 0,011 0,007 0,004 0,001 0,001 0,004 0,005
K8 0,025 0,012 0,007 0,002 0,001 0,006 0,006 0,010
K9 0,039 0,017 0,010 0,004 0,002 0,010 0,010 0,020 0,005
According to Table 4, it is known that the value of covariance of each ability group of students in Grade X approaches zero. It is interpreted to mean that the local independence is fulfilled. It is in line with Hambleton & Swaminathan (1984: 25) stating that if the value of covariance of a student ability group approaches zero, the local independence assumption testing proves that the assumption is true.
Parameter Invariance Assumption Testing
The testing of the parameter invariance assumption involves that of item parameter invariance and that of ability parameter invariance. The item parameter invariance testing is done to know the consistence in the characteristic of an item when it is responded to by different student groups. Similarly, the ability parameter invariance testing is done to know
the consistence in a test takers ability when responding to different items/ Uhe testing of
item and ability parameter invariance could be done by using scree plots.
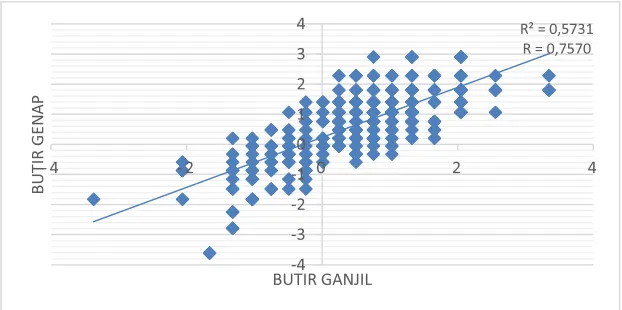
Figure 2. Scree Plot Invariance of the Level Difficulty Items Parameter for Grade X
Gigure 4/ Tcree Qlot Jnvariance of the Ttudents Bbility Qarameter for Hrade Y
Figures 2 and 3 present the scree plots of the invariance estimates of the item difficulty and student ability parameters after doing odd and even numbered economics test items. Figures 2 and 3 show that on the whole the plots scatter and approach a diagonal line. The calculations of the correlation involving item difficulty and student response to even
and odd numbered items resulted in a value of 0.9817, which, according to Best & Kahn (1998: 372), indicates a very high level of correlation. Meanwhile, the calculations of the correlation involving student ability and student response to even and odd numbered items resulted in a value of 0.7570, which, according to Best & Kahn (1998: 372), indicates a high level of correlation. Based on the scree plots and the correlation calculations, it could be concluded that the parameters of item difficulty and Grade-X student ability had the quality of being invariant.
Item Fit Model
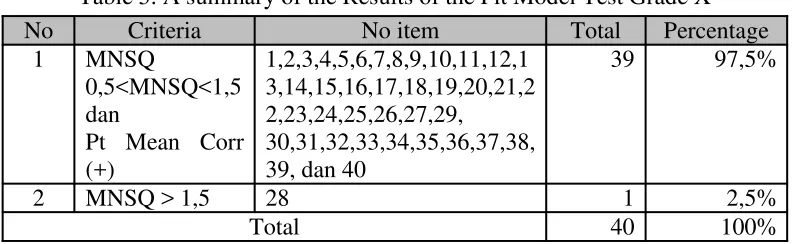
A test item with good fit behaves consistently as expected by the model. The test item said to have good fit is one with 0.5 < MNSQ < 1.5 (where MNSQ refers to outfit mean square) and the value indicating point-measure correlation (Pt Measur Corr) is not negative (Bambang & Wahyu, 2015: 72). A summary of the results of analysis about fit model is presented in Table 5.
Table 5. A summary of the Results of the Fit Model Test Grade X
No Criteria No item Total Percentage
1 MNSQ
With the analysis by means of the Winstep program, thirty-nine (97.5%) of the forty items analyzed were found fitting the model and one (2.5%) of them, namely, Item No 28, was found otherwise. Further, in the Rasch model, estimates of item difficulty of the UAS instrument for the school subject of Economics in Grade X could be known.
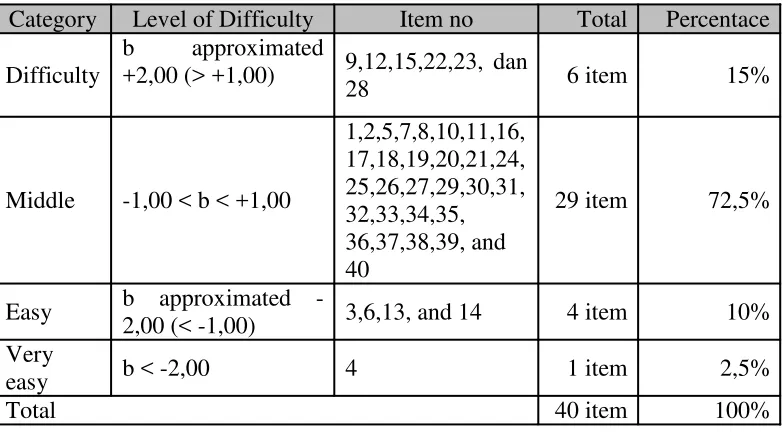
Test Item Difficulty Parameter
Based on the Rasch (or 1PL) model, the item characteristic that could be viewed was item difficulty with item power of discrimination assumed to be constant. The criteria for item difficulty were divided into five categories, namely, those of very easy, easy, medium, difficult, and very difficult items. The values for item difficulty of the UAS test instrument for Economics in Grade X were distributed within the range from -2.00 to +2.00. An item was categorized as an easy item when its b value was down near -2.00 logit, a difficult item when its b value was up near +2.00 logit, and a medium item when -1.00 logit < b < +1.00 logit while an item with a value of b > +2.00 logit fell into the category of very difficult items and that with a value of b < -2.00 logit fell into the category of very easy items.
logit, and the only item falling into the category of very easy items was Item No. 4 with a b value of -2.49 logit. All the items other than Item No. 4 fell into the categories of either easy, medium, or difficult items. The categorization of the UAS test items for Economics in Grade X according to item difficulty and its summary are presented in Tables 6 and 7.
Table 6. The categorization of Level Difficulty Items of Economic Test Item
no
Level of difficulty
(logit) Category
Item
no Level of difficulty (logit) Category
1 0.31 Middle 21 0.08 Middle
2 0.4 Middle 22 1.04 Difficult
3 -1.89 Easy 23 1.37 Difficult
4 -2.49 Very Easy 24 0.56 Middle
5 -0.54 Middle 25 0.72 Middle
6 -1.62 Easy 26 -0.48 Middle
7 0.7 Middle 27 -0.49 Middle
8 -0.34 Middle 28 1.58 Difficult
9 1.27 Difficult 29 0.39 Middle
10 -0.97 Middle 30 -0.44 Middle
11 0.96 Middle 31 -0.65 Middle
12 1.63 Difficult 32 -0.2 Middle
13 -1.13 Middle 33 -0.22 Middle
14 -1.43 Middle 34 0.34 Middle
15 1.06 Difficult 35 -0.41 Middle
16 0.08 Middle 36 -0.25 Middle
17 -0.78 Middle 37 0.47 Middle
18 -0.02 Middle 38 0.31 Middle
19 0.58 Middle 39 -0.01 Middle
20 -0.02 Sedang 40 0.53 Sedang
Table 7. A summary of Characteristic Level Difficulty Items of Economics Test
Category Level of Difficulty Item no Total Percentace
In the Grade-X Economics UAS test instrument, after undergoing testing and analysis, of forty items, six, namely, Items no 9, 12, 15, 22, 23, and 28, fell into the category of difficult items, twenty-nine, namely, Items No. 1, 2, 5, 7, 8, 10, 11, 16, 17, 18, 19, 20, 21, 24, 25, 26, 27, 29, 30, 31, 32, 33, 34, 35, 36, 37, 38, 39, and 40, fell into the category of medium items, four, namely, Items No. 3, 6, 13, and 14, fell into the category of easy items, and, as previously mentioned, one, namely, No. 4, fell into the category of very easy items. The average value for the Grade-X Economics test instrument item difficulty was 0.00 logit (indicating a medium category) with a standard deviation value of 0.92 logit. The characteristic of the Grade-X Economics UAS items is also presented in ICC (Item Characteristic Curve) form in Figure 4.
Figure 4. ICC of economics test for grade X
Figure 4 presents the ICC of Economics test for grade X. The ICC portrays the
relation between students ability and their probability of their answering correctly. The increasingly rightward direction that one takes as one goes along the curve from its beginning indicates that the ability possessed by students is increasingly higher in level so that their probability of answering correctly is also increasingly higher in level and vice versa. From Figure 4 it is known that Item No. 12 was the item in the Grade-X Economics UAS instrument with the highest level of difficulty while Item N. 4 was the item in the said instrument with the lowest level of difficulty.
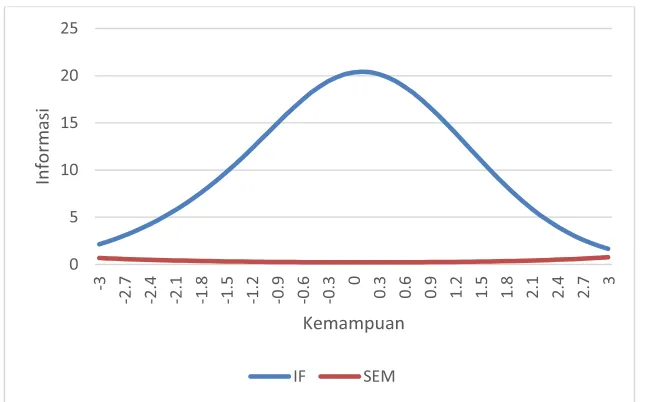
Information Function
Error of Measurement) and the information function are inversely proportional to each other quadratically, with the greater the information function, the smaller the SEM and vice versa. The graph showing the relation between item information function and SEM is presented in Figure 5 as follows.
Figure 5. The correlation of the Information Function and SEM of Economics Test
Figure 5 describes that the maximum value of the information function of a Grade-X Economics test with forty items is31/5213 with ¦ of around 1/2 logit and TFN of 1/3324/ It indicates that the economics test in Grade X gave good information with minimum error of measurement when done by students with the ability of around 0.1 logit in value.
CONCLUSION AND SUGGESTION
It is concluded that the average item difficulty of UAS for the school subject of Economics in Grade X is medium in level. It is supported by the maximum information function obtained for Hrade Y of 31/5213 logit in value with ¦ of around 1/2 and TFN of 1/3323. Based on the conclusion, it is suggested that (1) teachers of economics at SMA make use of the results of the UAS item analysis in making a bank of items for tests and examinations and (2) principals of the schools concerned be more aware of the importance of conducting evaluation correctly and, therefore, make efforts to facilitate item analysis training for the teachers.
REFERENCES
Aiken, L. R. (1985). Three coefficients for analyzing the reliability and validity of ratings. Journal of Educational and Psychological Measurement.Vol (45). 134
Sumintono, B. & Wahyu W. (2015). Aplikasi permodelan RASCH pada assessment pendidikan. Cimahi: Trim Komunikata
Best, J.W & Kahn, J.V. (1998).Reseach in education 8thedition. London: Allyn & Bacon
Mardapi, D. (2008). Teknik penyusunan instrumen tes dan non tes. Yogyakarta: Mitra Cendekia Offset
Mardapi, D. (2012). Pengukuran, penilaian dan evaluasi pendidikan. Yogyakarta: Nuha Litera
Furr, R. M. & Bacharach, V. R. (2008). Psychometrics an introduction. Thousand Oaks: Sage Publications, Inc
Greiff, S. et al. (2013). Complex problem solving in educational contexts (Something beyond: concept, assessment, measurement invariance, and construct validity). Journal of Educational Psychology, 18, p. 1-15.
Hambleton R.K. & Swaminathan H., (1985). Items response theory: principles and application.Boston: Kluwer-Nijjhoff Publish.
Harun Rasyid & Mansur. (2008).Penilaian hasil belajar. Bandung: CV Wacana Prima
Retnawati, H. (2014).Teori Respon Butir dan Aplikasinya. Yogyakarta: Nuha Medika
Linacre, J.M. (1994). Sample size and item calibration stability [elektronik vertion].Rasch Measurement Transaction, 7 (4). 328.
Pusat Penilaian Pendidikan. (2014). Laporan pengolahan un tahun ajaran 2014/2015. Jakarta: Puspendik (Tidak diterbitkan)
Republik Indonesia. (2005).Undang-undang no. 14 Tahun 2005 tentang Guru dan Dosen
Rusilowati. (2013). Kurikulum 2013, 87 persen guru kesulitan cara penilaian. (Online). Diambil pada tanggal 6 Januari 2016 (http://unnes.ac.id)
Stiggins, R.J. & Chappuis, J. (2012). An introduction to student involved assessment for learning (6thed.). Boston: Pearson
Wagiran. (2014). Metodologi penelitian pendidikan (teori dan implementasi).Yogyakarta: Depublish