Microsoft
Office
PerformancePoint
Server 2007
Elaine Andersen
Bruno Aziza
Joey Fitts
Steve Hoberecht
Tim Kashani
PerformancePoint
Server 2007
Elaine Andersen
Bruno Aziza
Joey Fitts
Steve Hoberecht
Tim Kashani
Published by
Wiley Publishing, Inc.
10475 Crosspoint Boulevard Indianapolis, IN 46256 www.wiley.com
Copyright2008 by Wiley Publishing, Inc., Indianapolis, Indiana
Published simultaneously in Canada ISBN: 978-0-470-22907-1
Manufactured in the United States of America 10 9 8 7 6 5 4 3 2 1
No part of this publication may be reproduced, stored in a retrieval system or transmitted in any form or by any means, electronic, mechanical, photocopying, recording, scanning or otherwise, except as permitted under Sections 107 or 108 of the 1976 United States Copyright Act, without either the prior written permission of the Publisher, or authorization through payment of the appropriate per-copy fee to the Copyright Clearance Center, 222 Rosewood Drive, Danvers, MA 01923, (978) 750-8400, fax (978) 646-8600. Requests to the Publisher for permission should be addressed to the Legal Department, Wiley Publishing, Inc., 10475 Crosspoint Blvd., Indianapolis, IN 46256, (317) 572-3447, fax (317) 572-4355, or online at www.wiley.com/go/permissions.
Limit of Liability/Disclaimer of Warranty:The publisher and the author make no representations or warranties with respect to the accuracy or completeness of the contents of this work and specifically disclaim all warranties, including without limitation warranties of fitness for a particular purpose. No warranty may be created or extended by sales or promotional materials. The advice and strategies contained herein may not be suitable for every situation. This work is sold with the understanding that the publisher is not engaged in rendering legal, accounting, or other professional services. If professional assistance is required, the services of a competent professional person should be sought. Neither the publisher nor the author shall be liable for damages arising herefrom. The fact that an organization or Website is referred to in this work as a citation and/or a potential source of further information does not mean that the author or the publisher endorses the information the organization or Website may provide or recommendations it may make. Further, readers should be aware that Internet Websites listed in this work may have changed or disappeared between when this work was written and when it is read.
For general information on our other products and services or to obtain technical support, please contact our Customer Care Department within the U.S. at (800) 762-2974, outside the U.S. at (317) 572-3993, or fax (317) 572-4002.
Library of Congress Cataloging-in-Publication Data
Microsoft Office PerformancePoint server 2007 / Elaine Andersen. . .[et al.].
p. cm. Includes index.
ISBN 978-0-470-22907-1 (paper/website)
1. Microsoft PerformancePoint server. 2. Performance — Management — Computer programs. 3. Business — Computer programs. I. Andersen, Elaine,
1971-HF5548.4.M5257M53 2008 658.500285’55 — dc22
2008026306 Microsoft product screen shots reprinted with permission from Microsoft Corporation.
Trademarks:Wiley, the Wiley logo, and related trade dress are trademarks or registered trademarks of John Wiley & Sons, Inc. and/or its affiliates, in the United States and other countries, and may not be used without written permission. Microsoft and PerformancePoint are trademarks or registered trademarks of Microsoft Corporation in the United States and/or other countries. All other trademarks are the property of their respective owners. Wiley Publishing, Inc., is not associated with any product or vendor mentioned in this book.
Frederic, Jodi, Greg, Emily, Aidan, and Mason. You’re what makes it all worthwhile.
— Elaine Andersen
`A Mamie, Papy Jo et Maman, `a ma femme et mes enfants — merci de votre soutien constant et de votre amour inconditionnel.
— Bruno Aziza
First — to my wife Juliana and daughter Sophia, te amo muito! As always, to my family — Dad, Mom, Bob, and John — my love and deep appreciation for your continued support! I’d also like to thank my dear friends who have inspired me to take on bigger challenges and also to be a better person. Loke, Jake, Bruno, Ben, Eric, Brandy, John, Michele, Mikey, Paulo, Anderson, Maria Eliza, and the numerous friends who
brighten my life — I have benefited from knowing such genuinely good-hearted and fun people. My time with close friends is precious, and
I hope you know how much it means to me. Thank you! — Joey Fitts
To my wife, Jannette, without whom I wouldn’t have the
support and foundation to challenge myself. To my wonderful children, Katie and Henry, who ensure there are never any dull moments. To my parents, Clint and Donna, sister, Lani, and brother, Randy, from whom I get nothing but support and encouragement. To all my colleagues on the
PerformancePoint team who continue to inspire me by your passion and dedication to the product. I am grateful to work with such a talented team.
— Steve Hoberecht
To my loving wife Pamela and laughing son Timothy, who remind me daily that some things go way beyond anything we can plan,
monitor, and analyze.
Elaine Andersenis a senior program manager lead on the Microsoft Office PerformancePoint Server team at Microsoft. For the past two years, she has focused on the analytic and dashboard features of PerformancePoint, working with an experienced and talented team of program managers, developers, and test engineers.
Prior to joining Microsoft, Elaine was a program manager for ProClar-ity Corporation, a software company that developed business intelligence (BI) products for the Microsoft platform. During her 6 years at ProClarity, Elaine contributed to the ProClarity Desktop Professional, ProClarity Ana-lytics Server, and ProClarity Live Server product lines as both a program manager and technical writer.
Elaine holds a master of arts degree in Technical Communication from Boise State University in Boise, Idaho, and a bachelor of arts degree in English from Brigham Young University in Provo, Utah.
Bruno Aziza has led marketing, sales, and operations teams at various technology firms, including Apple, Business Objects, and Decathlon. Bruno has worked and lived in France, the UK, Germany, and the United States, and holds a master’s degree in business and economics from three European institutions.
He currently works on Microsoft’s global business intelligence strategy and is the coauthor ofDrive Business Performance: Enabling a Culture of Intelligent Execution.
Joey Fitts has consulted at over 25 of the Fortune 500 companies, guest lectured in Harvard’s Executive Education programs, raised over $16 million in venture capital, and served on the board of advisors for InterVivos and the Computer Technology Industry Association (CompTIA).
He currently works on Microsoft’s global business intelligence strategy and is the coauthor of Drive Business Performance: Enabling a Culture of Intelligent Execution.
Steve Hoberechtis a senior program manager lead on the Microsoft Office PerformancePoint Server team at Microsoft. He is responsible for the features and functionality of the application components targeted towards planning, reporting, and consolidation scenarios. Steve also supports the development and deployment activities of early adopter customers and partners.
Steve has been with Microsoft for 15 years and has occupied roles from finance to software quality to program management. Prior to his current role, he was test manager for data access components in Microsoft SQL Server. Steve began his career at Microsoft in the finance organization, where he occupied a variety of roles in accounting, operations, management reporting, and analysis.
Steve attended the University of Arizona and holds a bachelor of science degree in computer science from Seattle Pacific University.
Tim Kashani is the founder and CEO of IT Mentors, a Microsoft Gold Certified Partner. The company is a leading provider of technology consulting, custom training services, and learning content production. Tim and his team of technical professionals help organizations understand and apply Microsoft technology with the goal of increasing business productivity.
Tim was one of the first Microsoft Certified Trainers in the world. He also holds a bachelor of sciences degree in information and computer sciences and a master’s degree in business administration from the University of California at Irvine. Tim’s 22 years of experience in the training and consulting field have taken him to clients all over the world, including Asia, Europe, and many parts of the United States.
Tim has been involved in assessing the technical training needs of some of the country’s major financial corporations and helping them implement corpo-rate technology training universities. In addition to training, he has provided project coaching, architecture review, and project support to the chief informa-tion officers and senior engineers of these organizainforma-tions. Tim’s balanced blend of technical and business skills allows him to provide meaningful technology advice to CEOs, senior executives, and business leaders.
Executive Editor Bob Elliott
Development Editor Kenyon Brown
Production Editor Dassi Zeidel
Copy Editor
Foxxe Editorial Services
Editorial Manager Mary Beth Wakefield
Production Manager Tim Tate
Vice President and
Executive Group Publisher Richard Swadley
Vice President and Executive Publisher Joseph B. Wikert
Project Coordinator, Cover Lynsey Stanford
Proofreader Kathryn Duggan
Indexer
Robert Swanson
Cover Image
George Diebold/
Many people contributed to the success of this product and this book. The PerformancePoint Server research and development, marketing, and sales teams combine great experience, unsurpassed passion, and amazing drive to do the right thing for customers.
To Rachel Vigier, without whom this book would never have been written. To Ola Ekdahl for his deep technical experience and without whom IT Mentors would be far more boring (although we would have three more laptops and several more cell phones). Finally, to all the members of IT Mentors who helped (or were forced) to read draft after draft.
Steve Pontello and Alyson Powell Erwin are genuine experts in the world of analytics; they effortlessly blend the real world of business and decision mak-ing with the technical complexities of Multidimensional Expressions (MDX). Without their guidance, enthusiasm, and direction, we would all have had a much steeper mountain to climb. Many thanks to both of them for their always useful, always usable MDX samples and recommendations.
Much gratitude to Greg Bernhardt for his design expertise and tireless advocacy for elegant and usable designs. He inspires exceptional work and asks nothing less of himself.
Thanks to Josh Zimmerman, our security guru, for his patience with those of us who really have no clue how it works. And to Shannon House for her insight into how customers can be successful, and other valuable insights gained in the trenches. And to Rex Parker for his dashboard layout guidance and blog entries.
A special appreciation for the leadership and early vision of Lewis Levin, who began performance management efforts at Microsoft. To Peter Bull, who has continued to carry forward and develop the vision and ensures that the
product delivers it. Peter has been instrumental in defining what is needed and why. To Oleg Ovanesyan for his counsel and help in relating core technical issues to business concepts and key stakeholders. Many insights and much inquiry into key aspects of a business application from a business user’s perspective came from Eric Danas and Greg Parrott. To Mark Yang for the great partnership in delivering on the vision and the great debate and discussion of possible solutions.
Thanks for technical reviews from Patrick Baumgartner, Shelby Goerlitz, Nathan Halstead, Parul Manek, Srini Nallapareddy, Scott Sebelsky, Barry Tousley, and Roberta Vork. We sincerely appreciate all your help with content accuracy and guidance on communication.
To Michael Knightley, Elizabeth Smith, and Trevor Jones from Thorogood Associates for their contributions on how to effectively utilize partners and approach a performance management solution. We greatly appreciate the insights their over 20 years in the industry provided and are grateful for their contribution to this book.
Foreword xxvii
Introduction xxxi
Part I Performance Management and Microsoft
PerformancePoint Server 1
Chapter 1 Microsoft’s Performance Management Strategy 3 Chapter 2 Microsoft PerformancePoint Server Fundamentals 15 Chapter 3 Setting Up and Configuring PerformancePoint Servers 39
Part II PerformancePoint Monitoring and Analytics 59 Chapter 4 PerformancePoint Monitoring and Analytics Architecture:
Overview 61
Chapter 5 Implementing Scorecards and KPIs 89 Chapter 6 Developing Effective Analytic Views 119 Chapter 7 Creating Effective Dashboards 157 Chapter 8 Supplementing Dashboards with Reports 191 Chapter 9 Implementing Security Controls 211
Part III PerformancePoint Planning 217
Chapter 10 Planning Overview 221
Chapter 11 Application Components 239
Chapter 12 Business Rules 259
Chapter 13 Data Integration 277
Chapter 14 Reports and Forms 291
Chapter 15 Security and Roles 309
Chapter 16 Data Process 319
Chapter 17 Deployment and Migration 329
Part IV Successfully Engaging Users in Monitoring, Analytics, and
Planning 341
Chapter 18 Bringing Monitoring, Analytics, and Planning Together 343
Chapter 19 Planning and Maintaining Successful Dashboards 367
Chapter 20 Planning Application Development 377
Foreword xxvii
Introduction xxxi
Part I Performance Management and Microsoft
PerformancePoint Server 1
Chapter 1 Microsoft’s Performance Management Strategy 3
Traditional Approaches to Business Intelligence 3 Personal, Team, and Organizational BI 5
Functionality 6
An Integrated Solution 7
The Economic Model 8
A Simple Formula 8
PM Is Good 8
IWs Are Everywhere 8
Increase ROI, Decrease TCO 9
The Information Worker — The Core of
Microsoft’s Business 11
Summary 13
Notes 13
Chapter 2 Microsoft PerformancePoint Server Fundamentals 15
Trusting Your Data — The Business Intelligence Platform 15 Personal BI and Individual Productivity 17
Team BI Tools and Collaboration 17
Corporate BI and Alignment 18
How Does the PerformancePoint Server Story Come
Together? 19
The Analysts 20
The Contributors 20
The Executives 21
Flexibility, Security, and Auditability 22 Collaborative, User-Friendly, and Contextual 23 Aligned, Actionable, and Accountable 24
Monitor, Analyze, and Plan 24
Monitor 24
End-User Experience and Information Portability 25
Information Consistency 26
Collaboration and Unstructured Information 27
Analyze 28
Analytical Paradox 29
Aligned and Thin Analytics 29
Analytics Made Easy: Cross-Drilling 30
Web and Office Integration 31
Planning 32
The Modeler 32
The End-User Experience 34
Performance Management Is More Than Just Numbers 35
Summary 37
Notes 37
Chapter 3 Setting Up and Configuring PerformancePoint Servers 39
Monitoring Server 39
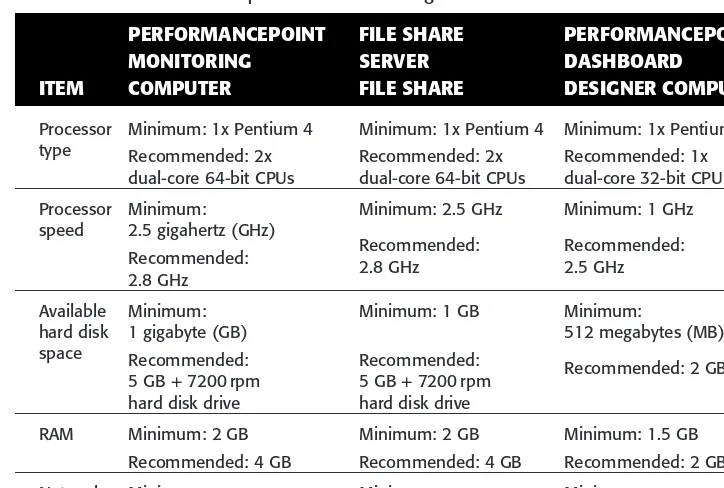
Hardware Prerequisites 39
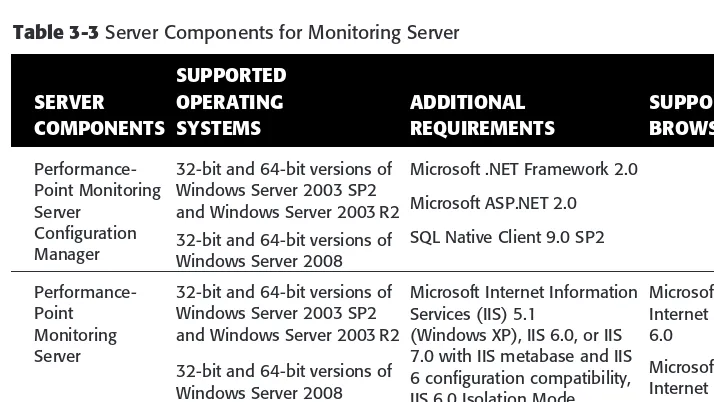
Software Prerequisites 40
System Requirements 40
Installing and Configuring Monitoring Server 43
Authentication Options 45
Application Pool User Identity 45
Connection Per User 45
Kerberos 45
Custom Data 46
Secure Socket Layer 46
Microsoft SharePoint Server Settings 46
Excel Services Settings 46
Configure Root Site 47
Reporting Services Settings 47
ProClarity Analytics Server Settings 48
Apply the PAS Hotfix 48
Best Practice Monitoring Server Installation 48
Planning Server 49
Hardware Prerequisites 49
Software Prerequisites 49
System Requirements 51
Installing and Configuring Planning Server 54
Authentication Options 55
Global Administrator 55
Kerberos 56
Secure Socket Layer 56
Installing the Planning Clients 56
Excel Add-In Client 56
Business Modeler Client 57
Best Practice Planning Server Installation 57
Summary 57
Part II PerformancePoint Monitoring and Analytics 59 Chapter 4 PerformancePoint Monitoring and Analytics Architecture:
Overview 61
Analytic Charts and Analytic Grids 75
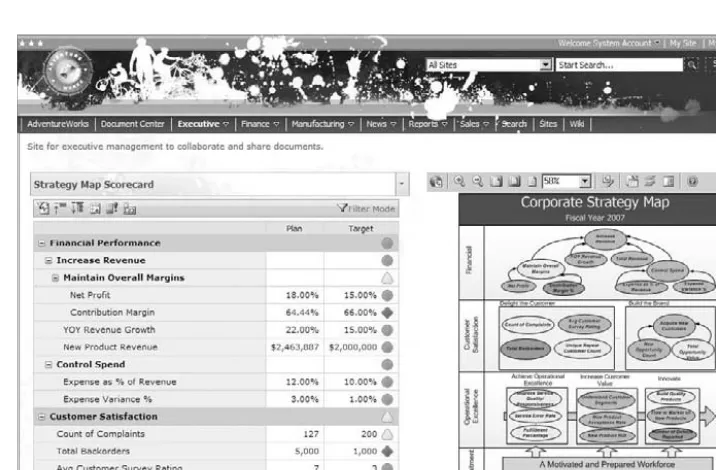
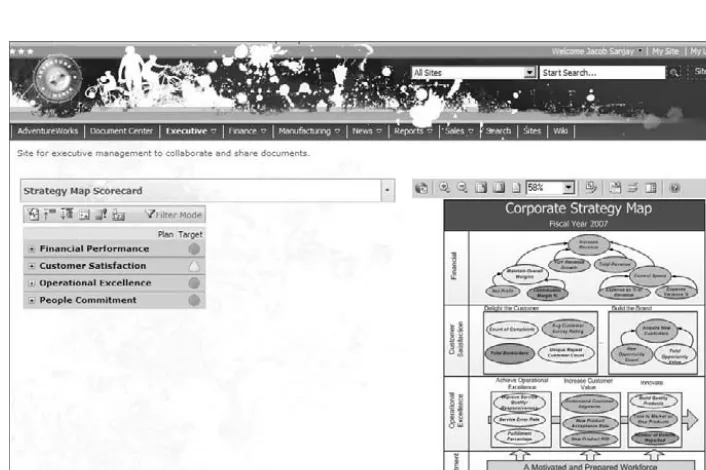
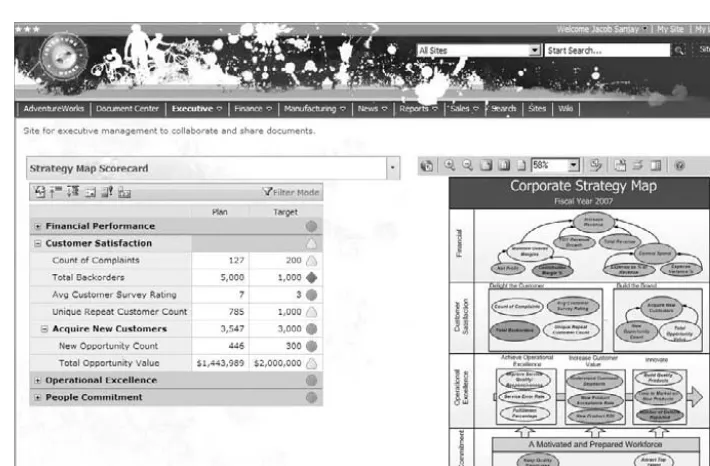
Strategy Maps 76
Analysis Server Data Sources 80
SharePoint List 80
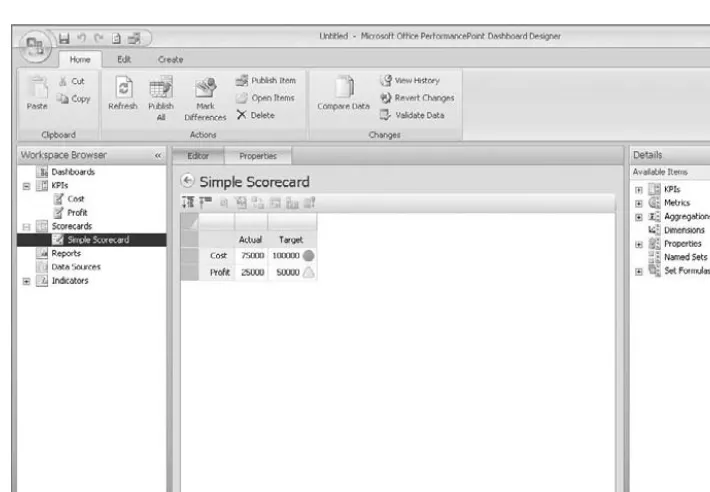
Creating Content — Dashboard Designer 83
Step 1: Create a Workspace 83
Step 2: Create Elements 83
Step 4: Configure Scorecard 83
Step 5: Configure Dashboard 84
Step 6: Deploy Dashboard 84
Data Sources 84
Reports 84
Dashboards 85
Deploying Content — Dashboard Designer 85
Update 85
Refresh 85
Publish 86
Deploy 86
Consuming Content — SharePoint 86
Viewing 87
Analyzing 87
Summary 88
Notes 88
Chapter 5 Implementing Scorecards and KPIs 89
Scorecards: Distributing Metrics to the Masses 89
What Is a Scorecard? 90
Scorecards and Performance Management Methodologies 93 Balanced Scorecard: Scorecard, Methodology, or Both? 94 Even a Simple Scorecard Provides Value 97 Scorecard Key Performance Indicators 98 What Are Key Performance Indicators? 99 Key Performance Indicator Components 101 Key Performance Indicators and Data Sources 102 Storing Key Performance Indicators 103
Best Practices KPIs 104
Creating KPIs 104
KPI Types and Calculations 105
Standard KPIs (Leaf Level) 105
Standard KPIs (Non-Leaf-Level) 106
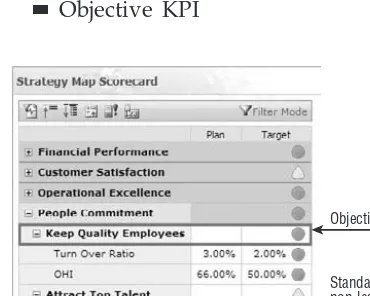
Objective KPIs 106
Best Practices Calculations 106
KPI Banding 106
Step 1: Calculate the Band by Value (BBV) 107 Step 2: Identify the In-Band Value (IBV) 108 Step 3: Calculate the Normalized Band by Value (NBV) 108
Scoring Rollup to Objectives 109
Fine-Tuning Rollup Types 109
KPI Weighting on the Scorecard 109
What Are Indicators? 110
Creating Indicators 111
Fine-Tuning KPIs with Thresholds 111
Creating Custom Indicators 112
Creating Additional Actual and Target Values 115
Creating Trend Values 115
Best Practices Trends 117
Summary 117
Notes 117
Chapter 6 Developing Effective Analytic Views 119
Understanding OLAP 120
Dimensions 120
Hierarchies 121
Lists and Sets 122
Calculations 123
Discover, Create, and Deploy 124
Translating Data into Insight 125
Creating Successful Views 125
Providing Context 128
Ensuring Relevance 128
Using PerformancePoint to Create Analytic Views 129
Placing Items in the View 130
Selecting Items for the View 134
Selecting the View Type 135
Using Advanced Visualizations 139
Using MDX Mode 141
Business Users: Gaining Insight 146
Use Filters 146
Drill Down and Drill Up 147
Drill Down To (Cross-Drilling) 149
Show Details 153
Sort 154
Export to Excel 154
Summary 155
Chapter 7 Creating Effective Dashboards 157
Successful Dashboards 157
Creating and Deploying Dashboards 159
Creating a New Dashboard 159
Managing Pages 160
Configuring Zone Layout and Size 162 Creating Interactive Dashboards Using Filters 166
Creating MDX Query Filters 170
Using Filter Link Formulas 171
Creating Time Intelligence Filters 172
Simple Time Period Specification 173
Creating Time Intelligence Filters 173 Step 1: Configure Mapping for the Data Source 174
Step 2: Apply Filters 176
Adding Reports 177
Best Practice Reports 179
Adding Filters to Dashboard Zones 179
Enabling Filters for Analytic Grids and Charts 181 Connecting Filters to Scorecard and Reports Views 183
Using the Display Condition Option 185
Connecting Scorecard KPIs to Report Views 187
Centralizing Dashboard Elements 188
Summary 190
Chapter 8 Supplementing Dashboards with Reports 191
Reports Answer the ‘‘What?’’ Question 191
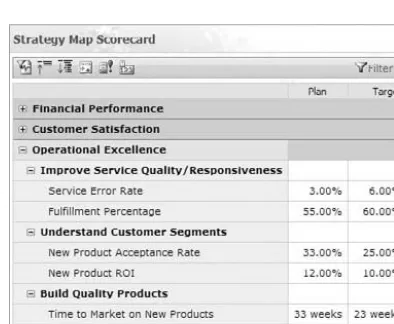
Strategy Maps 193
Designing Effective Strategy Maps 194
Creating Strategy Maps 196
Step 1: Create the Map Layout in Visio 197 Step 2: Create and Name the Strategy Map 197
Step 3: Select the Scorecard 197
Step 4: Create the Strategy Map 198
Step 5: Connect and Configure the KPIs 198
Step 6: Publish the Strategy Map 199
Step 7: Add the Strategy Map to the Dashboard 200
Excel Services 200
Step 1: Publish Excel Spreadsheets to SharePoint 200
Step 2: Create a New Report 200
Step 3: Link to the SharePoint Site 201
Step 4: Publish the Report 201
Step 5: Add the Report to the Dashboard 201
Reporting Services 203
Step 1: Publish RDL Files to SharePoint 203
Step 2: Create a New Report 204
Step 3: Link to the SharePoint Site 204
Step 4: Publish the Report 204
Step 5: Add the Report to the Dashboard 204
Trend Charts 204
Step 1: Enable DataMining in Analysis Services 206 Step 2: Configure Server Options in Dashboard Designer 206
Step 3: Create New Report 207
Step 4: Select a Scorecard and KPI 207
Step 5: Set Report Properties 207
Step 6: Publish the Report 208
Step 7: Add the Report to the Dashboard 208
Best Practices for Reports 208
Summary 208
Chapter 9 Implementing Security Controls 211
Application-Level Security 211
Item-Level Security 214
Summary 216
Part III PerformancePoint Planning 217
Chapter 10 Planning Overview 221
Product Overview 221
Personas 221
The Business Analyst 222
The Input Contributor 222
The Dangerously Technical and Business Savvy 222
The IT Administrator 223
Synchronous and Asynchronous Processing 229
Process Intervals 230
Chapter 11 Application Components 239
Business Application Type Library 239
Object Types 240
Type Behavior and Interaction 240
Dimensions 241
Dimensional Modeling 241
Attributes 244
Chapter 12 Business Rules 259
Outbound Rules 264
Implementation Types 264
Rule Templates 266
Parameters and Variables 269
Parameter and Variable Types 269
Publication as Jobs 270
Chapter 13 Data Integration 277
Data Integration Architecture 278
Chapter 14 Reports and Forms 291
Excel Client 291
Client Functionality 292
Add-In Menu Options 294
Caching and Offline Behavior 294
Reports 296
Forms and Reports 297
Matrix 298
Report Design 299
Ad Hoc Reports 299
Dynamic versus Static 300
Row and Column Intersections 304
Report Wizard 306
Summary 308
Chapter 15 Security and Roles 309
System Security 309
System Roles 310
Global Administrator 310
User Administrator 310
Data Administrator 310
Modeler 311
Users 311
Application Security 311
Business Roles 312
Users and Roles 314
User Dimension 315
Data Security 315
Model Access 315
Configuring Read/Write Security 316
Security Deployment 317
Summary 318
Chapter 16 Data Process 319
Process Flow Objects 319
Definitions 320
Instances 320
Data Process Flow 320
Cycles 321
Assignments 323
Review and Approval 326
Jobs 326
Summary 327
Chapter 17 Deployment and Migration 329
Deployment and Scaling 329
Deployment 330
Web Services 331
Clients 332
Part IV Successfully Engaging Users in Monitoring, Analytics, and
Planning 341
Chapter 18 Bringing Monitoring, Analytics, and Planning Together 343
MAP 343
Understand Your Data 344
Putting It Together: The How To 345
Viewing the Planning Models and Dimensions 345
Viewing the Data for the Model 350
Using the Data Source in Dashboard Designer 351 Setting Security Roles for Dashboard Designer 353
Building a Planning Scorecard 354
Building New KPIs 360
Building and Deploying the Dashboard 362
Adding Filters 363
Summary 365
Chapter 19 Planning and Maintaining Successful Dashboards 367
Ten Best Practices for Deploying Performance Dashboards 367 Common Mistakes to Avoid When Deploying
Performance Dashboards 369
How to Know If You Have the Ability to Build Effective
Chapter 20 Planning Application Development 377
Implementation Best Practices — How to Get the Job Done 377 The Roles of Business and IT Stakeholders 378
Organizational Objectives 378
Business and IT Together 378
IT and Operational Units Organizationally Separate 379 PerformancePoint Server 2007 Planning — Changing the
Paradigm 379
Solution Implementations 382
Targeted Proof of Concept — Right Scope, Right People 383 Partnering Effectively with Systems Integrators 386 How to Choose an Implementation Partner
(What to Look For) 389
How to Manage an Effective Project 391
Summary 393
Writing a book is hard. That’s why I write book Forewords. I do know that having passion is important to writing a good book. Passion carries you the distance, through the nights and weekends required to finish the book. Passion also drives the quality and depth of the book. Your authors have passion to spare. You’ll see this and feel this as you read throughMicrosoft Office PerformancePoint Server 2007.
Performance management software is a relatively recent passion at Microsoft. We started our business intelligence journey with SQL Server Analysis Services (originally called SQL Server OLAP Services) and Microsoft Excel. We started there because we feel there is a logical evolution of BI in companies. That path starts with ‘‘sound data.’’ If companies or organizations can’t provide their employees and partners with data that is clean, integrated, consistent, and fresh, they are not able to provide the foundation for good decision making. At Microsoft, SQL Server is where structured data lives.
Once you believe you have sound data, the next step on our recommended path is to focus on personal and team insights. Your employees have the best sense of what is going on at ‘‘street level’’ in your organization. They frequently have hunches about the state of the business; more than upper management, they see daily what is working and what is not working. Insights come from hunches combined with data and experience. If your people can access the sound data you have built, using a tool they already know, they will form insights from their hunches and experience. If they can share those insights with others via a platform like SharePoint, your company will grow and improve.
All along, we wanted to grow the Microsoft BI stack into the performance management arena. Beyond insight comes decision making. Companies and organizations struggle to balance the agility and creativity a platform like
SQL Server, SharePoint, and Excel provides with accountability, alignment with strategy, and consistency with company processes and definitions. Once employees develop insights, companies want them to make sound busi-ness decisions that fit the company’s strategy and processes. Performance management is the aspect of BI that records the company’s business rules and definitions and relates business execution to the goals the company established. We built PerformancePoint Server (PPS), the subject of this book, to provide critical performance management features in the Microsoft BI offering. PPS allows companies to manage the three key activities in performance man-agement: plan the business, monitor the execution of the plan, and analyze variances from the plan. We call this Monitor, Analyze and Plan, or MAP. The order is explained well inDrive Business Performance: ‘‘This may seem back-ward, as it may seem logical that the first capability to be developed would be planning, since a plan is crafted before it is monitored and analyzed. However, the Monitor capability is listed first because most organizations are already in motion when they begin their performance management initiatives. They often first seek to have the ability to know ‘what is happening.’’’1 MAP also happens to spell a word, PMA does not. . .and the key thing is to remember the three capabilities needed, not the order.
Bruno and Joey played key roles in the development and delivery of Perfor-mancePoint. Bruno helped define the mission of the product and marketing strategy; Joey helped define the alliance and go-to-market strategy, recruiting a fine stable of global service partners to deliver successful customer deploy-ments. I was lucky enough to collaborate with Joey and Bruno on this book as well as onDrive Business Performance. I have to say, I’ve not laughed so hard in a while. These guys had so much fun writing these books. Humor aside, they dedicated themselves to these two titles, and I think you’ll agree that the high quality shows it.
Steve Hoberecht has been working on Microsoft BI for quite awhile, having helped us develop the SQL BI platform and then serving as a key leader in the development of PerformancePoint and aligning BI development efforts across the company. Elaine Andersen is one of our veterans from ProClarity who has driven the continued development of industry-leading analytics through PerformancePoint. She also played a key role in managing much of the manuscript development — and the authors. Tim Kashani and his company, IT Mentors, have helped to train the global Microsoft BI community on Microsoft’s offerings, from SQL to Business Scorecard Manager to SharePoint and now PerformancePoint Server. His team has traveled the globe with us to ensure a readied ecosystem of customers and partners.
authors. In Chapter 19, the authors delve into best practices for implementing the monitoring and analysis phases of performance management. The vital tips and techniques come from our development team’s knowledge of the product as well as the deep experience they attained while working with over 20 early PPS adopters. Chapter 20 is the analog for the planning phase of performance management.
I’ve often been amazed by the power of passion in any endeavor. The authors had the passion to create an excellent book on PerformancePoint Server 2007. They had the endorsement and the cooperation of the team that created PPS. And they had a great sense of humor throughout. It was my pleasure to help out in the small ways that I did. Enjoy this book, and profit from it.
Bill Baker Distinguished Engineer Microsoft Corporation, April 2008
Notes
In late 2007, Bruno Aziza and Joey Fitts got together to write the book titled
Drive Business Performance: Enabling a Culture of Intelligent Execution(Wiley, 2008). As they were completing their text, they saw an opportunity for a second book that directly applied the concepts presented in their book with the software capabilities in Microsoft Office PerformancePoint Server 2007. They envisioned this companion book as a unique bridge between business and technology, focusing on applying the principles of performance management through the framework of a software application. Subsequently, Microsoft Office PerformancePoint Server 2007was born.
Who Should Read This Book
Unlike many software books, Microsoft Office PerformancePoint Server 2007
focuses on the business user, the person who needs to understand how a particular technology can help his or her organization succeed by adopting the principles of performance management. Although written for business users, the book doesn’t focus exclusively on business concepts or theories. Instead, it presents the concepts needed to be successful with performance management as an integrated discussion with the capabilities of PerformancePoint Server.
Like the software itself, this approach bridges the technology and the business areas to ensure that organizations see the return on their investments in greater overall organizational accountability and alignment. We hope the benefits of this approach will be twofold: Readers will understand both the technology investments and the organizational investments they need to make to successfully implement performance management in their organization with PerformancePoint Server 2007.
To succeed in this goal, we brought together five authors who have been with the product from its early beginnings. Each author has in-depth experi-ence with his or her area of the product, with customers, with performance management, and with enterprise-level businesses and organizations. They have seen all iterations of the product and understand the inspiration (and compromises) behind the concept, design, and implementation. They contin-ually hear from those implementing the software about how to do it right and have consolidated all that shared learning to this book.
How This Book Is Organized
This book is organized into four sections. Part I, ‘‘Performance Management and Microsoft PerformancePoint Server,’’ answers the question ‘‘Why should an organization invest in performance management with Microsoft Office PerformancePoint Server?’’ Chapters 1–3 highlight the insights and recom-mendations of industry experts who recognize that effective performance management is pervasive performance management — reaching everyone from the individual contributor to the executive. It concludes by providing an overview of PerformancePoint Server and how it achieves this goal.
Part II, ‘‘PerformancePoint Monitoring and Analytics,’’ focuses on answer-ing the questions ‘‘How is my organization performanswer-ing?’’ and ‘‘What are the driving forces behind this performance?’’ These questions can be answered through the monitoring and analytics capabilities of PerformancePoint Server. Chapters 4–9 explain how to use performance dashboards to deliver action-able information to all users in the organization. The early chapters highlight the architecture of Monitoring Server as well as the components needed to deploy dashboards to Microsoft Office SharePoint Server. These chapters also go in-depth on building scorecards, analytic views, and dashboards. The later chapters highlight additional report types and security.
Part III, ‘‘PerformancePoint Planning,’’ focuses on answering the question ‘‘How do I want my organization to perform?’’ It explains how to use the planning capabilities of PerformancePoint Server to design and deploy planning and budgeting applications. Chapters 10–14 describe the overall system and how different users interact with the application at different times during the planning cycle. These chapters also explain how to write effective business rules and design effective forms and reports to enable all users to actively contribute to the planning process using Business Modeler and Microsoft Excel. Chapters 15–17 bring these concepts together by presenting an overall workflow and deployment strategy for planning applications.
tools from real-world customer deployments and experiences. The information presented in Chapters 18–20 is tailored to ensure that readers fully understand the key issues for achieving a successful performance management system in their organization.
I
Performance Management and
Microsoft PerformancePoint
Server
Microsoft Office PerformancePoint Server is a key component of the Microsoft performance management and business intelligence offering.
In the next two chapters, we describe how to think about Microsoft’s business intelligence and how your company’s considerations for performance can impact the type of solutions you might want to look for.
We expand on the concepts of personal, team, and corporate business intelligence and dive into the rea-sons that make Microsoft’s approach so unique and different from the other options available.
PerformancePoint Server view, so you can truly envision what the solution can enable your organization to accomplish.
Additionally, we provide an overview of the key benefits that each end-user audience will get from performance management that is powered by Perfor-mancePoint Server. We discuss flexibility, agility, and accountability — key concepts that are important to consider.
Chapter 2 also provides a quick view into the key capabilities provided by PerformancePoint Server — monitoring, analyzing, and planning. Why are they important? What should you consider when thinking about each of these? We provide a quick glance at some of the key functionalities provided by the solution. We hope that these first two chapters will act as a great introduction to the rest of the book.
1
Microsoft’s Performance
Management Strategy
There’s no doubt that today’s information era brings exciting opportunities to drive business performance. Information has never been more accessible, nor has it ever been less expensive. People need only do a quick Internet search to find pages and pages of Web sites, blogs, and documents that can provide them with all manner of information.
But as much as information has been a help in driving organizational performance, most of us today feel inundated by information. This situation directly affects how we make decisions. It drives our ability to achieve our own goals and objectives and affects how well we can execute them across teams inside and outside our organization. Ultimately, the way we use information has an impact on our organization’s overall performance.
Only a few years back, the challenge was that people didn’t have the capability to get to the information — the tools they had access to were rudimentary and limited; there were not enough data connections or network bandwidth, and often the information was locked behind firewalls. Today’s challenge is the exact opposite. In fact, it has now become hard to corral the right information in time to help us do our jobs better.
The challenge for organizations, teams, and individuals today is to find a way to harness the power of information and make it work to their collective advantage.
Traditional Approaches to Business Intelligence
Business intelligence (BI) is not a new topic in the high-tech world. Since the first data warehouses and structured query languages were developed decades ago, people have been trying to find a way to make use of all the data
and information they generate. As is the case with any immature technology, development and advancement has come in fits and starts. And as is usually the case, first came the general tools, such as SQL, to help access and aggregate the data. Then came the toolsets — specialized for industries and verticals, roles and functions, processes and certain-sized organizations — all to meet the same general need but focused on specific niches where the problem was most acute, and the market opportunity the greatest.
As is the case with most technologies, such as enterprise resource planning (ERP), when the software solutions became more advanced, it made more sense to start aggregating tasks again under one roof and one vendor. And one by one, the specialty vendors were bought, sold, and integrated into the larger BI vendors — let’s call them pure plays. And while they too have now been bought, sold, and integrated, their legacy lives on and their approach has had a significant impact on how companies ultimately access, analyze, and share information.
For many years, these BI companies have talked a great deal about the overall market growth, penetration, and market opportunity they saw in front of them. Vendors rallied behind the idea that BI represents a lot of opportunity, that only about 20 percent of a typical organization uses BI, and that they were designing tools to access the other 80 percent. Then they’d release a new version of the product, and find themselves with the same users and the same penetration into a company. Why was this?
The problem with traditional BI approaches lies in the fact that they’re ultimately able to access only a fraction of the information that people today need to become more productive and make better decisions. Traditional BI approaches are tied to the ERP system, the data warehouse, customer relationship management (CRM), and the many different transactional systems that they have all over the organization.
They’re hard to use — and harder to maintain — and are often restricted to a few people or groups in the organization. Usage of the new system often peaks during the first few weeks after training, and eventually everyone drifts back to what they were using before, leaving the original 20 percent of the user population using a tool that was designed for 100 percent. Most often, the BI tools people are given don’t reflect how they want to use information and make decisions.
depend on it. But analysts represent only a fraction of the total employee base in an organization. While analysts feel informed enough to make the right decisions, the rest of the organization often operates on hunches and gut feelings.
InDrive Business Performance, this dilemma is referred to as the ‘‘Analytical Paradox’’:
While analyts have the analytic capabilities to derive insights, they lack the ability to directly act upon these insights. Conversely, while employees have the ability to take action, they often lack the ability to derive insights by themselves. The result is that business analysts’ request queues are overloaded on a daily basis, and employees end up making decisions which lack insight, timeliness, or both. This situation makes it impossible for organizations to quickly recognize and act upon changing market conditions — to be agile.1
Business intelligence should reflect the way most employees use informa-tion — not the other way around. When it does, everyone in the organizainforma-tion can be empowered to make better business decisions. Putting BI capabilities in everyone’s hands enables these critical decisions to be made locally, which makes them more relevant and immediate. It’s this velocity of decision making that drives productivity and ultimately business performance.
A BI solution must have the flexibility to work the way that most employees do. And in looking at the way in which they do their jobs on a daily basis, we can categorize the use of BI into three main contexts: personal BI, team BI, and organizational BI.
Personal, Team, and Organizational BI
First, most often people use BI personally — just for themselves. This could be an Excel spreadsheet that they put together to see if a calculation still makes sense based on the ballpark numbers they received in an email. It could be a visual diagram that they created, a project plan that lets them know if they have the right resources to get the job done on time and under budget, an Outlook task list, a call sheet, a production report, and so forth. Whatever it is, it’s not being shared with the board of directors, or maybe not even with their boss. It’s for them, individually — and it’s likely in the form of some sort of document or spreadsheet that they use to make themselves more productive.
allows individuals to work better within their group, or even across groups, to share information, and to ensure that everyone is on the same page. Team BI means that all individuals know where they stand with the most up-to-date information. They can make the right decision to help the team achieve its goals. More importantly, when we speak about teams, we mean to include the broadest possible definition of what constitutes a team. A team can range from the few colleagues who sit beside you in the row of offices on your floor or it can mean other people in the organization who do the same job that you do but whom you never have met. These people are not likely to ever be in the same place at the same time or even to know each other. But they’re highly dependent on having the right information at the right time so that they make the right decision for the customer. Team BI means linking your teams together wherever they are, arming them with the right tools, and allowing them to share, collaborate, and manage information.
The last dimension is the corporate, or organizational, dimension of business intelligence. This represents the larger strategic goals and objectives set by the company, such as net profit, top-line revenue, and market share — the numbers that the entire organization is working to achieve. Teams may have different goals within this larger goal, but in this context, all teams are pushing towards the same objective. This type of BI is often developed and maintained centrally by the IT function so that everyone in the organization knows where they stand relative to their role in helping the company achieve its goals.
In order to support what people do on a regular basis — for themselves, their teams, and their companies — business intelligence needs to be thought of as a continuum of functionality required to help employees achieve their productivity and performance goals. The more formal part of BI — the cor-porate goals and objectives — influences what teams and individuals do. Personal and team BI are driven by the many knowledgeable workers across the organization and their needs for agility, speed, and empowerment.
In order for BI to reach its potential in organizations, it must have the flexibility and functionality to extend from the individual employee to the team and to the organizational level, while accommodating the different use cases and needs across the organization. Fundamentally, the ability to deliver on the promise of BI across the organization depends on three important factors: strong functionality, an integrated solution, and a scalable economic model.
Functionality
doesn’t have enough horsepower for power users, the toolset will not be used. Further, the tool must be flexible enough to adapt to the needs of a diverse group of users. Flexibility and modularity are of paramount importance in selecting BI applications, as one size most definitely does not fit all when it comes to the needs and requirements of a diverse employee community for BI. Aside from the analysts who work in different departments throughout the organization, most of employees don’t spend their days inside a BI system — or an ERP, CRM, or supply chain management system. People work outside of the structured technology environment for much of the day — they meet customers, they respond to emails, they are out on the factory floor. But at those times when they need business intelligence, they need it immediately — they can’t afford to interrupt the flow of their workday to learn a new tool or process. People need the BI system to adapt to what they are doing at the time and what they need the information for. That puts a huge emphasis on a full range of functionality that addresses both the power users — or employees who will spend most, if not all of their day in the BI environment — and those employees who will spend just a fraction of their time there. People don’t want two different systems or two different interfaces or two different platforms to maintain for these user groups; they want one. And that’s why an integrated BI solution is so critical.
An Integrated Solution
Achieving the promise of business intelligence requires the ability to pull data from virtually any data source, and the system must work well with line-of-business applications and desktop productivity tools, as well as email, portals, and document repositories.
Additionally, using the right tools and applications ensures that employees can use that data in the way they want to in order to make decisions rapidly and efficiently. They need applications and tools that range from personal to team, organizational, and corporate tools, with a familiar look and feel, integrated with elements of the employees’ unstructured world such as email and documents.
Functionality and integration have quickly become the requirements for pervasive business intelligence and performance management. Many com-panies are now faced with the following dilemma: Now that the space has become consolidated and all vendors seem to have parity, why would I choose one over the other?
The Economic Model
Microsoft was recently recognized as a leader in the BI space. While the recognition is recent, it rests on decades of work done on BI software as well as the BI model. From a software standpoint, the innovation in SQL Server and Office (Excel and SharePoint) as well as the recent release of PerformancePoint Server (PPS) point to this leadership.
In addition to software, Microsoft’s unique approach can help compa-nies reap the benefits of pervasive performance — improving performance throughout the organization. Microsoft’s approach to BI and performance management can be summarized in a simple formula.
A Simple Formula
Here’s a simple formula that illustrates the Microsoft value proposition:
PM is good everywhereIWs are
Increased ROI, Decreased TCO is good
Microsoft Performance Management
PM Is Good
The first premise of ‘‘why rely on Microsoft for performance management (PM)?’’ is that you believe that measuring what you manage, managing what you measure, and making data-driven decisions are all good things.
In an ever-increasing competitive, global economy, companies are tasked with continuing to compete at a world-class level — what got you here won’t keep you there. Shareholders continually seek to see improved performance, and the competition continues to increase capabilities and value.
This is the starting point — these tenets are the foundation of the premise that Microsoft PM may be of value. Managing performance can only be of value if we value improving performance to begin with . . .hardly a controversial view.
IWs Are Everywhere
The difference with Microsoft’s approach to PM is really in this component of the formula — the premise that people are making decisions throughout the entire organization, not just in the upper 1 to 5 percent of the organization where PM tools have historically been provided.
information, at the right time, in the right format’’ is central to everyone’s value proposition.
Two points that we think that are worth noting here are:
‘‘Better information’’ doesn’t matter if results aren’t improved — improved company performance is the whole reason for this entire endeavor of BI/PM.
Empowering all employees requires a different approach, and this approach is what truly separates Microsoft from other vendors. Microsoft has always made the claim that information workers exist throughout the entire organization — and it is Microsoft’s ability to serve this community that sets it apart.
Perhaps Randy Benz, CIO of Energizer Holdings, says it best in Drive Business Performance:
We used to have a view that only the top management members could deliver significant impact — we called these folks the ‘‘difference makers’’ and our IT efforts were geared toward getting information only to this select few. But not anymore. Now, we’re aiming our efforts towards the hundreds of people across the organization who make the thousands of day to day decisions that really make the difference in business performance. We’re getting new capabilities out to these ‘‘difference makers’’ across the enterprise — and recognizing wide scale increases in our effectiveness and impact.’’2
Increase ROI, Decrease TCO
This point seems self-evident. . . and is also part of the standard marketing work of any vendor. Increasing the return on investment (ROI) for a customer of any technology is critical for any customer to be willing to make the investment. . . and reducing a customer’s total cost of ownership (TCO) is equally important.
Why would a customer lay out thousands or millions of dollars, pounds, euros, yen, or the like without knowing that they would get a greater return for the investment?
Changing the cost model is not new to Microsoft. In fact Bill Baker, Distin-guished Engineer, Microsoft — the man who led Microsoft’s entry into BI and the more recent PM push — continually makes this point:
Office PerformancePoint Server 2007 was designed to address and wipe out these inhibitors, enabling performance management across the enterprise, not just for the CFO and financial analyst.
We plan to introduce Office PerformancePoint Server 2007 at an attractive per-user price point, pricing and licensing the performance management applica-tion for broad adopapplica-tion. Probably the single most important differentiaapplica-tion from competitive offerings is that the complete capability set that includes scorecarding, analytics, planning, budgeting, forecasting, consolidation and financial reporting is delivered through Excel and other pervasive Microsoft Office products. These are the productivity tools that CFOs, financial analysts and information workers live in every single day. This limits or altogether eliminates the need for expensive training on complicated front-end business intelligence and performance man-agement tools, and ensures that performance manman-agement is part of the rhythm of the business, not a process that lives outside it.’’3
This approach has helped many companies think about their deployments differently. Although BI and PM could have been considered as departmental projects in the past, this new economic approach allows companies to expand the reach of their initiatives. This trend is particularly relevant to the ROI and TCO discussion.
As companies realize that all employees make decisions that have an impact on the company’s bottom line, and that better results come from better information, the return on investment of empowering more employees grows. While in the past, companies might have empowered a few people — who, as discussed earlier, represent only a small fraction of the decisions made — these companies now have the opportunity to empower all.
This type of requirement calls for a different cost model and one that cannot be addressed by older and more traditional approaches to BI and PM. As Allen Emerick, Director of IT at Skanska, describes it:
We believe that business intelligence is for every individual in the organiza-tion because every individual needs to be able to make better, more informed decisions. . .. Microsoft business intelligence allows us to do that — and we have
2,000 employees using the solution. We expect to expand that to most of our 4,000 employees. We could never have done that with Hyperion.4
This model benefits companies, Microsoft, and its large ecosystem of part-ners. Phil Morris, CEO of Mariner, a Microsoft Gold partner summarized this best:
customers replace their BI pure-play solutions with Microsoft’s solution, for no more cost than what they used to pay for the BI pure-play vendors’ annual maintenance fees alone. With the Microsoft BI solution, they report overall cost savings and high user acceptance rates because employees are able to access, share and collaborate using the familiar interfaces of Word, Excel, SharePoint, and Outlook.5
Indeed, it is particularly true that Microsoft can meet the requirements of increasing the ROI and decreasing the TCO component of the equation based on their existing licensing model with customers.
And their customers have been looking to consume their BI/PM offerings in the same way. For the new PM offerings, Microsoft is taking a similar approach to what they did with the now large base of customers who are currently using their SQL BI platform. We will discuss Microsoft’s pricing and licensing strategy for BI/PM in more detail later.
Beyond Microsoft’s economic model and the benefits this brings to partners and companies alike, it is also important to note that Microsoft is in the business of information workers at its very core.
The Information Worker — The Core of Microsoft’s Business
Peter Drucker coined the term ‘‘knowledge worker’’ in his book Landmarks of Tomorrow, published in 1959, to refer to the transition of the type of work that would be done by American laborers going forward within the century, moving from manual labor in factories to knowledge work.
Microsoft uses the term ‘‘information worker’’ to describe the large number of employees throughout an organization. It can be argued that there are more ‘‘information workers’’ than ‘‘knowledge workers.’’6 However we will use these terms interchangeably throughout this book. Jeff Raikes, president of Microsoft’s Business Division,7described an information worker as ‘‘anybody who is an active participant in a business information flow or business information process.’’
The Information Worker business unit delivers about $18 billion in revenue to Microsoft annually, or around one-third of its total revenue, and Microsoft’s service and attention to this community are unparalleled. In addition to a development team that is focused on the user interface (UI) and that was responsible for developing the Office Fluent user interface, Microsoft’s Office development organization has a dedicated user experience group called the Office Design Group, which focuses on the usability and design elements of the Office user interface.
thorough understanding of the broad range of Office customers. The close connection between the usability research and design ensures that the UI design is tested and informed by customer research.
The team uses a variety of methods to test the user interface, including in-lab studies in which people are observed using Office to perform specific tasks, eye-tracking studies using equipment that actually lets the team see where people are looking on the screen as they use the programs, and workplace observation where the team watches people use Office and talks to them about their experience using Office. To gain deeper insight into people’s levels of satisfaction with the Office Fluent user interface, the research team conducts focus groups and large-scale surveys. These types of research were extremely useful in helping the team develop a clear understanding of the sources of dissatisfaction that were most often expressed as ‘‘bloat’’ and address them in Office 2007.
The Customer Experience Improvement Program (CEIP) is a voluntary, opt-in program that collects anonymous information about errors, system performance, and frequency of command usage. The analysis of this broad, rich instrumentation data marked a significant advance in Microsoft’s ability to understand and react to real-world use and scenarios.
As with most instrumentation systems, Microsoft has no insight into users’ goals or the specific words, numbers, or objects that make up most of a user’s content. But, looking across multitudes of users and analyzing how frequently commands are accessed and from where in the UI, they began to understand overall usage patterns. Microsoft used these general patterns to further inform their understanding of how commands were being used: how many people used a feature, how frequently it was used, and from where in the UI it was typically accessed. With observational and personal feedback data, Microsoft is able to begin to identify areas which, if improved, would have the greatest impact, plus it has gained insights into what those improvements might be.
The research is ongoing and continuous. For the launch of the 2007 Office system, this team conducted extensive research to continue to ensure a deep understanding of the information worker:
Since Office 97, they have engaged 5000+ people in in-lab studies to eval-uate the usability of Office.
They have 26,000 hours of video-taped usage (Office 2000 to Office 2003). If you wanted to watch the tapes of every usability lab study they’ve done on Office 2000, XP, and 2003, it would take you over 3 years. For Office 2003 alone, they spent 3,500+ hours observing people use the software in their workplaces and in the teams’ labs.
relationship with, and size of this community of Microsoft users, it is clear that the information worker is core to Microsoft’s business. In summary, when customers buy business intelligence and performance management from Microsoft, they benefit from the software, the unique economic model, and the unparalleled experience the company has in the information worker’s world.
Regardless of which component of the equation you optimize for — whether you care more about ‘‘PM is good,’’ optimizing for the total number of information workers you want to enable with PM capabilities, or the degree to which you want to increase ROI or decrease TCO — Microsoft’s value becomes increasingly apparent.
Summary
In this chapter, we covered some of the key fundamentals of Microsoft’s performance management and business intelligence capabilities.
We talked in detail about the traditional approaches to business intelligence and how Microsoft’s unique approach to personal, team, and organizational BI can help your organization provide business intelligence for all types of uses.
Finally, we covered some of the key differentiators of the Microsoft value proposition and addressed what makes Microsoft a great source to help you address all your performance management and business intelligence needs, such as its economic model and its core knowledge of the information worker’s world.
Notes
1. Bruno Aziza and Joey Fitts,Drive Business Performance: Enabling a Culture of Intelligent Execution (Wiley, 2008).
2. Ibid.
3. Seewww.microsoft.com/presspass/features/2006/dec06/ 12-05performancepoint.mspx.
4. Seewww.microsoft.com/presspass/features/2007/may07/ 05-09BusinessIntelligence.mspx.
5. Seewww.microsoft.com/presspass/press/2006/sep06/ 09-22BIMomentumPR.mspx.
6. Seewww.directionsonmicrosoft.com/sample/DOMIS/update/ 2002/10oct/1002iwfonc.htm.
2
Microsoft PerformancePoint
Server Fundamentals
As you saw in the last chapter, business intelligence takes many different forms, according to how people want to use information, how connected they need to be to what’s going on above them, and what the information is going to be used for.
No single tool is meant to accommodate the infinite and changing ways in which we use data to make business decisions. To the contrary, companies need a flexible set of tools and applications that combine into a single solution.
Trusting Your Data — The Business
Intelligence Platform
The bane of many business intelligence (BI) projects has been a lack of trust in the data we put in front of end users. They may use it once, and they may even use it a second time, but if they don’t believe the numbers in front of them, if they don’t get the numbers in time to use them, or if they can’t make out what the data is trying to tell them, inevitably they’ll drift back to what they were using before. This is why IT directors everywhere have spent a significant amount of time, budget, and resources on ensuring data integrity and integration across the entire enterprise.
Microsoft addresses this fundamental issue with its industry-leading data management and BI platform capabilities found in SQL Server. SQL Server provides a trusted data platform that integrates data from anywhere — be it
structured sources like databases, ERP systems, general ledgers — wherever! And it does so in a fashion that gets the data where it needs to be, in a vast array of formats that fit the use case in mind — individuals, teams, or aligning the entire organization.
How SQL Server does this, in addition to its pure database management capabilities, is reflected in three key BI components within the product: integration, reporting, and analysis.
In SQL Server Integration Services, data from both structured and unstruc-tured data sources is brought together seamlessly, finding its way to reports, dashboards, and metrics throughout the organization. And just as important as ensuring that data sources as disparate as spreadsheets and general ledgers are brought together is the timeliness with which this process takes place. After all, few people read yesterday’s news (unless they’re looking for some-thing specific) — people want what’s current, what’s actionable. Effectively integrating data helps ensure that they achieve this goal.
Once the data is integrated, where does it all go? What form does it take in order to actually be actionable? For many people, it takes the shape of reports, which is where the second key business intelligence feature of SQL Server comes into play: SQL Server Reporting Services. Providing a range of documents from highly formatted and structured reports used for regulatory filings and financial statements, to ad hoc reports used by analysts and end users to find one number, the reporting capabilities within SQL Server have to be as flexible as the use cases for the information. With the 2008 version of the product now available, report authors, designers, and end users have a huge array options and alternatives to ensure that data gets to where it needs to go, in the right format for both the user and the occasion.
When people need to do more than just report on data and go beyond the surface-level information that a report can provide, they need to dig into the data and answer those pesky ‘‘why’’ questions: Why are sales going down? Why are lead times for this product taking longer than that one? Why aren’t these budget figures adding up? All these questions require people to analyze data, ask questions of it, and root around to find connections and reasons. People need an efficient way to organize the data and facilitate this type of analysis.
Personal BI and Individual Productivity
Once the data is integrated, organized, and reportable, people can turn to how they want to use that data. Throughout the day, people need to work with BI as individuals, in a personal way; they need BI to help with personal tasks and projects.
There is no better product to accomplish this than Microsoft Excel, part of the Office family of products and applications. Excel is clearly the most frequently used personal BI tool on the market today — just look at the lengths to which other vendors go to connect to Excel. Most vendors today know that few employees actually spend time ‘‘inside’’ the BI tool — they want the data but in a tool that they know how to use and can manipulate to do their jobs.
Whether it’s organizing table information or adding up sums and totals, Excel quickly and easily helps end users make sense of the information in front of them and get it into a format that allows them to move forward with their day. Advanced users can turn Excel into a highly sophisticated business intelligence tool as well. From its pivot table capabilities and charting options to its own slicing and dicing capabilities, the sky’s the limit when it comes to using this most versatile of BI products.
Beyond powerful spreadsheet capabilities, the Office System of products provides other personal BI capabilities as well — from the data visualization capabilities within Visio to the flowcharting and resource intelligence gathering in Project to the mapping capabilities found in MapPoint.
All three products serve as a powerful supporting cast that helps individ-uals ensure that they are focused on utilizing information from reports and databases in the most efficient manner, which allows them to maximize their productivity and effectiveness within the organization.
Team BI Tools and Collaboration
People don’t spend all their time on individual projects. Eventually, they must interact with the outside world — their teams, their vendors, and their customers — in some form or fashion.
We’re all quite familiar with the challenge of integrating information from multiple spreadsheets and versions of reports. We never seem to get on the same page, and end up making wrong decisions, all because we don’t all have the same information on which to base our decisions in the first place.