Learn to:
•
Apply the latest Microsoft technologies
and use them together
•
Create an effective strategy to solve
business problems
•
Work with the SQL Server
®product
suite
•
Use the new SharePoint
®Business
Intelligence tools
Microsoft
®
Business
Start with
FREE
Cheat Sheets
Cheat Sheets include
•
Checklists
•
Charts
• Common Instructions
• And Other Good Stuff!
Get Smart at Dummies.com
Dummies.com makes your life easier with 1,000s
of answers on everything from removing wallpaper
to using the latest version of Windows.
Check out our
•
Videos
• Illustrated Articles
• Step-by-Step Instructions
Plus, each month you can win valuable prizes by entering
our Dummies.com sweepstakes. *
Want a weekly dose of Dummies? Sign up for Newsletters on
• Digital Photography
• Microsoft Windows & Office
• Personal Finance & Investing
• Health & Wellness
• Computing, iPods & Cell Phones
•
eBay
•
Internet
• Food, Home & Garden
Find out “HOW” at Dummies.com
To access the Cheat Sheet created specifically for this book, go to
Intelligence
FOR
by Ken Withee
Intelligence
FOR
111 River Street Hoboken, NJ 07030-5774
www.wiley.com
Copyright © 2010 by Wiley Publishing, Inc., Indianapolis, Indiana Published by Wiley Publishing, Inc., Indianapolis, Indiana Published simultaneously in Canada
No part of this publication may be reproduced, stored in a retrieval system or transmitted in any form or by any means, electronic, mechanical, photocopying, recording, scanning or otherwise, except as permit-ted under Sections 107 or 108 of the 1976 Unipermit-ted States Copyright Act, without either the prior written permission of the Publisher, or authorization through payment of the appropriate per-copy fee to the Copyright Clearance Center, 222 Rosewood Drive, Danvers, MA 01923, (978) 750-8400, fax (978) 646-8600. Requests to the Publisher for permission should be addressed to the Permissions Department, John Wiley & Sons, Inc., 111 River Street, Hoboken, NJ 07030, (201) 748-6011, fax (201) 748-6008, or online at http:// www.wiley.com/go/permissions.
Trademarks: Wiley, the Wiley Publishing logo, For Dummies, the Dummies Man logo, A Reference for the Rest of Us!, The Dummies Way, Dummies Daily, The Fun and Easy Way, Dummies.com, Making Everything Easier,and related trade dress are trademarks or registered trademarks of John Wiley & Sons, Inc. and/ or its affi liates in the United States and other countries, and may not be used without written permission. All other trademarks are the property of their respective owners. Wiley Publishing, Inc., is not associated with any product or vendor mentioned in this book.
LIMIT OF LIABILITY/DISCLAIMER OF WARRANTY: THE PUBLISHER AND THE AUTHOR MAKE NO REPRESENTATIONS OR WARRANTIES WITH RESPECT TO THE ACCURACY OR COMPLETENESS OF THE CONTENTS OF THIS WORK AND SPECIFICALLY DISCLAIM ALL WARRANTIES, INCLUDING WITH-OUT LIMITATION WARRANTIES OF FITNESS FOR A PARTICULAR PURPOSE. NO WARRANTY MAY BE CREATED OR EXTENDED BY SALES OR PROMOTIONAL MATERIALS. THE ADVICE AND STRATEGIES CONTAINED HEREIN MAY NOT BE SUITABLE FOR EVERY SITUATION. THIS WORK IS SOLD WITH THE UNDERSTANDING THAT THE PUBLISHER IS NOT ENGAGED IN RENDERING LEGAL, ACCOUNTING, OR OTHER PROFESSIONAL SERVICES. IF PROFESSIONAL ASSISTANCE IS REQUIRED, THE SERVICES OF A COMPETENT PROFESSIONAL PERSON SHOULD BE SOUGHT. NEITHER THE PUBLISHER NOR THE AUTHOR SHALL BE LIABLE FOR DAMAGES ARISING HEREFROM. THE FACT THAT AN ORGANIZA-TION OR WEBSITE IS REFERRED TO IN THIS WORK AS A CITAORGANIZA-TION AND/OR A POTENTIAL SOURCE OF FURTHER INFORMATION DOES NOT MEAN THAT THE AUTHOR OR THE PUBLISHER ENDORSES THE INFORMATION THE ORGANIZATION OR WEBSITE MAY PROVIDE OR RECOMMENDATIONS IT MAY MAKE. FURTHER, READERS SHOULD BE AWARE THAT INTERNET WEBSITES LISTED IN THIS WORK MAY HAVE CHANGED OR DISAPPEARED BETWEEN WHEN THIS WORK WAS WRITTEN AND WHEN IT IS READ.
For general information on our other products and services, please contact our Customer Care Department within the U.S. at 877-762-2974, outside the U.S. at 317-572-3993, or fax 317-572-4002. For technical support, please visit www.wiley.com/techsupport.
Wiley also publishes its books in a variety of electronic formats. Some content that appears in print may not be available in electronic books.
Library of Congress Control Number: 2010922562 ISBN: 978-0-470-52693-4
Ken Withee is a consultant specializing in Microsoft technologies. He lives with his wife Rosemarie in Seattle, Washington. He is coauthor of Professional Microsoft SQL Server 2008 Reporting Services (Wiley Publishing) with Paul Turley, Thiago Silva, and Bryan C. Smith.
Ken earned a Master of Science degree in Computer Science studying under Dr. Edward Lank at San Francisco State University. Their work has been published in the LNCS journals and was the focus of a presentation at the IASTED conference in Phoenix. Their work has also been presented at various other Human Computer Interaction conferences throughout the world.
I dedicate this book to my wife and best friend, Rosemarie Withee, who encouraged me daily throughout this time-intensive process. I owe her nearly a year’s worth of late nights and weekends and hope to make it up to her during our long future together. I love you!
Author’s Acknowledgments
I would like to acknowledge my grandma, Tiny Withee, who turns 96 this year and is still going strong. I would also like to acknowledge my wife Rosemarie Withee, mother Maggie Blair, father Ken Withee, sister Kate Henneinke, and parents-in-law Alfonso and Lourdes Supetran and family.
I would like to acknowledge my colleagues at Hitachi Consulting. I would like to send a special thank you to Paul Turley, Reed Jacobson, Aaron Daisley-Harrison, and Todd Folsom for putting up with my endless questions about the experiences they have had over their very successful careers.
I would like to thank Denny Lee and Thierry D’Hers for their support on the Microsoft side and the discussions about the Microsoft Business Intelligence technologies.
outside the U.S. at 317-572-3993, or fax 317-572-4002.
Some of the people who helped bring this book to market include the following:
Acquisitions and Editorial
Project Editor: Blair J. Pottenger
Acquisitions Editors: Katie Mohr, Tiffany Ma
Senior Copy Editor: Barry Childs-Helton
Technical Editor: Chris Leiter
Editorial Manager: Kevin Kirschner
Editorial Assistant: Amanda Graham
Sr. Editorial Assistant: Cherie Case
Cartoons: Rich Tennant (www.the5thwave.com)
Composition Services
Project Coordinator: Sheree Montgomery
Layout and Graphics: Ashley Chamberlain
Proofreaders: Lindsay Littrell, Toni Settle
Indexer: Ty Koontz
Publishing and Editorial for Technology Dummies
Richard Swadley, Vice President and Executive Group Publisher
Andy Cummings, Vice President and Publisher
Mary Bednarek, Executive Acquisitions Director
Mary C. Corder, Editorial Director
Publishing for Consumer Dummies
Diane Graves Steele, Vice President and Publisher
Composition Services
Introduction ... 1
Part I: Embracing a Microsoft Business
Intelligence Solution ... 7
Chapter 1: Surveying Microsoft Business Intelligence from 50,000 Feet ... 9
Chapter 2: Blazing a Trail through the Data Jungle ... 23
Chapter 3: Adopting Microsoft Business Intelligence ... 39
Part II: Wrapping Your Head Around
Business Intelligence Concepts ... 57
Chapter 4: Using Data to Inform and Drive Business Activities ... 59
Chapter 5: Taking a Closer Look at Data Collection ... 77
Chapter 6: Turning Data into Information ... 99
Chapter 7: Data Mining for Information Gold ... 123
Part III: Introducing the Microsoft Business
Intelligence Technologies ... 145
Chapter 8: Meeting SQL Server ... 147
Chapter 9: Excel — Digital Data Power to the People ... 175
Chapter 10: SharePoint Shines ... 211
Chapter 11: Expressing Yourself with Development Tools ... 247
Part IV: Incorporating Microsoft Business Intelligence
into Your Business Environment ... 273
Chapter 12: Setting Your BI Goals and Implementation Plan ... 275
Chapter 13: Evaluating and Choosing Technologies ... 297
Chapter 14: Testing and Rolling Out ... 315
Chapter 17: Ten Keys to Successful Microsoft Business Intelligence ... 363 Chapter 18: Ten Ways to Boost Your Bottom
Line with Microsoft Business Intelligence ... 375
Introduction ... 1
About This Book ... 2
How to Use This Book ... 2
How This Book Is Organized ... 3
Part I: Embracing a Microsoft Business Intelligence Solution... 3
Part II: Wrapping Your Head Around Business Intelligence Concepts ... 3
Part III: Introducing the Microsoft Business Intelligence Technologies ... 4
Part IV: Incorporating Microsoft Business Intelligence into Your Business Environment ... 4
Part V: The Part of Tens ... 4
Icons Used In This Book ... 5
Let’s Get Started! ... 6
Part I: Embracing a Microsoft Business Intelligence
Solution ... 7
Chapter 1: Surveying Microsoft Business Intelligence
from 50,000 Feet. . . .9
Introducing Microsoft Business Intelligence ... 9
Knowing the components of Microsoft BI ... 10
Tracing the terminology ... 11
Getting to the Core of Microsoft BI ... 12
Date warehousing and data marts ... 13
Reporting on data ... 13
Integrating data from many sources ... 14
Analyzing data ... 14
Data mining ... 15
Microsoft BI Data Presentation ... 15
Microsoft Offi ce Excel ... 16
Microsoft Offi ce Visio ... 16
Microsoft SharePoint ... 16
Microsoft BI Development Tools ... 18
Visual Studio ... 19
Report Builder ... 20
Silverlight ... 20
Chapter 2: Blazing a Trail through the Data Jungle. . . .23
Exploring the Data Lifecycle ... 24
Data generation and collection ... 25
Data transformation and organization ... 29
Data visualization and reporting... 31
Data analysis... 32
Data mining ... 33
Understanding How Microsoft BI Fits into the Data Lifecycle ... 34
Juggling Data ... 36
It’s a Flood of Data! Headed This Way! ... 37
Chapter 3: Adopting Microsoft Business Intelligence . . . .39
Understanding the Adoption Process ... 40
Determining what to ask the BI genie... 42
Investigating your current Microsoft product usage ... 43
Taking stock of your Microsoft knowledge ... 47
Saving your sanity with a prototype ... 48
Iterating the prototype to success ... 49
Documenting Your Key Business Processes ... 50
Understanding Where to Find Microsoft BI Guidance ... 51
Taking advantage of in-house expertise ... 51
Calling in the experts ... 51
Tracking down individual experts ... 53
Who you gonna call? Microsoft Support! ... 54
Other resources online and on paper ... 55
Part II: Wrapping Your Head Around
Business Intelligence Concepts ... 57
Chapter 4: Using Data to Inform and Drive Business Activities . . . . .59
The Importance of Data in Making Business Decisions ... 60
Tracking down the relevant data ... 62
Getting the right data to the right person at the right time ... 63
BI and the risk of high-tech tunnel vision ... 65
Why All the Fuss about OLAP? ... 66
What is OLAP? ... 66
What makes OLAP so fast? ... 67
Why OLAP? ... 69
Databases and cubes ... 70
Measures and facts (of life) ... 74
Chapter 5: Taking a Closer Look at Data Collection . . . .77
The King of BI Concepts — ETL ... 78
Extracting data ... 78
Transforming data ... 79
Loading data ... 81
SQL Server Integration Services (SSIS) — Microsoft’s ETL Tool ... 83
Tossing the packages into the projects ... 84
Connecting to data sources ... 85
SSIS Toolbox ... 86
Data transformations... 88
Anything is possible with custom code ... 89
A Simple SSIS Walk-Through ... 89
Exploring Data Generation ... 95
Computers speed everything up... 95
Enterprise Resource Planning (ERP) ... 96
Rise of the machines ... 97
Chapter 6: Turning Data into Information. . . .99
Data Storage for BI ... 100
Data warehouse... 100
Data mart ... 106
Data-storage patterns ... 108
Models, schemas, and patterns ... 110
Understanding SQL Server Reporting Services (SSRS) ... 111
Business Intelligence Developer Studio (BIDS) ... 112
Report Builder ... 114
Getting Familiar with SharePoint ... 115
Excel Services ... 116
PerformancePoint Services for SharePoint ... 117
KPI lists... 119
Dashboards ... 119
Scorecards ... 120
Chapter 7: Data Mining for Information Gold . . . .123
Going Deep with Data Mining ... 124
An algorithm defi ned ... 124
Data mining’s role in the BI process ... 126
Digging In to Data Mining in the Microsoft World ... 126
The Microsoft data-mining process ... 127
Data-mining structures ... 131
Data mining models ... 132
Knowing the Microsoft Data-Mining Tools ... 133
Integrating with Microsoft Offi ce ... 133
Visual Studio ... 135
SQL Server Management Studio ... 139
Part III: Introducing the Microsoft Business Intelligence
Technologies ... 145
Chapter 8: Meeting SQL Server . . . .147
First Contact with SQL Server ... 148
Primary Components of SQL Server ... 149
The SQL Server Database Engine ... 151
SQL Server Reporting Services ... 155
SQL Server Integration Services... 162
SQL Server Analysis Services ... 162
Looking at the Different Versions of SQL Server ... 163
Core editions ... 163
Specialized editions ... 164
Installing SQL Server ... 166
Checking Out SQL Server Tools ... 169
SQL Server Management Studio ... 170
Transact-SQL ... 172
MDX ... 173
Chapter 9: Excel — Digital Data Power to the People . . . .175
Excel as a BI Application ... 176
Generating Data ... 178
Collecting Data ... 179
Getting Organized ... 181
Show Me the Data! — Data Visualization ... 183
Conditional formatting ... 184
Charts and graphs ... 189
Analyzing Data: Pivot on This and Pivot on That ... 191
Using Excel PivotTables ... 191
PivotChart ... 195
Data Mining with Excel ... 197
Using Excel to boss SSAS ... 197
Pulling cube data for PivotTables and PivotCharts ... 200
Keeping Score with the Excel Scorecard ... 205
Knowing the Limits of Excel ... 207
Looking at the Future of Excel ... 209
Chapter 10: SharePoint Shines . . . .211
Getting to Know SharePoint ... 212
What exactly is SharePoint? ... 212
Understanding the versions and editions of SharePoint ... 216
Making BI Information Available in SharePoint ... 218
SSRS integration ... 219
Excel integration ... 220
InfoPath Form Services ... 226
Unleashing Human Business Intelligence with SharePoint ... 229
Offi ce integration ... 236
Learning What Was Added with SharePoint Server 2010 ... 239
Cruising with the Navigation Ribbon ... 240
Providing a more fl uid user experience ... 240
Developing applications with Silverlight ... 241
Integrating visualizations with PowerPoint themes ... 241
Visio Services ... 242
Sorting and fi ltering lists dynamically ... 243
Using Business Connectivity Services... 243
Increasing effi ciency with Offi ce integration ... 243
Taking SharePoint offl ine with SharePoint Workspace... 244
Chapter 11: Expressing Yourself with Development Tools . . . .247
Taking a Look at Visual Studio ... 248
The Visual Studio interface ... 248
Flavors of Visual Studio ... 250
Visual Studio in the BI world ... 255
Examining the .NET Framework ... 259
A language only a computer chip can love ... 259
Intermediate Language (IL) ... 260
The Common Language Runtime (CLR) ... 260
Exploring Report Builder ... 261
Diving In to SQL Server Management Studio ... 263
Getting to Know SharePoint Designer ... 264
Seeing the (Silver)light and Tasting Expression Blend ... 268
Understanding PerformancePoint ... 269
Part IV: Incorporating Microsoft Business Intelligence
into Your Business Environment ... 273
Chapter 12: Setting Your BI Goals and Implementation Plan. . . .275
Setting Your Business Intelligence Goals ... 276
Understanding the components of business goals ... 276
Examining technology goals ... 279
Determining Your Implementation Plan ... 281
Comparing waterfall and iterative methodologies ... 281
Discovering how things really work ... 285
Identifying the power users ... 289
Identifying the data needed to attain your goals ... 290
Setting a solid foundation for a BI implementation ... 291
Scope creep can be your friend ... 292
Chapter 13: Evaluating and Choosing Technologies . . . .297
Assessing Your BI Capabilities ... 298
Identifying your current BI-friendly tools ... 298
Knowing your current licensing ... 303
Determining your current skill sets ... 303
Choosing Technologies to Incorporate ... 306
Understanding your business foundation ... 306
Putting together the BI technology puzzle ... 307
Plugging in the pieces... 308
Utilizing Free BI Tools: Try Before You Buy ... 309
Trying SQL Server ... 311
Checking out SharePoint ... 312
Reducing Risk ... 313
Chapter 14: Testing and Rolling Out . . . .315
Continuously Adding Value ... 316
Testing Your BI Implementation ... 316
BI testing diversity ... 317
Unit testing ... 320
Rolling It Out — Again and Again ... 323
Surfacing information ... 324
Having a BI Management Plan ... 327
Managing Change ... 328
Gaining early adoption ... 329
Transparency is crucial ... 330
Delegating ownership ... 331
Changing business processes ... 332
Introducing new technology without mutiny ... 333
Chapter 15: Training, Using, and Evaluating Results. . . .335
Tackling Training Efforts ... 336
Continuous education ... 336
Enabling self-service training ... 336
SharePoint training resources... 337
SQL Server training resources ... 340
Training users at the grassroots level... 342
Evaluating Results ... 342
Getting feedback with SharePoint ... 343
Incorporating Feedback ... 349
Creating a BI Culture ... 349
Inclusion ... 350
Communication and collaboration ... 350
Part V: The Part of Tens ... 353
Chapter 16: Ten Microsoft BI Implementation Pitfalls . . . .355
Drowning Under the Waterfall ... 356
Getting Stuck on the Shelf(-ware) ... 357
Letting Politics Kill the BI Project ... 358
Ignoring IT ... 358
Disregarding Power Users ... 359
Snubbing Business Processes ... 360
Overpromising Results ... 360
Getting Squashed by Top-Down Decree ... 361
Skimping on the Foundation ... 361
Misjudging How to Use Consultants ... 362
Chapter 17: Ten Keys to Successful
Microsoft Business Intelligence. . . .363
Reiterating an Iterative Approach ... 364
Obtaining Executive-Level Sponsorship ... 365
Assessing Your Current Environment ... 366
Developing an Implementation Plan ... 367
Choosing the Right People for the Implementation Team ... 368
Your in-house team members ... 368
Calling in consultants ... 368
Creating an Inclusive Environment ... 369
Fostering a Culture of Communication and Collaboration ... 370
Starting with the Right Goals ... 371
Reducing Risk ... 371
Maintaining Perspective ... 372
Chapter 18: Ten Ways to Boost Your Bottom Line
with Microsoft Business Intelligence . . . .375
Increasing Effi ciency ... 376
Improving Agility ... 377
Increasing the Visibility of Business Processes ... 378
Forecasting ... 378
Taking Advantage of Existing Skill Sets ... 379
Collaborating and Communicating ... 380
Reusing Code in Various Functional Areas ... 380
Consolidating Content ... 381
Increasing Productivity ... 381
Making Deep Use of SQL Server and SharePoint ... 382
Glossary ... 383
Any fool can make things bigger and more complex. It takes a touch of genius — and a lot of courage — to move in the opposite direction.
I
t’s an old, tired joke among people in the armed services that “military intelligence is a contradiction in terms.” And yet, intelligence in the mili-tary sense — accurate, timely information that can help produce an effective strategy — is more important these days than ever before. As organizations continue to pursue their goals in an economy that seems more like a battle-field, it’s no wonder that they, too, feel the need for reliable information based on real and readily usable data — business intelligence. Unfortunately, gathering intelligence (let alone using it) takes time — which is in short supply, and sometimes the technology that was introduced to help a busi-ness meet its goals just adds to the confusion. Acronyms, obscure phrases, and seemingly unrelated buzzwords proliferate.Hey, even “buzzword” used to be a buzzword, but now it has a Merriam-Webster definition: “an important-sounding, usually technical word or phrase, often of little meaning, used chiefly to impress laymen.” (Wow! I’m impressed.) That is not to say that Microsoft Business Intelligence (BI) is full of technologies that are of little meaning. On the contrary! Microsoft BI is chock-full of some of the most useful software components you will ever use. Microsoft BI, like any other software realm, has a dizzying array of acro-nyms and terms that are used by those who understand the technology. Don’t worry, however. By understanding the needs that the components of Microsoft BI fill within your business environment, you will be well on your way to throwing out acronyms with the best of them.
I resisted the temptation to call this book “Business Intelligence, OLAP, Data Warehouses, Data Marts, SharePoint, SQL Server, SSAS, SSIS, SSRS, PeformancePoint, ERP, CRM, .NET, Windows Server, Silverlight, Visual Studio, IIS, ASP.NET… Oh No! Say It Ain’t So, Joe!” And not just because all that won’t fit on the cover. The simple truth is that Microsoft BI is so much more than just understanding the language of acronyms. Microsoft BI is about taking best-of-breed business practices and matching them up with the technologies that will unlock their potential.
that brought business intelligence into existence remains: How do you turn raw data into a usable, reliable, timely information resource?
Well, I believe you can make a solid move in that direction by getting to know and use Microsoft Business Intelligence — a set of tools offered by those famous folks in Redmond to help you create that information resource — and maybe just transform your organization (while you’re at it) into a strategic powerhouse.
Don’t worry — by the end of this book you’ll have a solid understanding of what each of these terms mean and how they fit into the big picture of Microsoft Business Intelligence. (You may even be calling it by its nickname, “Microsoft BI — pronounced bee-eye, not bye.”)
After reading this book you will have a solid grasp on not only the acronyms for Microsoft BI but how it can be a tremendously valuable tool that can turn the mountains of data flowing through your organization into real and action-able information that will allow you to run your business in a more intelligent
fashion.
About This Book
This book is about turning down the buzz and peering into a way to run your business more intelligently — on the basis of fresh, relevant data, ready to use and efficiently delivered.
This book introduces Microsoft Business Intelligence as a viable tool for building this utopia business vision. Sure, without guidance the technolo-gies, stratetechnolo-gies, and concepts can seem complex and confusing, but my goal here is to give you a clear picture of what Microsoft Business Intelligence is, what it can do, and how to master the knack of implementing a Microsoft BI system. My hope is that when you finish reading, you’ll have a good handle on the topic — and a useful direction in which to yank. The potential benefits to your organization include a more competitive position in the modern busi-ness landscape — for openers.
How to Use This Book
of the puzzle. If you are already familiar with the big Microsoft BI picture, then feel free to jump around. If you not, progressing through the chapters in order would probably be the safest bet.
How This Book Is Organized
Back when I started grad school, some professors used to start their courses by slinging terminology around that few of us understood, as if expecting everybody to catch up by floundering around. I found that the best profes-sors would start at the beginning, building up the terminology and ideas as they went along. Then the discussions were better; the whole experience was better. I always appreciated that approach, so that’s how I’ve organized this book (and, as you’ll see, it’s highly compatible with business intelligence). I start off like those great profs of mine . . . from the beginning.
Keeping in mind that business tools were developed to solve real business problems, this book presents both the problems and the Microsoft BI solutions that address them. Armed with this knowledge, you can examine the current state of your business and determine what problems you really face — and what BI tools can help you create real solutions. The idea is to get familiar with the toolbox, and then pick the right tool for the job.
Part I: Embracing a Microsoft Business
Intelligence Solution
Part I lays out the fundamental concepts behind business intelligence, and uses the Microsoft BI capabilities as consistent examples. Chapter 1 provides a bird’s-eye view of the Microsoft BI and what it offers. Chapter 2 looks at data as the blood running through the veins of modern business — and how Microsoft BI gets it to where it’s needed. Finally, Chapter 3 outlines the pro-cess involved in adopting a Microsoft BI solution.
Part II: Wrapping Your Head Around
Business Intelligence Concepts
generation and collection of data from the vast tentacles of an organization. Chapter 6 walks you through turning data into information using visualiza-tions and analysis. Finally, Chapter 7 talks about the Microsoft Data Mining technology and how it can be used to help you gain a key edge in a competi-tive business landscape.
Part III: Introducing the Microsoft
Business Intelligence Technologies
Part III of this book discusses the technologies — the products, features, and capabilities — that make up Microsoft Business Intelligence. Chapter 8 walks you through the expansive SQL Server product, which functions as one of the two main components of Microsoft BI. Chapter 9 explores how Microsoft Excel can be used as a BI tool (instead of as a source of ungainly mutant spread-sheets full of conflicting versions of the same data). Chapter 10 examines SharePoint — the other main component of Microsoft BI — and its potential to transform an organization’s way of doing business. Finally, Chapter 11 takes you on a tour of the tools available for developing and customizing the capa-bilities of Microsoft Business Intelligence to fit your business needs.
Part IV: Incorporating Microsoft
Business Intelligence into Your
Business Environment
Part IV of this book is where the rubber meets the road — or at least where the driver gets out the roadmap and locates the path to a new place: putting Microsoft Business Intelligence to work. Chapter 12 guides you through set-ting your goals for business intelligence and coming up with an implementa-tion plan. Chapter 13 provides an outline for evaluating and choosing the BI tools that are right for your organization. Chapter 14 covers the testing and rollout phases of a BI implementation (a lot less stressful than rolling out a new jet). Finally, Chapter 15 discusses how to train your people, get them on the side of your new system, and start using business intelligence as a new way of working.
Part V: The Part of Tens
get the most out of Microsoft Business Intelligence. Chapter 16 outlines the ten most common pitfalls to watch out for when you implement Microsoft Business Intelligence. Chapter 17 lists the ten keys to BI success that every implementation should follow. Most importantly, Chapter 18 discusses ten ways you can use a Microsoft Business Intelligence system to boost your bottom line.
Icons Used In This Book
The familiar For Dummies icons offer visual clues about the material con-tained within this book. Look for the following icons throughout the chapters:
Whenever you see a Tip icon, take note and pay particular attention. It’s a nugget I’ve dug up from years of involvement with Microsoft Business Intelligence, offered up to help out with your BI decision-making.
Get out your notebook whenever you see a Remember icon (or get out the highlighter if that’s what worked for you in school). I point out key con-cepts that you should remember as we walk through Microsoft Business Intelligence. And here’s your first thing to remember: There is an online cheat sheet for this book that you can find at www.dummies.com/cheatsheet/ microsoftbusinessintelligence.
Throughout my consulting career, I’ve stepped on the business equivalent of land mines that have blown projects all to bits. Luckily, I’ve always had a good team, and we were able to glue the pieces back together. Pay particular attention when you see a “bomb” Warning icon — you don’t want to explode a piece of your budget.
Let’s Get Started!
Embracing a Microsoft
Business Intelligence
Y
ou’ve heard the buzz about Microsoft Business Intelligence and how it can conquer the mountains of data your business generates. Terms (or, more aptly, buzzwords) and acronyms are thrown around that sound very innovative and advanced, but what do they really mean? How can you “mine” your data for the nuggets of information that will keep your business ahead of other businesses in an ever-changing economic environment?Surveying Microsoft Business
Intelligence from 50,000 Feet
In This Chapter
▶ Getting a handle on Microsoft Business Intelligence
▶ Looking at the components of the Microsoft BI core platform
▶ Identifying Microsoft BI tools and features
▶ Customizing and developing Microsoft BI capabilities
If you cannot explain it simply, you do not understand it well enough.
— Albert Einstein
I
n the vast world of technology-inspired buzzwords and jargon, it’s easy to get dazed and confused and give up hope. Business intelligence (which, throughout this book, I’ll also refer to as simply “BI”) is no exception; I recently heard a complaint that the alphabet soup of Microsoft BI terminology is down-right overwhelming. Fear not! This chapter gives you a bird’s-eye view of the products and capabilities that make up Microsoft Business Intelligence.You also find out how to speak Microsoft BI and gain an understanding of these coded sounds and acronyms that make up the language. You can then decipher the hype and draw your own conclusions about the role Microsoft BI plays in your organization.
Introducing Microsoft Business
Intelligence
tried to build some very simple reports — but couldn’t transform the data into what we needed. Getting that job done would take more than a year of bureaucracy and requests. We were stuck and desperate.
We met with a manager who was already turning out the kinds of reports we needed. He had a computer under his desk running a trial version of SQL Server — and was using that product’s BI features to pull data from the database, transform it, and report on it. It was an eye-opening experience for me: This guy, with a free trial version of one Microsoft product, put together an impressive result while our team of professionals — highly paid, highly trained, using some of the best software on the market — struggled. The world just didn’t seem right! From that day on, I vowed to figure out what Microsoft BI was all about; in this book, I share with you what I found out.
Knowing the components of Microsoft BI
Microsoft BI combines BI concepts with the built-in features of SQL Server, SharePoint, and Office products and makes those concepts happen. As Microsoft technology advances, the company has taken a head-on approach improving business intelligence — working relentlessly to make its products understandable and easy to use. The three mainstays of Microsoft BI are these primary components (illustrated in Figure 1-1):
✓ A core set of data tools and reporting features that are part of Microsoft SQL Server.
✓ The Microsoft Office products and SharePoint technology.
✓ A set of development tools that developers can use to customize and enhance Microsoft BI capabilities.
Figure 1-1:
Many organizations have already paid for the licensing that enables them to use SQL Server, SharePoint, and many of the Microsoft Office products. Before you worry about a large cash outlay for licensing, check with your company’s IT department to find out if you already have the technology you need for BI!
Tracing the terminology
Having worked in consulting for many years, I constantly walk into new situ-ations and corporate cultures where I’m bombarded with acronyms and terms that make little sense to me (at first, anyway). I’ve noticed that when a group of people work closely together and have a common goal, they can easily create what sounds like an alien language. Okay, I’m just as guilty as the next person. Working with a new client, before long I find myself shorten-ing the names of systems and processes to acronyms and then shortened again to, um, utterances (they’re not exactly “words” most of us would use in a conversation). Rattling off these sounds can baffle an outsider: “You should use SSIS to ETL into a data warehouse so you can use SSRS and SSAS to sur-face data to MOSS.” Say what?! Hint: “Surface” is a verb here. The rest is in Martian. (Kidding. But just barely.)
Here’s a partial translation with some good news. Microsoft terminology often describes its products in terms of their specific features — until those features start to seem like separate products. So, for example, you may hear a lot about SQL Server Reporting Services (often shortened to SSRS, SRS, or even RS) and wonder whether you have to buy a separate license for it. Good news: You don’t. SSRS is part of Microsoft SQL Server; if you own SQL Server, you already own this data-reporting capability. At the technical level, SSRS can send queries to gather data from other Microsoft products, as well as many different data sources that include such database products as Oracle, PostgreSQL, MySQL, TERADATA, SAP, and IBM DB2, just to name a few.
Microsoft has been sharpening its approach to business intelligence, con-solidating products into an overall roadmap that simplifies the adoption and management of BI for its customers. For example, the company discontinued a former stand-alone product called PerformancePoint Server and added it to the latest release of Microsoft SharePoint. The term SharePoint is also often misunderstood. SharePoint will be covered in Chapter 10 but you should be aware that SharePoint includes many different features that often sound like their own products (and sometimes were their own products in a past life as is the case with PerformancePoint).
So, if you check with your IT gurus and find that your organization already owns Microsoft Business Intelligence technology, the next step is
Getting to the Core of Microsoft BI
The core of Microsoft BI consists of the components that make up Microsoft SQL Server, as shown in Figure 1-2.
Figure 1-2:
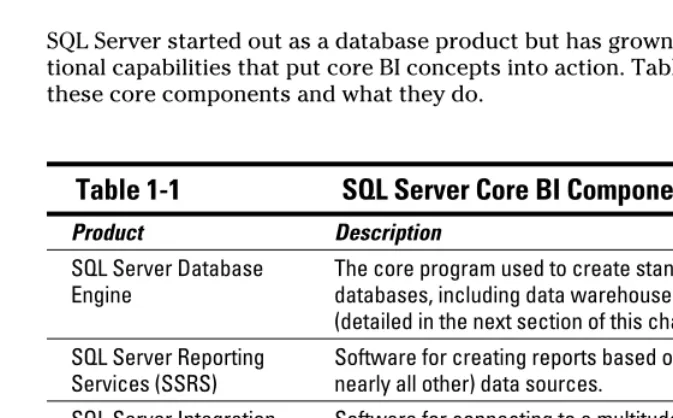
The core components of the SQL Server product.
SQL Server started out as a database product but has grown to include addi-tional capabilities that put core BI concepts into action. Table 1-1 outlines these core components and what they do.
Table 1-1
SQL Server Core BI Components
Product Description
SQL Server Database Engine
The core program used to create standard relational databases, including data warehouses and data marts (detailed in the next section of this chapter).
SQL Server Reporting Services (SSRS)
Software for creating reports based on Microsoft (and nearly all other) data sources.
SQL Server Integration Services (SSIS)
Software for connecting to a multitude of data sources, transforming the data into a single useful format, and loading it into a Microsoft SQL Server database — all using the ETL (Extract, Transform, and Load) process detailed in Chapter 5.
SQL Server Analysis Services (SSAS)
Date warehousing and data marts
Although computer systems help solve many problems in business, they use so many different kinds of programs that they can’t always communicate easily with each other. A tremendous number of systems make up a modern organization — payroll, accounting, expenses, time, inventory, sales, cus-tomer relations, software licensing, and so on. Many of these systems have their own databases and ways of storing data. Combining data from the tangle of systems — let alone doing something useful with the combined data — becomes extremely difficult.
Business intelligence creates a “big picture” by storing and organizing data from many disparate systems in one usable format. The idea is to make the data readily accessible for reporting, analysis, and planning. A data ware-house is a central database created for just that purpose: making the data from all those sources useful and accessible for the organization. The idea is to give decision-makers the information they need for making critical busi-ness decisions.
A data mart is a more specialized tool with a similar purpose; it’s a functional database that pulls particular information out of the overall Data Warehouse (or even directly from source systems depending on who you ask) to answer specific queries. For example, a manufacturing location may need to compile some specialized data unique to the process used to make a particular product. The overall data warehouse is too big and complex do that job (or to modify effectively to handle it), so a smaller version — in BI lingo, a data mart — can be created for this one manufacturing location.
The Microsoft SQL Server Database Engine manages not only data ware-houses, but also data marts — and both types of data storage can become massive. Fortunately, SQL Server addresses this problem by storing one database across a cluster of many different servers. This approach accommo-dates the enterprise as it grows in scale.
Reporting on data
SSRS has features that can make your reports as fancy as you like — gauges, charts, graphs, aggregates, and many other snazzy ways to visualize the data. Check out more information on SSRS and reporting in Chapter 8.
Integrating data from many sources
The many different systems and processes that make up an organization create data in all shapes and forms. This data usually ends up stored in the individual systems that generated it — but without any standard format. Fortunately, SQL Server has a component — SQL Server Integration Services (SSIS) — that can connect to these many different data sources and pull the data back into the central data warehouse. As the data moves from the source systems to the Data Warehouse, SSIS can also transform it into a stan-dard useful format. The whole process is known as Extract, Transform, and Load (ETL), and there’s more about it in Chapter 6.
Analyzing data
As you can imagine, the amount of data contained in a modern business is enormous. If the data were very small, you could simply use Microsoft Excel and perform all of the ad-hoc analysis you need with a Pivot Table. However, when the rows of data reach into the billions, Excel is not capable of handling the analysis on its own. For these massive databases, a concept called OnLine Analytical Process (OLAP) is required. Microsoft’s implementation of OLAP is called SQL Server Analysis Services (SSAS), which I cover in detail in Chapter 8.
If you’ve used Excel Pivot Tables before, think of OLAP as essentially a mas-sive Pivot Table with hundreds of possible pivot points and billions of rows of data. A Pivot Table allows you to re-order and sum your data based on dif-ferent criteria. For example, you may want to see your sales broken down by region, product, and sales rep one minute and then quickly re-order the group-ings to include product category, state, and store.
In Excel 2010 there is a new featured called PowerPivot that brings OLAP to your desktop. PowerPivot allows you to pull in millions of rows of data and work with it just like you would a smaller set of data. After you get your Excel sheet how you want it, you can upload it to a SharePoint 2010 site and share it with the rest of your organization.
With PowerPivot you are building your own Cubes right on your desktop using Excel. If you use PowerPivot, you can brag to your friends and family that you are an OLAP developer. Just don’t tell them you are simply using Excel and Microsoft did some magic under the covers.
Data mining
Computers can be programmed to sort through enormous amounts of data looking for patterns. It’s an exciting new frontier that goes by many differ-ent names — in business, the most common ones are data mining, predic-tive analytics, and machine learning — but this book sticks to “data mining”. (Microsoft SSAS has a number of data-mining algorithms that I explain in detail in Chapter 7.)
The Microsoft data-mining algorithms are part of SQL Server Analysis Services, but you don’t have to be a super computer ninja to access and use them. Microsoft offers a free Excel Data Mining Add-In that transforms Excel into a simple, intuitive client program for the SSAS data-mining algorithms (Chapter 9 has more about using Excel in data mining).
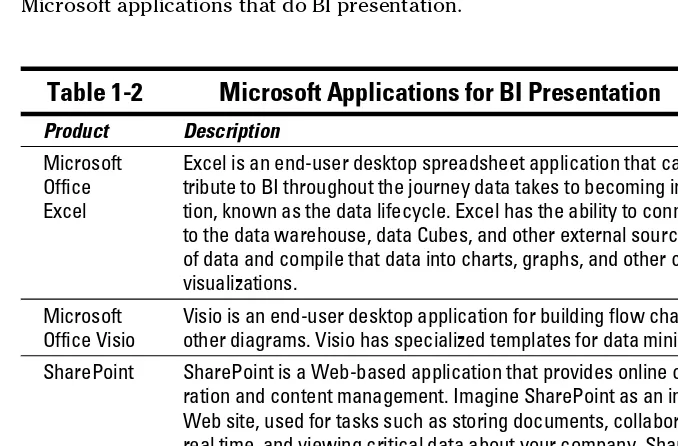
Microsoft BI Data Presentation
Microsoft provides BI data-presentation capabilities in its Office and Server products — mainly by consolidating stand-alone products into larger units that are easier to manage conceptually. For example, PerformancePoint Server (formerly a stand-alone product) became part of SharePoint as a feature called SharePoint PerformancePoint Services. Table 1-2 lists the Microsoft applications that do BI presentation.
Table 1-2
Microsoft Applications for BI Presentation
Product Description
Microsoft Office Excel
Excel is an end-user desktop spreadsheet application that can con-tribute to BI throughout the journey data takes to becoming informa-tion, known as the data lifecycle. Excel has the ability to connect to the data warehouse, data Cubes, and other external sources of data and compile that data into charts, graphs, and other cool visualizations.
Microsoft Office Visio
Visio is an end-user desktop application for building flow charts and other diagrams. Visio has specialized templates for data mining. SharePoint SharePoint is a Web-based application that provides online
Microsoft Office Excel
As one of the most widely used Microsoft Office products, the Excel spread-sheet program is designed to organize, analyze, and visualize data. Excel is one of the most powerful desktop applications in the Microsoft BI arsenal.
An analysis tool for everyone
Excel is such a popular data tool that most of the client organizations I visit use it to run some critical portion of their business. One good reason is that Excel can be installed on a local computer with no need for administrators and servers.
The Data Mining Add-in
Microsoft creates Add-ins (new sets of capabilities) as a way to expand what its products can do; the Data Mining Add-in allows the Excel program running on your local computer to serve as a data-mining resource for SQL Server Analysis Services. You can run SSAS Data Mining algorithms using data that resides in Excel cells to yield important information about your business.
Microsoft Office Visio
The general idea behind Visio is to create flow charts — and to publish these documents to the Web as interactive diagrams with drill-down capabilities (users can click their way down to specific data). Microsoft offers a Data Mining Add-In for Visio that allows users to create interactive documents with real inlaid data. For example, a decision tree can be published to the Web with actual business data built in. When users go to the Web site con-taining that document, they can click a decision to view its results. (For more about Visio and its Data Mining Add-in, see Chapter 7.)
Microsoft SharePoint
Excel Services
Excel Services addresses two primary problems that arise among organiza-tions that use Excel extensively:
✓ When individual members of an organization become adept at using Excel, they often come up with custom spreadsheets that perform spe-cific tasks very well but can be difficult for others to use. A customized spreadsheet can become so unwieldy that nobody (often even the origi-nal creator) understands how it works or how to update it.
✓ One original file can spawn hundreds of mutations as it’s passed from person to person, e-mailed around, and modified slightly in between. Eventually no one can be sure which version of the Excel document is the “correct” one, and which versions have been changed, updated, or even tampered with.
SharePoint Excel Services addresses both problems by allowing an Excel document to be posted to a SharePoint Web site. Only one version of that Excel document can be viewed by users who have access to the SharePoint Web site. You can maintain security on the document by limiting how many users can update the original, and by limiting which users can view it. The actual Excel document appears as embedded in the SharePoint Web site. The entire, actual Excel document (or just a summary or graph from within the document), can form one piece of a larger BI picture that resides on the com-pany’s SharePoint Web site.
The concept of pulling many pieces of key data into a single view on a SharePoint Web site is called dashboarding. On a car dashboard, you have all the critical information about the car (speed, RPM, remaining gasoline, and oil pressure) right in front of you. Similarly, a BI dashboard provides all your criti-cal business information in one easy-to-view location: a dashboard Web site.
PerformancePoint Services
PerformancePoint Services for SharePoint provides scorecarding (that is, a quick chart or scorecard that reports on progress toward goals) as well as dashboarding (that is, a report showing the status of a number of key metrics).
Reporting Services Integration
One of the reasons SharePoint has moved to the center of the organization is that it can manage many different types of content including reports. SQL Server Reporting Services (SSRS) is tightly integrated with SharePoint. In fact, SSRS offers an Integrated Mode that puts the SharePoint server in control of managing all BI reports. As a result, reporting simply becomes another type of content contained within the SharePoint system and sits right along side other documents such as PDF, Word, and Excel as well as many others. The power of an Enterprise Content Management (ECM) system such as SharePoint provides the following benefits for storing reports:
✓ Users have to check the reports in and out.
✓ Document versions are controlled.
✓ Security is integrated into each document.
✓ Reports are embedded directly in SharePoint Web sites.
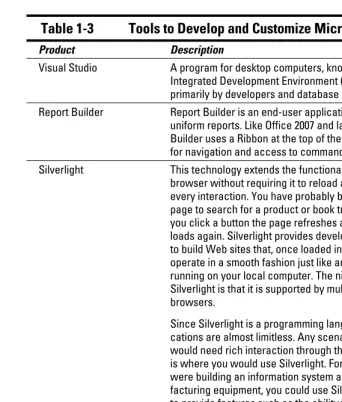
Microsoft BI Development Tools
Microsoft offers two general tools for developing and customizing its prod-ucts’ BI capabilities:
✓ Visual Studio gives the hard-core technical person or super-power–user a way to enhance BI processes and shape them to the needs of a specific business.
SQL Server includes a free version of Visual Studio that’s designed espe-cially for Microsoft BI: Business Intelligence Developer Studio (BIDS).
✓ Report Builder is designed for end users and business analysts; it pro-vides the advantage of uniform reports that work well with Microsoft BI capabilities, regardless of organizational department.
In addition to Visual Studio and Report Builder, Microsoft has a couple of programming languages that are used in BI development. Silverlight is a technology that provides a rich experience through the Web browser, and Microsoft .NET (“dot-NET”) is a framework and programming language designed to run on Microsoft operating systems.
Table 1-3
Tools to Develop and Customize Microsoft BI
Product Description
Visual Studio A program for desktop computers, known as an Integrated Development Environment (IDE) and used primarily by developers and database administrators. Report Builder Report Builder is an end-user application that creates
uniform reports. Like Office 2007 and later, Report Builder uses a Ribbon at the top of the user interface for navigation and access to commands.
Silverlight This technology extends the functionality of a Web browser without requiring it to reload a Web page with every interaction. You have probably browsed to a page to search for a product or book travel. Whenever you click a button the page refreshes and flashes and loads again. Silverlight provides developers the ability to build Web sites that, once loaded in the browser, operate in a smooth fashion just like an application running on your local computer. The nice thing about Silverlight is that it is supported by multiple Web browsers.
Since Silverlight is a programming language its appli-cations are almost limitless. Any scenario where you would need rich interaction through the Web browser is where you would use Silverlight. For example, if you were building an information system about your manu-facturing equipment, you could use Silverlight in order to provide features such as the ability to click on a par-ticular machine part and have the window magically transition into the detailed specifications without the need to flash, reload, and redisplay a new page. Microsoft .NET The Microsoft .NET technology is a programming
framework used by developers to build applications on the Microsoft Windows platform.
Visual Studio
Microsoft has released a version of Visual Studio that includes only its BI components and which installs with the SQL Server product. This allows for BI development without needing the full featured Visual Studio product. When SQL Server installs it looks to see if Visual Studio is already installed on the computer. If it is installed, then it adds the BI functionality to this already installed program. If Visual Studio is not installed, then it installs the BI only version of Visual Studio called BIDS. BIDS stands for Business Intelligence Developer Studio, but in fact it is just Visual Studio with only the BI develop-ment components.
Report Builder
You can imagine, and may have already experienced, how unproductive it can be when business users have to go through the IT team in order to ana-lyze data and build reports. Business users feel that IT doesn’t understand what they are trying to say, and IT feels that business users just don’t get technology. Both sides are probably correct, but that doesn’t help get the right information in the reports and the reports to the right people at the right time. Microsoft has developed a desktop tool called Report Builder to avoid this unproductive process that is as easy to use as Microsoft Word or Outlook. (Check out Chapter 8 for more about Report Builder.)
Silverlight
You may spend much of your time in a Web browser working with various applications. In fact, if you work with SharePoint, then you probably access it through your Microsoft Internet Explorer Web browser. Whenever you open Internet Explorer and work with an application, you are actually using your desktop computer and Internet Explorer as a client to a program that runs on a server.
Microsoft .NET
When Web aficionados hear the term “.NET” (pronounced “dot net”), their first thought is almost always “domain name” extensions tacked on to the names of Web sites to identify Internet domains — .com, .net, or some other domain such as .org. The guess is understandable but wrong. Microsoft .NET is actually a software-development tool; it has nothing to do with the domain names you type into your Web browser.
Blazing a Trail through
the Data Jungle
In This Chapter
▶ Checking out the lifecycle of data in an information world
▶ Understanding Microsoft Business Intelligence’s role in the data lifecycle
▶ Discovering why the right data are more valuable than a lot of data
▶ Making use of the data glut generated by modern computer systems
The fewer data needed, the better the information. And an overload of information, that is, anything much beyond what is truly needed, leads to information blackout. It does not enrich, but impoverishes.
— Peter F. Drucker
I
magine having the humanoid robot Data from Star Trek: The Next Generation as a consultant: A massive database that can sift through all the data ever known and turn it into information that the captain (okay, CEO) can use to make decisions . . . all in a human-friendly package. After he’s spent a few days plugging in to all your computer systems and interviewing your people, you can ask him any question about your organization — and get a useful answer. The perfect business intelligence solution! Hopefully Microsoft is working on that. In the meantime, the present-day Microsoft BI capabilities can do almost as well.Microsoft Business Intelligence capabilities form a system designed to take on those mountains of data, get to the valuable information about your business, and help get that right information to the right person at the right time. When the decision-makers have this information, they know more of what they need to run the business better (even — dare we say it? — close to optimal).
Before launching you into that future, however, this chapter walks you through the data lifecycle — and gives you a working grasp of how Microsoft BI can help turn heaps of raw data into focused, useful information.
Journey with me now into the world of data — in the present!
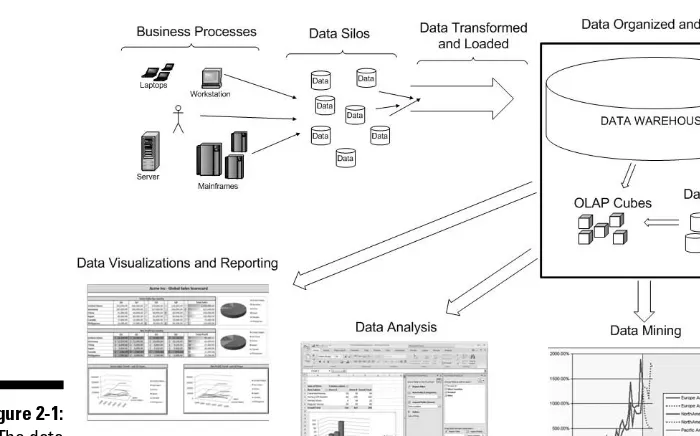
Exploring the Data Lifecycle
Information and data are not the same thing: Data are a raw resource at the center of the business universe; information is born from data, but only after a lot of work. Understanding the data lifecycle — and how Microsoft BI can speed up the work of turning data into information when it’s at the peak of its usefulness — gives your business the fuel it needs for warp-speed efficiency.
The operational processes and systems that make up a business stay busy in three ways: (a) getting things done, (b) generating data, and (c) storing the data they generate. And unless you have a way to get at those data tidbits systematically, there they sit — in the systems that generated them.
Microsoft BI capabilities treat all those disparate systems as sources, pull-ing data from them, transformpull-ing the data so it’s easier to use and present, and storing the data in a central, networked location — a data warehouse. Specialized data-storage devices such as OLAP cubes and data marts also store data, but all these components have a common goal: not just to put the data somewhere, but to make it available to the organization.
OLAP stands for OnLine Analytical Processing. An OLAP cube is a special way to store data that allows end users to sort, group, and analyze massive amounts of data very quickly. Check out Chapter 4 for more about OLAP cubes.
Figure 2-1:
The data lifecycle.
Data generation and collection
Microsoft BI brings together potentially valuable pieces of data from the pro-cesses that run your business, but that’s just the beginning. The next step is to organize the data into a format that offers insight into what’s really hap-pening in the overall business.
Business processes contain pieces of data about specific things, called data points, and often all you need is the means to extract them. Pulling these data points together into a picture, however, helps you evaluate the process. You might, for instance, spot a bottleneck that slows down the entire operation. (Say, final assembly of your electric automobiles has to wait till your balky supplier delivers the needed battery fluid — who knew?) Or a collection of data may tell you that the cost of one ingredient in your company’s new fuel product is outrageous and driving up the total cost of producing it.
Usually these software products also have a reporting mechanism to pro-vide an organized picture of the data they store — but too often the systems designed for particular business practices (say, manufacturing and human resources) don’t communicate with each other. All the data from these sepa-rate systems can create a bigger picture. Posing questions across systems can then yield useful answers about the organization as a whole.
Business processes — the midwife for data
When I talk to executives about business intelligence, I’m often surprised to see how many of them are nearly clueless about the processes that make up their business. Top executives often get used to seeing only results. Ask them how a particular part of their business actually gets done, and you may get a funny look. Hey, it’s understandable — a staggering number of processes make up a typical mid-size or larger business — but even the chief should have a basic understanding of those component processes. (“You mean we actually import battery fluid for the electric cars? I had no idea.”) They’re missing an opportunity to improve how the business runs.
Ongoing business processes (such as Point Of Sale (POS) and Purchasing) are — potentially, anyway — constant sources of raw data (for example, the product sale records for POS, or the price per item or pound records for Purchasing). In this earliest stage of the data lifecycle, those raw bits of fact have some maturing to do before they’re any good to the business as a whole — but first you have to generate them. And that means taking a detailed, documented look at what makes your business tick.
The processes that make up a business are as critical to its health as they are to business intelligence. Inefficient processes can quickly manifest into poorly run businesses, and soon those businesses will be in trouble. Before you can reap the full benefits of BI, you need a good working grasp of your business processes and how you can make them more efficient. For example, is your manufacturing showing constant delays at a particular step? When the process is understood, efficient, and documented, you can go about capturing data.
The end result is that you first need to understand your business processes. Once you understand the processes that make up your business, you need to identify the critical points at which data can be generated. Finally, you need to determine if the data are already being captured, and if not, how to capture it.
usable process data are a step toward that improvement — for example, how much battery fluid do we have to stockpile to keep the electric automobile final assembly going smoothly, and how much warehouse space will it take up?
Collecting that data means intervening in the business process you want to get a handle on — in particular, capturing a metric (that is, a measurement, such as “how much battery fluid do we have on hand, month by month, for our super car final assembly?”). After all, any self-respecting business pro-cess has to be regular enough to be measurable. If all that potential quantita-tive data about a process isn’t captured, it just drifts off into the ether, never to be heard from, used, or analyzed again. Here’s where BI becomes a source of goals — in this case, to capture any data that’s useful in making decisions for your company.
Ways to collect data
There are a number of ways to collect data. The simplest and oldest method is for a person to observe something and write it down on a piece of paper. Then another human can enter this data into a computer system or spread-sheet program such as Excel.
A higher-tech method is for the same human to observe an event in the busi-ness process (say, the whole final assembly of an electric car, up through adding the battery fluid) — poised over a computer. Instead of writing down the data on paper, the observer records it directly into the computer system in a digital format (as text, video, whatever).
An even more advanced method has the person interacting with a computer system from the get-go: The computer program automatically records the interactions and captures data it observes, and the person simply performs his task. For example, a person may be tasked with purchasing supplies for the company. The purchasing system may be computerized so that every purchase is made through the computer and is automatically recorded and cataloged in a database. The person simply performs his task, and the data are captured.
Beyond this point, we get to a method that doesn’t require any human inter-action at all: It’s all done with computers, robots, scanners, conveyer belts, and so on. The task is performed by automation and is recorded in a data-base without any human interaction.
Data generation is, in essence, any point in a process that can be measured and recorded. When you think about all the diverse processes that make up your organization and how many data points would describe each one . . . well . . . let’s just say the amount of data is enormous, and more is coming in all the time. It takes a computer system to turn all that data into information.
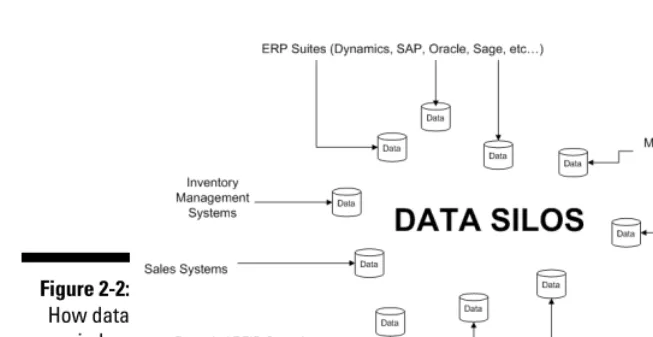
Data collection is all about having a mechanism in place to capture and store the data. Many self-contained computer systems already have such a feature. For example, suppose you purchase a system for tracking the licensing on a software product you’ve developed. The computer program that tracks this licensing stores information in a database as the users interact with the appli-cation. The data, now captured, just sits around in storage, waiting for some-body to use it. This data in disparate system is often referred to as data silos.
Data silos
While I was in graduate school in San Francisco, I attended a lecture by a researcher who was putting the data of his entire life in a digital format. He brought in all of his pictures, notes, and books and scanned them into a database. He inventoried all of his belongings and entered them into the database. He carefully recorded all of his activities on the Web and recorded them in the database. The goal of his project was to understand how people’s lives can be digitized and to exploit how cheap digital storage had become. In the end, this one person had a massive database of his life.
Now imagine the same thing happening with a business. Even a small business generates massive amounts of data as its daily activities go on — enough to dwarf what’s in a database of one human life. That would be enough of a chal-lenge if all those activities stayed exactly the same over time, but business processes change.
You may start a small business by keeping track of your inventory on a pad of paper. As your business and inventory grow, you may install a small soft-ware program on the computer in your office to keep track of your inventory. As you grow even larger and have multiple locations, you may find a special-ized software program that can be installed on a server that multiple people in your company can connect to and interact with. Imagine this sequence of events happening throughout the many pieces of your business as it grows. Before long, a hodgepodge of computer systems, processes, and data-storage mechanisms are all doing their various things within your business — and not talking to each other about what they’re doing. Figure 2-2 shows how data from various business processes becomes isolated over time.
A datasilo is a data-storage mechanism that’s isolated and disconnected from other systems and data. Like an upended cylinder that stores grain on a farm, it’s “standing out in its field” — usually all by itself. For example, your inven-tory software may store its data in a proprietary format that isn’t connected to (or compatible with) the other computer systems that the business uses.
Figure 2-2:
How data wind up in isolated data silos.
It’s true that some of your systems may have been orphaned when the soft-ware companies that created them went out of business, merged with larger companies, or let some of their products die off. Does that mean the data in your legacy systems are unusable? Well, no. You’re in luck for two reasons:
✓ You do not have to replace all your current systems with Microsoft products in order to implement Microsoft BI. Honest.
✓ Microsoft Business Intelligence is designed to turn all the data in those disparate locations — the contents of those data silos out in the boon-docks of your business — into valuable information.
All of which brings up the next phases of the data lifecycle, namely . . .
Data transformation and organization
Data that is scattered around in different systems can answer some specific departmental questions. But isolated data aren’t much use beyond their own little bailiwick. To answer questions that require data from operational systems across the business, you have to implement at least these three BI concepts:
✓ Data warehouses and data marts: These are places where you can bring the data together so it’s easy to access.
A data mart is simply a smaller, specialized data warehouse; it uses the same SQL Server database engine, as described in Chapter 1.
✓ Cleaning: Forget the soap; this means giving the data a single, non-proprietary, usable format, regardless of what system it comes from.
To make these concepts happen, your business needs an organizational structure for the purpose — a massive database built using the Microsoft SQL Server database engine.
Don’t be surprised if you have to run the SQL Server database engine on a cluster of computers, even on many different servers, to create the sort of super-computer-style database that can handle this job.
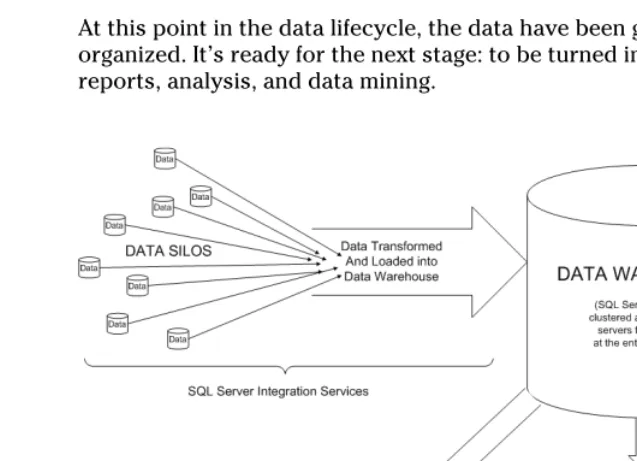
The operational systems throughout the organization have collected data into silos, but it’ll just sit there unless you can get it into the overall data warehouse. The program that handles this chore (and connects to all those disparate databases) is called SQL Server Integration Services (SSIS); it’s included in the Microsoft SQL Server software product.
SSIS communicates with all the different systems, pulls the data out of those systems, transforms it into a standard format, and then loads it into the data warehouse. The transformed data in the warehouse is ready to pull out into specific departmental data stores (data marts) or structures such as OLAP cubes for data analysis, as shown in Figure 2-3.
At this point in the data lifecycle, the data have been gathered together and organized. It’s ready for the next stage: to be turned into information through reports, analysis, and data mining.
Figure 2-3: