by Mark Robinson
SQL Server 2005
Reporting Services
FOR
SQL Server 2005
Reporting Services
FOR
by Mark Robinson
SQL Server 2005
Reporting Services
FOR
111 River Street Hoboken, NJ 07030-5774 www.wiley.com
Copyright © 2006 by Wiley Publishing, Inc., Indianapolis, Indiana Published by Wiley Publishing, Inc., Indianapolis, Indiana Published simultaneously in Canada
No part of this publication may be reproduced, stored in a retrieval system or transmitted in any form or by any means, electronic, mechanical, photocopying, recording, scanning or otherwise, except as permit-ted under Sections 107 or 108 of the 1976 Unipermit-ted States Copyright Act, without either the prior written permission of the Publisher, or authorization through payment of the appropriate per-copy fee to the Copyright Clearance Center, 222 Rosewood Drive, Danvers, MA 01923, (978) 750-8400, fax (978) 646-8600. Requests to the Publisher for permission should be addressed to the Legal Department, Wiley Publishing, Inc., 10475 Crosspoint Blvd., Indianapolis, IN 46256, (317) 572-3447, fax (317) 572-4355, or online at http://www.wiley.com/go/permissions.
Trademarks:Wiley, the Wiley Publishing logo, For Dummies, the Dummies Man logo, A Reference for the Rest of Us!, The Dummies Way, Dummies Daily, The Fun and Easy Way, Dummies.com, and related trade dress are trademarks or registered trademarks of John Wiley & Sons, Inc. and/or its affiliates in the United States and other countries, and may not be used without written permission. Microsoft and SQL Server are trademarks or registered trademarks of Microsoft Corporation in the United States and/or other countries. All other trademarks are the property of their respective owners. Wiley Publishing, Inc., is not associated with any product or vendor mentioned in this book.
LIMIT OF LIABILITY/DISCLAIMER OF WARRANTY: THE PUBLISHER AND THE AUTHOR MAKE NO REP-RESENTATIONS OR WARRANTIES WITH RESPECT TO THE ACCURACY OR COMPLETENESS OF THE CONTENTS OF THIS WORK AND SPECIFICALLY DISCLAIM ALL WARRANTIES, INCLUDING WITHOUT LIMITATION WARRANTIES OF FITNESS FOR A PARTICULAR PURPOSE. NO WARRANTY MAY BE CREATED OR EXTENDED BY SALES OR PROMOTIONAL MATERIALS. THE ADVICE AND STRATEGIES CONTAINED HEREIN MAY NOT BE SUITABLE FOR EVERY SITUATION. THIS WORK IS SOLD WITH THE UNDER-STANDING THAT THE PUBLISHER IS NOT ENGAGED IN RENDERING LEGAL, ACCOUNTING, OR OTHER PROFESSIONAL SERVICES. IF PROFESSIONAL ASSISTANCE IS REQUIRED, THE SERVICES OF A COM-PETENT PROFESSIONAL PERSON SHOULD BE SOUGHT. NEITHER THE PUBLISHER NOR THE AUTHOR SHALL BE LIABLE FOR DAMAGES ARISING HEREFROM. THE FACT THAT AN ORGANIZATION OR WEBSITE IS REFERRED TO IN THIS WORK AS A CITATION AND/OR A POTENTIAL SOURCE OF FURTHER INFORMATION DOES NOT MEAN THAT THE AUTHOR OR THE PUBLISHER ENDORSES THE INFORMA-TION THE ORGANIZAINFORMA-TION OR WEBSITE MAY PROVIDE OR RECOMMENDAINFORMA-TIONS IT MAY MAKE. FURTHER, READERS SHOULD BE AWARE THAT INTERNET WEBSITES LISTED IN THIS WORK MAY HAVE CHANGED OR DISAPPEARED BETWEEN WHEN THIS WORK WAS WRITTEN AND WHEN IT IS READ.
For general information on our other products and services, please contact our Customer Care Department within the U.S. at 800-762-2974, outside the U.S. at 317-572-3993, or fax 317-572-4002. For technical support, please visit www.wiley.com/techsupport.
Wiley also publishes its books in a variety of electronic formats. Some content that appears in print may not be available in electronic books.
Library of Congress Control Number: 2005927722 ISBN-13: 978-0-7645-8913-3
ISBN-10: 0-7645-8913-X
Manufactured in the United States of America 10 9 8 7 6 5 4 3 2 1
Mark Robinsonhas been active in the field of business intelligence since the early 1980s. He is current directing the business intelligence (BI) practice at Greenbrier & Russel, a business and technology consulting services company and a gold BI partner with Microsoft. For the last two years, he has participated quarterly in the Microsoft BI Partner Advisory Council meetings in Seattle where he has mingled with developers, partners, trainers and marketing professionals and has provided input into the direction of SQL Server 2005. He has been involved in selling and delivering BI solutions involving the Microsoft SQL Server platform as long as SQL Server has been a product.
As a consultant, Mark has worked side by side with some of the pioneers in the field of decision support and business intelligence. He has been communicat-ing the value of business intelligence in executcommunicat-ing on the business strategy to his customers over the past twenty years. He has been involved in over fifty implementations covering a wide range of reporting and analysis tools. He has written many articles on a variety of topics including what business manage-ment should know about data warehousing as well as what the future holds for business intelligence.
Mark is a veteran of reporting and analysis solutions that deliver significant business value to his customers. During his experience in business and tech-nology fields, he has performed various leadership roles performing traditional leadership roles in IT management, product management and practice manage-ment. Mark has led practices for a variety of consulting services companies in Emerging Technologies, eCommerce Solutions and Business Intelligence. He has led companies in strategic transformation efforts via investments in business intelligence. He has worked for and consulted to financial services institutions (insurance and banking), retailers, manufacturers, healthcare providers, software and technology services companies, and professional services firms with an emphasis on technology solution strategy, architec-ture, and delivery. He currently serves in a strategist role in the architecarchitec-ture, design and delivery of business intelligence solutions for his clients.
After receiving a B.A. in physics from the University of Chicago, he enrolled in the business school and received his MBA from the University of Chicago in the following year. Thinking he was well trained in operations research and finance, he began his business experience in new business development at Corning in 1979. When IBM came out with the first personal computer in 1982, he switched his focus and joined up with Andersen Consulting (now known as Accenture). He has been on the business and technology track ever since. His work experience has spanned software vendor companies (Softbridge and Hyperion), a business technology group at Baxter Healthcare as well as other consulting firms (Computer Power Group, Parian, Cysive and marchFIRST).
A veritable army of people contributed their time and energy toward the pub-lication of this book. I may have achieved some sort of record in terms of the number of people involved in this project at Wiley. During this quest, I have worked with a pair of each of the key coordinating roles — acquisitions edi-tors, project ediedi-tors, copy editors and technical editors. My initial contact at Wiley, acquisitions editor Terri Varveris, was extremely helpful in coordinating the right resources and getting me started down the right path. As part of this process, I have developed working relationships with many new people and feel that everyone involved has helped to improve the content of this book.
Some of the people who helped bring this book to market include the following:
Acquisitions, Editorial, and Media Development
Project Editor:Christine Berman
Acquisitions Editors:Terri Varveris, Tiffany Franklin
Copy Editor:Christine Berman
Technical Editor:Dan Meyers
Editorial Manager:Jodi Jensen
Media Development Supervisor:Richard Graves
Editorial Assistant:Amanda Foxworth
Cartoons:Rich Tennant (www.the5thwave.com)
Composition Services
Project Coordinator: Jennifer Theriot
Layout and Graphics: Andrea Dahl, Joyce Haughey, Barbara Moore, Barry Offringa, Heather Ryan
Proofreaders:Leeann Harney, Jessica Kramer, TECHBOOKS Production Services
Indexer: TECHBOOKS Production Services
Publishing and Editorial for Technology Dummies
Richard Swadley,Vice President and Executive Group Publisher
Andy Cummings,Vice President and Publisher
Mary Bednarek,Executive Acquisitions Director
Mary C. Corder,Editorial Director
Publishing for Consumer Dummies
Diane Graves Steele,Vice President and Publisher
Joyce Pepple,Acquisitions Director
Composition Services
Gerry Fahey,Vice President of Production Services
Introduction ...1
Part I: Just the Basics...8
Chapter 1: Getting Familiar with Reporting Services ...9
Chapter 2: Retrieving Data from a Database...29
Chapter 3: Building and Running a Simple Report...47
Part II: Building Reports — Your Creativity Options ...63
Chapter 4: We’re Off to See the Wizard...65
Chapter 5: Styling with Report Types ...71
Chapter 6: Accessorizing Your Reports...93
Chapter 7: Reporting with Parameters and Format Options ...117
Chapter 8: Using Report Builder ...139
Part III: Publishing, Accessing, and
Subscribing to Reports ...155
Chapter 9: Publish or Perish — Getting the Report Out ...157
Chapter 10: Executing and Accessing Reports on Demand ...181
Chapter 11: Delivering Your Reports ...201
Part IV: Maintaining Your Reports ...225
Chapter 12: Managing and Administering Your Reports...227
Chapter 13: Securing Report Server ...245
Chapter 14: Optimizing Report Performance ...257
Part V: Developing Advanced Reports...271
Chapter 15: More About Interactive Reporting ...273
Chapter 16: Drilling Down to the Details ...289
Chapter 17: Reporting from OLAP Data Sources...307
Chapter 18: Helping Executives See the Big Business Picture ...323
Part VI: Migrating from Other Reporting Tools ...339
Chapter 19: Comparing Reporting Services to Other Popular Reporting Tools ....341
Chapter 22: Ten Ways to Hook Into the Microsoft BI Platform...375
Chapter 23: Ten Places to Find Reporting Services Support...379
Chapter 24: Ten Third Party Tools to Use with Reporting Services ...383
Introduction...1
How This Book Is Organized...2
Part I: Just the Basics...2
Part II: Building Reports — Your Creativity Options ...3
Part III: Publishing, Accessing, and Subscribing to Reports...3
Part IV: Maintaining Your Reports...4
Part V: Developing Advanced Reports ...4
Part VI: Migrating from Other Reporting Tools ...4
Part VII: The Part of Tens ...5
How to Use This Book ...5
Foolish Assumptions I Make about You ...5
Icons Used in This Book...6
Getting Started ...6
Part I: Just the Basics ...8
Chapter 1: Getting Familiar with Reporting Services . . . .9
Dealing with Reporting Challenges...10
Mastering Reporting Principles...11
Presenting the right information ...11
Using the right medium ...12
Presenting to the right audience ...13
Offering the right content and design...13
Providing the right security ...14
Investigating Business Data ...15
Uncovering the Major Features of Reporting Services ...15
It’s a Web service...16
Working with the design surface ...16
Connecting to a data source ...17
Creating the layout...18
Using expressions and formulas...18
Filtering, sorting, and grouping ...18
Defining parameters...19
Navigating and fact-seeking ...19
Formatting the content...20
Saving a report...21
Displaying a report...21
Managing reports ...22
Securing a report ...22
Accessing and Looking at Reports...23
Printed reports versus online reports...24
Viewing a report ...24
Chapter 2: Retrieving Data from a Database . . . .29
Discovering What Makes a Database...29
Keying In on Your Data ...30
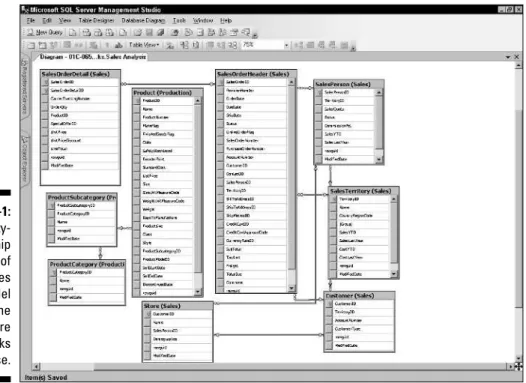
Striking up a Relationship with Your Data ...31
Building a SQL Query...33
Being SELECTive...33
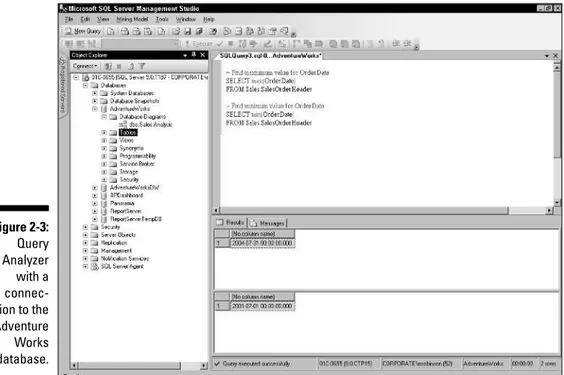
Follow along with SQL Server Query Analyzer...34
WHERE you join the party...37
ORDER in the court ...39
GROUP BY for subtotals ...39
HAVING for filtering...40
Respecting the stored procedures ...42
Chapter 3: Building and Running a Simple Report . . . .47
Facing Down the BI Development Studio ...48
Working with Your Reporting Project...49
Establishing a shared data source ...50
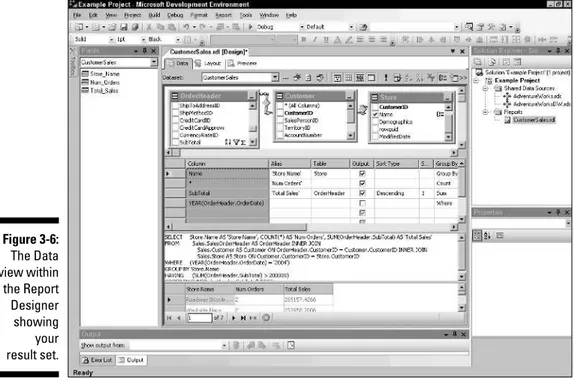
Welcome to the Report Designer...52
Working with your data ...53
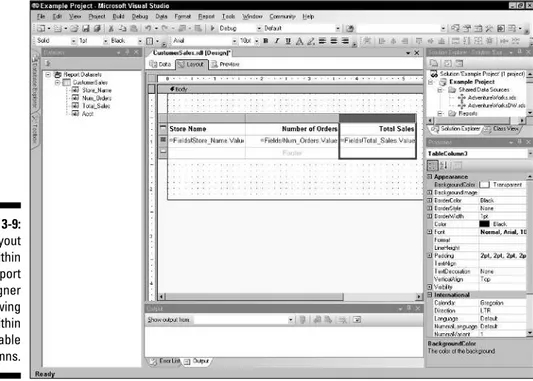
Sketching out your design layout...56
Modifying Your Report ...59
Formatting in Layout view ...59
Saving your report...62
Printing the report ...62
Part II: Building Reports — Your Creativity Options ...63
Chapter 4: We’re Off to See the Wizard . . . .65
Accessing the Wizard ...65
Establishing the Data Source...66
Querying the Data ...67
Designing the Table and Styles...69
Laying Out the Report — Layout and Style ...69
Chapter 5: Styling with Report Types . . . .71
Report Design Surface ...71
Using your toolbox in the workshop ...71
Interacting with datasets...73
Working with Data Regions and Other Report Items...74
Setting report item properties...74
Using tables for tabular display ...78
Using a matrix for cross tabs ...79
Using rectangles for separate reports ...80
Using lists ...81
Using subreports for containers ...82
Using lines for formatting...82
Using images for logos...83
Using charts for visualization ...86
Chapter 6: Accessorizing Your Reports . . . .93
Sorting, Grouping, and Filtering ...94
Sorting and filtering report data...94
Grouping related fields ...97
Nested groupings...99
Groupings with other data regions ...102
Grouping with matrix controls ...103
Adding a column grouping to a matrix ...105
Grouping with list controls ...106
Using nested lists ...108
Sorting and grouping with charts...110
Filtering data in reports...113
Chapter 7: Reporting with Parameters and Format Options . . . .117
Using Expressions ...118
Aggregate functions ...118
Adding calculated columns to a report ...120
Discovering How to Use Parameters ...122
Report parameters ...122
Query parameters ...123
Using parameters in a report ...123
Using cascading parameters in a report ...128
Formatting Reports...131
Headers and footers...131
Paginating reports — Is that legal? ...133
Sizing the page ...134
Creating multi-column reports ...134
Using expressions in formatting reports...135
Custom code ...137
Chapter 8: Using Report Builder . . . .139
Creating a Report Model ...140
Creating a model project ...140
Defining a data source ...140
Creating a data source view ...142
Define a report model for ad hoc analysis ...143
Working with the Report Builder ...146
Launching Report Builder ...147
Creating reports in Report Builder ...147
Sorting, grouping, and totaling with Report Builder...150
Drill-down analysis with Report Builder ...151
Publishing Report Builder Reports to Report Manager...154
Part III: Publishing, Accessing, and
Subscribing to Reports...155
Chapter 9: Publish or Perish — Getting the Report Out . . . .157
Deploying Reports ...157
Deploying a report from Report Designer...158
Saving a report from Report Builder...159
Introducing the Report Manager...159
Accessing the Report Manager...159
Uploading a report to Report Manager ...160
Viewing a report in Report Manager...161
Getting Around in Report Manager...163
The Report toolbar...163
Printing a report ...164
Exporting Reports to Other Formats...165
Design Considerations for Each Rendering Extension...167
Archiving Reports ...177
Saving reports to create an archive ...177
Saving report history ...177
Out of site: Server-level properties ...179
Chapter 10: Executing and Accessing Reports on Demand . . . .181
Understanding the Pull Model...181
Types of reports: published, intermediate, and rendered ...182
Executing with the latest data ...182
Saving Your Cache...184
Working with the session cache ...185
Creating with the cached instance...185
Considering query parameters with cached instance...186
Considering filters with cached instance...186
Configuring a cached instance ...186
Organizing Snapshots ...188
Creating a snapshot ...189
Using query parameters in your snapshots ...190
Using filters in your snapshots...192
Creating a Historical Perspective...193
Creating report history...193
Creating snapshots in report history ...195
Modifying properties and deleting report history ...197
Rendering history as a URL...198
Summary of Report Execution Methods ...199
Chapter 11: Delivering Your Reports . . . .201
Automating the Delivery of Reports...202
Accessing subscriptions...203
Getting Familiar with Subscription Components...204
Working with e-mail delivery ...204
Working with fileshare delivery...205
Selecting a rendering format...205
Specifying execution conditions ...206
Specifying execution parameters ...206
Creating Standard Subscriptions ...207
Creating a standard subscription...207
Creating Data-Driven Subscriptions ...210
Supporting a fluctuating list of subscribers ...212
Fileshare delivery of data-driven subscriptions...214
E-mail delivery of data-driven subscriptions...217
Null delivery of data-driven subscriptions ...218
Using Subscription for Common Business Scenarios ...220
Preloading a snapshot report ...220
Providing access to latest reports in a file directory ...220
Broadcasting exception reports ...220
Bursting reports ...221
Maintaining Your Subscriptions ...221
Working with inactive subscriptions ...221
Execution mode modifications and subscription processing ...222
Managing subscriptions with My Subscriptions ...222
Configuring Subscription Processing ...222
Part IV: Maintaining Your Reports...225
Chapter 12: Managing and Administering Your Reports . . . .227
Managing Your Reports ...228
Using Management Studio...228
Using Report Manager ...230
Uploading files ...232
Moving files ...234
Using linked reports...234
Navigating hierarchies in Report Manager ...236
Working with the My Reports folder...236
Administering Reporting Services ...237
Applying timeouts ...237
Using trace files ...238
Using the execution log ...239
Querying the Report Execution Log ...240
Understanding database storage ...243
Chapter 13: Securing Report Server . . . .245
Understanding Security Fundamentals ...245
Introducing the Authorization Model...246
Creating role assignments ...246
Maintaining item-level security ...248
Using system-level security ...252
Best Practices for Protecting Against an Attack ...253
Secure support for external users...255
Understanding data security ...255
Chapter 14: Optimizing Report Performance . . . .257
Monitoring Report Server Performance...257
Using Task Manager ...258
Using Event Viewer ...258
Using Performance console ...259
Strategy for Performance Tuning...263
Benchmarking system performance ...263
Searching for performance bottlenecks ...263
Tuning system performance ...263
Understanding Database Requirements for Report Server ...264
Reports, folders, shared data source items, and metadata ...264
Resources ...265
Session state information...265
Cached reports ...265
Report history snapshots and report execution snapshots...265
Providing adequate space for caching ...266
Configuring Reporting Services Components ...266
Configuring and running large reports ...266
Rendering reports ...268
Distributing reports ...268
Using parameters and filters...268
Using snapshots ...269
Part V: Developing Advanced Reports ...271
Chapter 15: More About Interactive Reporting . . . .273
Using Visibility Options...273
Hiding items in a report...274
Drilling down on reports ...274
Drilling down a recursive hierarchy ...277
Dynamically visible data regions...279
Using Navigation Techniques ...282
Adding bookmark links...282
Adding hyperlinks ...283
Using Document Maps...283
Using Tooltips...286
Interactive Sorting ...287
Chapter 16: Drilling Down to the Details . . . .289
Drilling from Summary to Detail ...290
Drilling Down and Pivoting on Detail Lines ...293
Providing Multiple Drill-down Options...297
Providing Navigation Links to Reports ...300
Handling Multiple Drill Paths...303
Preparing a Report Menu Page...305
Chapter 17: Reporting from OLAP Data Sources . . . .307
Discovering OLAP Capabilities...307
Learning the dimensional model...308
Just the facts, Ma’am ...309
Understanding dimensions ...309
Constructing cubes ...310
Introducing Microsoft Analysis Services...310
Gaining perspective ...311
Speaking the Language of OLAP...313
Building an MDX query...313
Defining calculations with MDX...314
Defining KPIs with MDX ...314
Creating Reports with OLAP Cubes ...316
Connecting to an OLAP data source ...316
Creating an OLAP report with the Report Wizard...316
Chapter 18: Helping Executives See the Big Business Picture . . . .323
Monitoring Enterprise Performance...323
Understanding key performance indicators ...324
Measuring corporate performance ...324
Offering immediate business insight ...325
Building the Presentation...325
Getting a first look at indicators...326
Ensuring intuitive navigation...326
Shifting to a customer view...327
Tracking products ...328
Using profiles to highlight detail ...328
Searching for low margin culprits ...329
Accessories to the Executive Analysis ...331
Using charts for trend analysis...331
Getting down to the details...333
Integrating ad hoc analysis ...335
Sharing the wealth of information...336
Reviewing reports offline ...336
Publishing special supporting analyses ...337
Part VI: Migrating from Other Reporting Tools ...339
Chapter 19: Comparing Reporting Services
to Other Popular Reporting Tools . . . .341
Introducing Other Reporting Platforms ...341
Microsoft Access reporting...342
Business Objects ...342
COGNOS ReportNet...342
Reporting Services ...343
Comparing Data Retrieval Features ...343
Retrieving data from a database ...343
Comparing Report Development ...344
Using a report wizard...344
Styling with report types ...345
Accessorizing reports ...345
Reporting with parameters and formatting options...346
Report Builder for ad hoc reporting by business users...346
Comparing Publish, Subscribe, and Access ...347
Publishing your reports...347
Accessing reports on demand ...348
Delivering reports ...349
Comparing Management and Administration of Reports ...349
Managing your reports ...349
Comparing Advanced Reporting Capabilities ...351
Making reports interactive...351
Reporting from OLAP sources ...351
Reporting for executive use ...351
Comparing Price...352
Tool Comparison Takeaways...353
Chapter 20: Converting Reports from Access . . . .355
Importing the Access Report...355
Understanding how Access reports differ from Reporting Services ...356
Supporting cast for Reporting Services ...357
Making sure everything converts...357
Tightening up reports after conversion ...358
Upsizing an Access Database and Reports...361
High performance and scalability ...361
Increased availability ...361
Improved security ...361
Immediate recoverability ...362
Server-based processing ...362
Upsizing your Access database ...362
Part VII: The Part of Tens...365
Chapter 21: Ten Cool Tricks with Reporting Services . . . .367
Greenbar Paper Formatting ...367
Controlling Page Breaks ...368
Running Totals...368
Simulating End-User Sorting ...368
Simulating the All Parameter Value ...369
Dynamically Creating a Report Query...371
Changing the Report Manager Folder Icon to a Corporate Logo...371
Suppressing Objects or Formulas in an Excel Rendering of a Report...372
Securing Reports with a UserID Parameter ...372
Measuring and Improving Report Performance...373
Chapter 22: Ten Ways to Hook Into the Microsoft BI Platform . . . . .375
Analysis Services ...375
Integration Services ...376
Data Mining ...376
Reporting Services...376
Clustering Support...377
Scalability and Performance...377 One-Click Cube ...377 Proactive Caching ...377 Integration with Microsoft Office ...378
Chapter 23: Ten Places to Find Reporting Services Support . . . .379
Microsoft SQL Server...379 Reporting Services Web Site...380 Sample Databases for Reporting...380 Report Packs...380 Reporting Services Newsgroup ...381 Chat or Webcast ...381 OLAP Reporting...381 SQL Server Magazine ...382 SQL Server Development Center...382 General BI Links...382Chapter 24: Ten Third Party Tools
to Use with Reporting Services . . . .383
Attunity...383 Cizer Software...384 Dundas Software ...384 Fenestrae...385 GFI ...385 OutlookSoft ...385 Panorama Software ...386 ProClarity ...386 Proposion ...386 OfficeWriter...387T
wenty-five years ago, people developed reports using an advanced pro-gramming language that usually ran on the mainframe. With the advent of the personal computer in 1982, it was possible to use a programming language called Basic to write some basic reports with formatting. In the mid-1980s, Microsoft Excel came along and many people began to use the formatting capabilities and developing reports directly in Excel. Since then, Excel has continued to be the preferred tool for reporting and analysis for financial analysts and accountants due to its ease of programming formulas and for-matting capabilities.Beginning in the 1990s, Microsoft began the development of a database man-agement system called SQL Server. The early versions of SQL Server were clunky and the solution was not as popular as other database management solutions on the market. The first serious scalable version of SQL Server was SQL Server 7. In 2000, the SQL Server 2000 database was launched and until recently has been a scalable database system for developing enterprise solu-tions, especially for departments of large companies or midmarket companies. The price of the software running on Windows was a compelling feature of this database product.
Then in April 2004, Microsoft acquired a company called ActiveViews. ActiveViews provides an ad hoc reporting system that takes advantage of the.NET framework and SQL Server Reporting Services to allow users to do ad hoc reporting within Reporting Services. Since then, Microsoft has been integrating the technology into Reporting Services to integrate and enhance the ad hoc reporting capabilities within Reporting Services. This new compo-nent has been added to the Reporting Services 2005 product in the form of a tool called the Report Builder. It is now available in Reporting Services 2005.
Microsoft SQL Server 2005 Reporting Services For Dummieshelps you explore all the capabilities of this exciting new reporting tool. This book gives you the basics for all components of Reporting Services 2005. Although this book doesn’t make you an expert at using all the features, it shows you how to use the key capabilities to produce some outstanding reporting solutions. It pro-vides a great roadmap for exploring the key capabilities and gets you started on the path to mastering advanced features.
This book is for you if you’re interested in developing reports from any data-base management system that runs in Windows (SQL Server, DB2, and Oracle), because there are tools in SQL Server that can integrate information from any of these other database management systems.
Because Reporting Services 2005 comes as part of SQL Server 2005 (no extra cost!), if your organization is using SQL Server as a Department of Enterprise Database solution, you should explore the capabilities of this exciting new tool as soon as you can. This book is your quick-start guide to beginning to create powerful new reports that can help you easily unlock and explore data stored in myriad systems.
How This Book Is Organized
To help you find what you need quickly, this book is divided into seven parts. Each part covers a certain topic about using Microsoft Reporting Services 2005. Whenever you need help, just flip through this book, find the part that covers the topic you’re looking for, and then toss this book aside and get back to work.
Part I: Just the Basics
I provide a quick summary of some database concepts to give you a refresher on database access. Because you’ll be querying database tables for information to report, you need to be aware of how to access tables and what SQL queries are all about. With this knowledge, you’re ready to begin to build reports.
Part II: Building Reports —
Your Creativity Options
Microsoft provides a simple interface for constructing reports quickly with a Report wizard. A first pass through this wizard provides a glimpse of the steps required to assemble a report from scratch.
As all carpenters have tool belts to provide quick access to tools for con-struction, Microsoft Reporting Services provides a toolbox that provides quick access to tools helpful in designing and building reports. SQL has many tools, and I help you get to know the advantages and disadvantage of each in special reporting situations.
Basic actions such as sorting, grouping, and filtering information presented in a report add to your intended users’ understanding of the information to be delivered in your reports. Basic capabilities for producing ad hoc reports (reports you can create quickly on the fly through drag and drop operations) are covered through a description of how the Report Builder tool works.
Part III: Publishing, Accessing,
and Subscribing to Reports
Professors in college know the phrase “publish or perish” — they need to publish articles and books to continue their tenure at the college or univer-sity. Well, for other reasons, you also need to know how to publish a report so that others can benefit from your information. You can publish reports so that users can access them whenever they need to. You can also publish reports so that they appear in e-mail messages to business users on a regular basis.
Part IV: Maintaining Your Reports
A Web interface that comes with Reporting Services 2005 manages your reports in folders to make access quick and easy. This interface is the Report Manager. In general, you can publish reports to the Report Manager and manage these reports and who can access them through some security and site settings.
Security is an important topic when sensitive business or personal informa-tion is available on the Web. In this part, I fully explore security opinforma-tions for reports and for the overall Web site. Database security can also provide ways to lock down secure information so that information is provided according to any standards and guidelines that corporations today enforce for business information distribution.
Optimizing the performance of reports can be a consideration if you have many users accessing vast amounts of data at the same time during peak times. If you’re responsible for the overall end-user satisfaction with your reporting facility, you will probably need to remember a few principles for maximizing the execution performance for your reports.
Part V: Developing Advanced Reports
Interactive reports are valuable to users who need to see many facets of the data they’re looking at. Reporting Services lets you drill down from summary information to see greater detail and then shift your view across many parts of the organization with an array of reports that are linked together. Microsoft Reporting Services 2005 enables you to create some interesting linked reports which together provide an intuitive navigation interface to begin exploring information in more detail.
Drilling down to see more detail, showing navigation links on reports which bridge you to other views of the information, and transparently passing para-meters from one view to another are all possible with Reporting Services 2005. You have all the features to provide a report that can be easily understood by an executive and allow for further exploration of the detail.
Part VI: Migrating from
Other Reporting Tools
Part VII: The Part of Tens
For those people who just want to find shortcuts and tips for working more efficiently with Microsoft Reporting Services 2005 (so they can take the rest of the day off), this part of the book provides some cool tricks, resources you can spot on the Web for more information, more interesting information about the rest of the Microsoft BI platform, and finally a list of third-party tools that further enhance your productivity or extend the capabilities of Reporting Services 2005.
This part is intended as a reference for tips and resources that make Reporting Services 2005 seem a lot easier than the incomprehensible manuals. Just remember that if anything in Reporting Services 2005 confuses you or doesn’t make sense, it’s not your fault — it’s Microsoft’s fault, so feel free to blame these developers for failing to anticipate your needs appropriately and selling you a not-always-intuitive product.
How to Use This Book
You can use this book as a reference or as a coffee table decoration (especially if your color scheme includes a cheery yellow!). Unlike novels, this book is not designed for people to read from cover to cover, although you can if you want to. Instead, just browse through the parts that interest you and ignore the rest.
If you plan to take full advantage of Microsoft Reporting Services 2005, read Part I first so that you can acquaint yourself with the more common Reporting Services features.
The other parts of this book are here for your reference and amusement. Though you may not care about ad hoc reporting with the Report Builder at first, some day you may want to play around with it just to see what it can do. To your surprise, some features you thought you would never use may turn out to be more useful than you ever imagined. Then again, the features may really turn out to be useless after all, but you’ll never find out until you try them.
Icons Used in This Book
This icon points out things that make using Reporting Services for tasks quicker and easier.
This icon denotes information to keep in mind as you’re using Reporting Services.
This icon explains important stuff you need to know to prevent really awful things from happening.
You can skip these paragraphs unless you really want to get into complicated subjects.
Getting Started
T
o make life easier, Microsoft has built in some powerful features to create reports useful for transforming data into information. I provide an overview of the reporting principles and challenges and then introduce you to the key features of Microsoft Reporting Services 2005. I also show you some basic features of the SQL Server 2005 database that will help you access databases for the reports you want to build. I demonstrate how to get a basic report up and running with data just waiting to be tapped for a database.Getting Familiar with
Reporting Services
In This Chapter
䊳Finding out what reporting is all about
䊳Facing reporting challenges
䊳Mastering reporting principles
䊳Checking out the major features of Reporting Services
䊳Accessing and viewing a report
C
orporate data is growing at an extremely fast clip, meaning that more data is collected about business events and business transactions than ever before. It has been noted that data storage capacity of every company of every type doubles every 12 months. This data is stored in a great variety of formats — databases, spreadsheets, files, and documents. And as a direct consequence of this infinite variety, there’s never very much uniformity to the data, so it often just sits in locations, never to be examined with any real efficiency.The challenge in business today is to tap into this data that’s just sitting around idle in an organization and then transform it into information and eventually into the kind of knowledge that can result in a competitive advan-tage. This transformation needs to evolve in baby steps. The first step is to identify what kind of data exists and where it resides. The next step is to create reports from this information.
In this chapter, I provide an overview of reporting in the business world so that you have some perspective. I then show how Microsoft Reporting Services meets the challenges and provides a great way of doing reports. You’ll be surprised what capabilities Microsoft has packed into this extension of SQL Server 2005.
Dealing with Reporting Challenges
A good reporting tool must address many challenges, based on the need for versatility, accessibility, and automation. Versatility is important because of the great diversity of applications in business today that require reports in many forms. Accessibility is important because information is more fre-quently utilized in a business process if you can get to it easily. Finally, automation is important because access to key reports on demand at a moment’s notice can greatly speed business processes that are dependent on the information.
The first challenge is versatility. For a reporting tool to do just the basics for you, it needs to wear a lot of different hats. The reporting tool must be able to handle both standard reports (regular weekly reports that are core to your business) as well as ad hoc (where you construct a report on the fly to answer a new question) reporting and analysis. The reporting tool also needs to span a multitude of data sources and data formats in a variety of database manage-ment systems (DBMSes for short). Today, companies focus on driving the business as it is today, as opposed to investigating historical information, so being able to put key performance indicators on a dashboard that allows for drilling down into more detail enables this forward-looking ability. Finally, the ability to be able to develop a generalized report with dynamic filtering can serve multiple purposes and thereby reduce the total number of reports required to support the enterprise reporting needs.
The next challenge for reporting tools is accessibility. Today, information technology (IT) departments respond to requests from various business groups. IT typically experiences large backlogs and might have some dis-satisfied users as a result. Also, some reporting tools are used to distribute information predominantly on paper. Providing self-service and Web-based reporting capabilities, in which business users can go to a Web site to get the information they need, does two things:
⻬Information is delivered when it is needed (if the data is available).
Having access to historical information via the Web provides perspective to the information so that trends can be identified. Even beyond this, you can mine the historical information for predictive modeling purposes to help see into the future, based upon assumptions related to the key factors or drivers of the business.
The next challenge for reporting tools is automation. Reporting capabilities have traditionally been defined by the IT department. IT is constantly chal-lenged with having to retrieve information from multiple data sources and delivering reports with a variety of tools. Being able to automate the inte-gration of data sources and the production of reports so that information is pushed to business people in the form of reports and alerts enables knowledge workers to be more proactive. Alerting reports can also be produced when key operational metrics look to be out of whack, indicating that a situation needs attention — again, a proactive, enabling capability.
You’ll get a chance to see how Microsoft SQL Server 2005 Reporting Services rises to these challenges and provides some excellent reporting capabilities. The great feature about Reporting Services is that it is an extension of the SQL Server database management system. As such, if you have an SQL Server license, you have Reporting Services.
Mastering Reporting Principles
Have you ever wondered why some reports are immediately understood while others lead to blank looks and questions about your competency? Reports that resonate with others generally satisfy the key principles of reporting. In this section, you get the chance to explore the key principles to follow to create good reports.
Presenting the right information
The first “good reporting” principle is presenting the “right” information. The right information can be current or historical, subtotal amounts by category, running totals by reporting group, trend lines sales over time, or just vertical bars showing how your product sales ended last quarter. The right information depends on the nature of the business question that you’re trying to answer.
Another benefit of reporting the right information is that the report should beactionable.That is, the best reports show the type of information that you (or anybody else equally intelligent) would use to make an immediate decision. This could take the form of an exception report that shows business events that require immediate attention. Or it could be a chart illustrating that the inventory levels of a certain raw material — compared with component sales — indicate that a reorder needs to take place immediately. Whether a decision can be made based on the information presented in a report is an important criteria in the value of that report. It also is a guiding principle when deter-mining what information belongs on a report.
Microsoft Reporting Services allows you to report information from nearly every type of data source you can find — from a legacy system to a spread-sheet to relational databases and even OLAP (online analytical processing) databases. Within a report, Reporting Services allows you to report from multiple data sources in order to provide the right information in the report. It provides access to the data sources essential to presenting the right information.
Using the right medium
“The medium is the message,” advertisers tell me. The messages or information that you deliver in a report should be versatile enough to allow viewing from virtually any media. The choice of media appropriate to the report depends mostly on the type of action that the report should evoke. For example, if the report needs to be easily accessible and represents a key variable of the business, the report needs to be shared in many contexts. This type of report should be available on the Web and available to all relevant business users for collaboration. If the report is part of a regular briefing, is reviewed with many other such reports, and might need to be referenced intermittently, it might be best to print the report to include in a book of reports for review. If the report needs to be sent to a person in the field for immediate action, it should be available on a PDA in electronic form. If the report will be subject to further analysis by a financial person, creating the report in an Excel spread-sheet might be best.
Presenting to the right audience
If you’re like me, you need to create reports and share them with other people in the company so that they understand something about the data — and then hopefully have them interpret or explain the business context to everyone else. Depending on the functional role of the person with whom you’ll be sharing the results, the style of the report is sure to be different. Some people react better to a pure numbers presentation. Others respond better to a graphical view of the information, perhaps showing a trend over time or a comparative chart of performance compared with other like aspects.
Reporting Services allows you to customize your information to suit the prefer-ences of a wide variety of consumers of information. Reporting Services allows you to create traditional reports as well as free-form reports. It also allows you to create interactive reports that can drill into more detail by linking directly to another report. If you’re making a presentation to the board of directors or perhaps creating a list of To Do’s for yourself, knowing your audience helps you define the best style and format for your report.
Offering the right content and design
When somebody walks up to me at the copy machine and asks me, “What is this report that Accounting sent me last week supposed to be telling me?”, I usually wonder about two things. First, is this guy testing me with something that I’m supposed to be able to pick up quickly? Then, after rapidly scanning the information and concluding that it is not a test, I’m usually shocked by how poorly organized the information in the report actually is. Finally, I have to shrug my shoulders and confess that I am just as confused as he is.The moral of this story is that many bad reports are out there! Reporting can be improved by taking advantage of features that present the right information clearly so that you have no question about the right interpretation. A report with the right content and design is easy to understand by ordinary people like you and me.
By using Reporting Services, you have many content design approaches that you can put to use because of the many elements in the report toolbox that you can use in any report. In addition, you might want to provide for ad hoc query and analysis. The ad hoc nature of asking questions, getting answers, and integrating these answers together to gain an understanding of what’s really going on is what most business analysts and their managers need to do. They need the capability to ask a variety of questions and filter the report dynamically or drill down to see more detail within the underlying data. Perhaps they want to be able to jump from one view to another, with a parameter passed to the second report that shows a different view for that aspect of the initial report. Reporting Services was designed to provide these kinds of capabilities.
The design surface or user interface used to create reports for Reporting Services includes a wide variety of tools that can provide just the right content to clarify the information so it’s clear to your audience. For example, tabular or list reporting might be appropriate for financial analysis, but subreports could provide other views that clarify the meaning of the information reported. Charts provide for graphical views that allow the user to easily visualize trends and anomalies. Free-form reporting tools such as lists and rectangles (con-tainers used for placing other controls that allow more free-form reporting) allow much more flexibility than ordinary banded-style (columnar reporting with little flexibility to change column spacing and subtotaling formats) reporting tools most of us have had to settle with.
Providing the right security
Information provided to the wrong people can lead to some huge problems. For example, if personal information from Human Resources (like your employ-ees’ Social Security numbers) was available to everyone in your company as well as to your customers and prospects, this could lead to an identity theft situation and some disgruntled employees. If you provide access to informa-tion that is not appropriate for some class of business users, you could open up your company to unwanted lawsuits and other nuisance issues that could result in your own trip to your HR department.
Investigating Business Data
Many company managers and analysts today are preoccupied with investigating business data. For companies that still have legacy systems — systems installed in the 1980s or 90s that were developed on mainframe platforms or other plat-forms that new systems no longer use — accessing the data for reporting and analysis can prove a challenge. Many business people have turned to spread-sheets for rekeying legacy data and creating some analysis based on the data. Databases such as Microsoft SQL Server and Oracle are becoming the informa-tion storage system of choice. Databases allow for easyaccess to informainforma-tion in tables that can be queried with reporting tools. Applying good reporting principles to the information in these databases can provide valuable insight into business operations.
Being able to drill down into information for more detail or charting information to see trends in the information is business intelligence.Business intelligence (BI) solutions integrate information from multiple data sources and realign the data into structures that are ideal for reporting, drilling down, and trending. These hybrid data models provide greater value for users, including more insightful information content in reports. Smart users who know the tools can then explore information effectively to gain insight into the underlying information.
In a well-executed BI solution, users have self-service access to reporting tools like Reporting Services. Self-service reporting for everyone is a nirvana state of business intelligence. Business people need to be able to freely explore appro-priate information with interactive reports or view relevant performance data through dashboards. Dashboards are a common user interface for executives who typically have little training or knowledge in computers and therefore require very intuitive controls for interacting with the information. These varied reports become a truly analytical support system that can provide the perspec-tives necessary to increase the agility of your organization. Reporting Services is one tool that can be leveraged to provide this type of analytical framework.
Uncovering the Major Features
of Reporting Services
a few simple illustrations of Reporting Services features and capabilities will provide you with a perspective on how to work with the tool. Don’t worry if you don’t catch on during the first reading of this section. I’ll backtrack and cover all these areas in greater detail in subsequent chapters of the book. This tour will enable you to appreciate the power at your fingertips with this new reporting service.
It’s a Web service
Reporting Services gets its name from the fact that the report server is a Web service. A Web serviceis a software component that runs independently on a server and can be accessed by other applications running on the World Wide Web. The Web service runs on the report server. The Web-based report-ing functionality of the reportreport-ing service provides a sreport-ingle platform for pro-ducing Web-based reports for all types of data. The reporting service enables you to embed reports within any Web application and make them available to users with any Web interface. It also allows you to save or view report information in a number of different formats, ranging from images to Excel workbooks.
Any application that can make use of Web services can present information through Reporting Services. One particularly useful set of applications enables you to manage many aspects of report processing as part of the report service — retrieving data, transforming the report layout into a device-specific format (rendering),delivering reports to specific formats, and securing the access to reports, to name just a few.
Working with the design surface
Third-party tools from Microsoft partners are also available for creating reports using Reporting Services. See Chapter 23 for a list of supported third-party products.
Continuing the tour of Reporting Services features and/or terminology brings us to the Report Manager,an ASP.NET application built into the Web service to enable you to manage the reports that you create. This tool organizes reports into easily maintained folders of reports, data sources, and report resources. It allows an administrator to control access, security, and extended usage and also provides an interface for end users to access and view reports easily. Report Manager has features that allow you to create Report History snap-shots for point-in-time information. You can also define subscriptions that allow reports to be delivered to users via e-mail or through Web sites. Report Manager also controls server functionality, such as the report cache, and other features that influence overall report distribution performance. I’ll be saying lots more about the Report Manager in later sections, where I concentrate on managing, securing, and distributing reports.
Another tool available from the Report Manager is Report Builder, which is a report authoring tool that complements Report Designer. It is a “click once” Windows application and is run from a full Windows application running on the report server. Whereas Report Designer can create very flexible and com-plex reports, Report Builder is designed for the business end user who needs to create an ad hoc report. Business users can drag and drop key information elements without having to know anything about the databases they come from. As such, Report Builder supports a more intuitive style of building reports.
When I talk about Report Builder, I’m talking about a thinapplication — meaning that it is a small separate application that starts up quickly and runs within Reporting Services — that is downloaded to your machine when you access it. It provides a rich development environment displaying more information about all the relationships and hierarchies (such as models) in the data sources that you use to create the report. A Model Builder utility for maintaining these relationships and hierarchies is accessible through Visual Studio.
Connecting to a data source
One key feature of Reporting Services is that it allows multiple data sources to be used within a single report, a unique capability that allows for truly robust reports.
Creating the layout
Regardless of the design surface (Visual Studio or Report Builder) that you use, you have many report items in the toolbox of report controls available to you for building reports. Some of these items are independent items — meaning that they’re not associated with a particular data source. Examples of these report controls include the Textbox, Line, Rectangle, and Image report items. Rectangles can be used to group other report items or to add page breaks.
Other report controls organize data for presentation and are known as data regions.Examples of these report controls include the List, Table, Matrix, Chart, and Subreport controls. Tables are used for tabular displays; matrix report items are excellent at creating cross tab reports; subreports act as containers for other reports; and charts create graphical content. You can also add headers and footers at the report, page table, or group level within a report. The heart of creating reports is knowing the ins and outs of working with the various report items as objects in your reports. I talk about these capabilities more in several chapters of this book, beginning in Chapter 3.
Using expressions and formulas
Inserting expressions into reports can sometimes be tricky, so it’s good to know that Reporting Services has a robust Expression Editor to help in this task. You can create custom fields from columns you return from your data source and then create expressions in a textbox for descriptive text based on elements from your data sources for the report. When it comes to formulas, you can make use of aggregating functions such as SUMand AVGor COUNT and even set up conditional formatting so that various intersections of your report stand out because of distinctive back color, fonts, or other properties. Finally, you can create your own functions and utilize them with a report.
Filtering, sorting, and grouping
to a report item with a basic drag-and-drop maneuver. Then, groupings of report items can be created with an Insert Group command on a table report item. Expressions can be used for the Group On value and Sort value. A report table can be sorted on any field in the table. This allows for robust control over your reports so that a single report with parameters the user can specify could replace a whole book of reports, which are hard-coded or preprogrammed for only certain combinations of parameters.
You can create reports with interactive sorting capabilities, which enables the user to sort the data within the report. Reporting Services supports group sorts and various techniques to control the scope of the sort. The Interactive Sort control appears in the Report view as a control that shows the direction of the current sort and highlights which columns can be sorted interactively. The advantage of using this technique is that it interacts with the data that has already been retrieved from the server into the report. All the sorting is performed on the client application without having to query the server again. This provides another option for controlling the overall reporting solution performance.
Defining parameters
Parametersare variables that determine the filtering for the data presented in reports. You can use parameters in queries to specify report content. All you do is specify your parameter values in a report prompt within the report; they are then passed through to your query to generate the specified report. Parameter values can also be provided by another report so that reports can be linked to create a guided analysis across multiple reports. Report parameters are passed into the report, either through a parameter prompt or directly from another report. Query parameters are specified in the query of the data source that generates corresponding report parameters. You can select one or multiple values in the parameter value list to determine what parameter values are reported for a parameter-based report.
Navigating and fact-seeking
Document Map is a great idea for documents that work like catalogs. You can also specify whether clicking a cell will jump to another report or to a URL location on the Internet. Using this capability can produce some interesting drill-down analysis capabilities or hyperlinking to get more information from another Web service or Web page about a particular subject.
You can also control the visibilityof each component of the report so that it can be initially visible (or not) but turn invisible (or visible) based on another report item, an action, or a conditional function. This feature allows for inter-esting drill-down effects within a single report, where you can initially hide a detail section and toggle between showing or hiding that section with a con-trol that appears on the report.
Formatting the content
Reporting Services provides you with a variety of devices to control simple text formatting. They include toolbar controls for font and style of your text, menu controls which allow you to change foreground or background color, and text properties that allow you to adjust the format of numbers or general text for display.
Text and numbers are sure to make up the greater part of your reports, but you’re sure to face situations in which you’ll want to add images to your reports. Maybe you want to provide some concrete visual information, or you just want to spice things up a bit. With Reporting Services, you can add images to your report as part of the header, display a picture of a catalog item, or even add a background image to every page of your report. And when it comes to how images get attached to your report, you have the option of embedding images directly in the report, referencing an image on the Web via its Web address (or URL), or storing the image as a field in a database. (Talk about flexibility!)
You can set project properties to control the location of the report server as well as the name of the folder that the report will be created in when saved and deployed. Report properties can reference custom assembliesor code that can be run to handle special display formats for numbers in a field. You can also control XML data output options. Many charting types are supported (22 to be exact) with smoothing and 3-D effects that can be added.
Saving a report
In Reporting Services, you save any report you create by using Report Definition Language (RDL). RDL, an XML-based schema for report content that allows report definitions to be exchanged between different systems or different reporting tools, is an open specification that Microsoft has pub-lished. Some leading reporting tool vendors have announced that they will support this standard. This is a great development because it ensures that in the near future, you’ll be able to move reports between different reporting tools without losing formatting or data.
The properties of the project dictate where you save the report when the project is actually built and deployed. For example, you can build the report and deploy it to a folder in the Report Server. This enhances your ability to navigate to the report you need when you need it.
Displaying a report
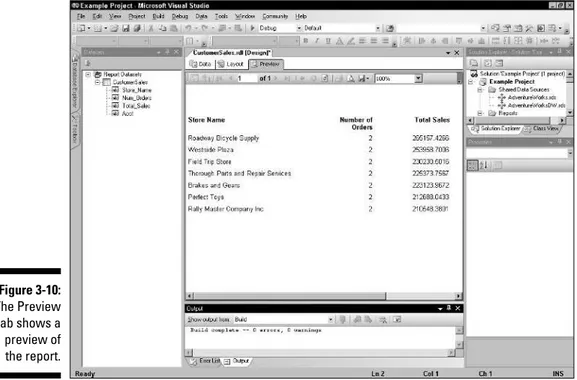
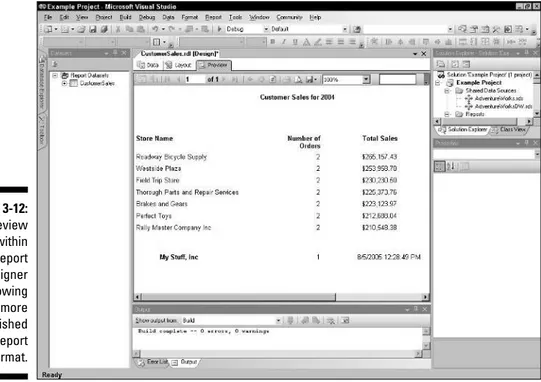
You can preview your report layout in the Preview window of whichever design tool — Report Builder, Report Designer, or some third-party (non-Microsoft) tool — you choose to work with. After you’re happy with the layout, you can print from the Design tool. This is one way to see the results of your work. After you save your report to the server, you can use the Report Manager to access and view the report.
Another way to access your report is to use a technique called URL access,
which allows you to type in a URL directly in a standard Web browser to render the report in your browser. With this method, you have the option of displaying the report without the headers and other toolbar and con-trol features that the Report Manager provides. I discuss this further in Chapter 9.
Managing reports
Remember that managed reports are reports stored on the report server, where they can be stored in folders within the Report Manager. You can add reports to folders, move reports between folders, create new folders, rename old ones, and create folders within other folders, much the same way you’d work with folders for your computer’s file system in something like Windows Explorer.
You publish your data sources to the report server when you deploy your report project; these data sources can be shared among many reports. You control access to such data by using data source connection properties to set the access permissions of a data source. Within Report Manager, you can move shared data sources into their own folder if you so desire. You can also save images used in your reports as resources in your folders, thus providing for easy access and maintenance. Report Manager also allows the administra-tor to control which users have access to which specific folders.
Report Manager also provides access to various report propertiesthat govern how reports will execute (such as scheduled runs or execution frequency), how reports should use the memory cache (cache temporary copy when run, when to expire the cache), how parameters are used (default parameter values, para-meter interactivity), report-delivery techniques, and how users will be able to interact with the report content. You can use Report Manager to create snap-shots of the report, and you can save report histories so that you can review how the data has changed over a period of time. All these properties provide great control over your managed reporting environment. I describe the capa-bilities in more detail in Chapter 9.
Securing a report
Distributing a report
The most popular way to distribute a report is to print it. The printed report is then copied for all report consumers and distributed at an appointed time. Footers usually record the time the report was run as well as the time the data source was last refreshed.
Many years ago, environmentalists took the bull by the horns and recom-mended to corporate America that Business (with a capital B) should consider how many trees were being chopped down in the name of printed report dis-tribution. Deforestation worries intensified the environmentalists’ resolve. Even recycling experts could not make a decisive argument against the envi-ronmentalists, so corporate America began to embrace the online report distribution best practice. The ubiquitous Internet came along and further popularized this trend, which means that reporting in the modern age is becoming increasingly paperless.
To accomplish paperless reporting, Web services like Reporting Services are required. Using Reporting Services, you can author a report and then publish it to a folder to be accessed by Report Manager. On-demandreports are reports that do not cache temporary copies of reports when they are run. Subscriptions
can be defined to “push” reports to users: Subscriptions can be scheduled to execute regularly to deliver rendered reports to end users.
One delivery option for subscriptions is to have the subscription send an e-mail containing a hyperlink, a notification, or a rendered report attachment. Another delivery option is to have the subscription execute a file delivery to send the report to a file location that an intranet can access easily.
Accessing and Looking at Reports
Now you can catch your breath after that rapid tour of Reporting Service capa-bilities. The following chapters of this book dive much more deeply into each of these subject areas.
Printed reports versus online reports
Reading a printed report doesn’t require any technical sophistication. And with a printed report, you get a paper copy of key information that you can refer to. Paper reports, however, do not offer any interactivity where you might click on some hyperlink to further explore the underlying details of some information on the report. It is helpful to display the date and time when the report was run, as well as the time when the data was last refreshed. This allows you to budget the currency and relevance of the information dis-played in the report. But there are a few limitations in having access onlyto a printed report:
⻬The report is not connected to a live data source.With a live connection to the data source, you can get information since the latest refresh of the database. For daily cumulative reporting, it is best to work with live data source connections if you really want to understand the current dynam-ics of the business.
⻬Graphical information has a single “shade of gray” display.This can present some difficulties when you review a bar chart with a multitude of different categories, but your printer produces only black and white. Using colors — yes, that includes shades of gray — improves the visibil-ity of the dynamics of your business as viewed through the reports.
⻬You have no drill-down capability.With a live database connection on a report with drill-down capabilities, you can easily navigate to see a more detailed perspective of the information presented from a summary report. You also have a choice on what areas you want to drill down into detail. This need might change from period to period, so a live report with dynamic drill-down capability in several report variables clearly pro-vides a much better analysis.
⻬You cannot take hyperlinks that jump from one view to another view. With hyperlinks, you can set up jumping within the report to link to a sec-tion grouping of the report, or you can set jumping outside the report to go to another report entirely or to a hyperlink on the Internet. Without the ability to hyperlink, you might have to flip through lots of reports trying to locate the data that you’re trying to analyze.
Viewing a report
1. Connect to the Report Manager by pointing your favorite Web browser to http://localhost/reports.
The Report Manager home page appears, as shown in Figure 1-1. You’ll see a folder for Sample Reports as well as any other folders defined on your report server. You’ll also see the menu options related to site set-tings and subscriptions. The view in the figure shows how it looks after you click the Show Details button, which then toggles to a Hide Details button (shown in the upper-right of Figure 1-1). You can see who created the folders and when they were last modified.
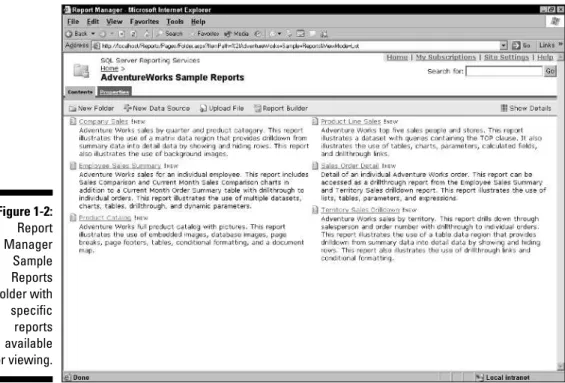
2. Select the folder that you want to view and click it.
Report Manager displays the contents of the Sample Reports folder, as shown in Figure 1-2. The folder consists of reports, resources, and (possi-bly) other folders defined on the report server. Each report in the Sample Reports folder can have a description (if provided) as well as a listing of the last date modified and who modified it. It might also show the last date run if configured in this way. You can click the column headings to sort all contents in that column in either an ascending or descending order. You can edit report properties by clicking the Edit symbol — the tiny-hand-over-the-report-page icon. You can also move or delete reports by marking the check box in the far-left column and clicking the Delete or Move button.