Microsoft® SQL Server 2005 Reporting Services
By Michael Lisin, Jim Joseph
... Publisher: Sams
Pub Date: March 22, 2006
Print ISBN-10: 0-672-32799-6
Print ISBN-13: 978-0-672-32799-5
Pages: 480
Table of Contents | Index
SQL Server Reporting enables the creation, management, and delivery of both traditional, paper-oriented reports and interactive, Web-based reports. An integrated part of the Microsoft business intelligence framework, Reporting Services combines the data
management capabilities of SQL Server and Microsoft Windows Server with familiar and powerful Microsoft Office System applications to deliver real-time information to support daily operations and drive decisions. Microsoft SQL Server 2005 Reporting Services will help you understand Reporting Services from various perspectives:
How it fits business scenarios
How to install and configure Reporting Services Reporting Services components
Developing reports
Microsoft® SQL Server 2005 Reporting Services
By Michael Lisin, Jim Joseph
... Publisher: Sams
Pub Date: March 22, 2006
Print ISBN-10: 0-672-32799-6
Print ISBN-13: 978-0-672-32799-5
Pages: 480
Table of Contents | Index
Copyright
About the Authors
Acknowledgments
We Want to Hear from You!
Introduction
Part I: Introduction to Reporting Services
Chapter 1. Introduction to SQL Server Reporting Services (SSRS)
What Is SSRS?
Chapter 2. Reporting Services Capabilities: Presentation, Navigation, andProgrammability Report Layouts
Report Presentation (Rendering) Formats
Report Items, Visual Effects, and Charting
Report Navigation
Ad Hoc Reports NEW in 2005
Reporting Services Data Access Features
Summary
Chapter 3. Reporting Services Architecture
Report Server Web and Windows Service
Programmatic Interfaces
Report Processor
Command-Line Utilities
Reporting Services Extensions
Report Server Databases
Scheduling and Delivery Processor
Report Builder NEW in 2005
Report Model Designer NEW in 2005
Report Designer
Report Manager
SQL Server Management Studio NEW in 2005
Reporting Services Configuration Tool NEW in 2005
RSPrintClient Control NEW in 2005
WMI Provider
Performance Monitoring Objects
Summary
Chapter 4. Reporting Services Deployment Scenarios
High-Availability Deployment Considerations
Internet Deployment Considerations
Minimum Hardware Requirements
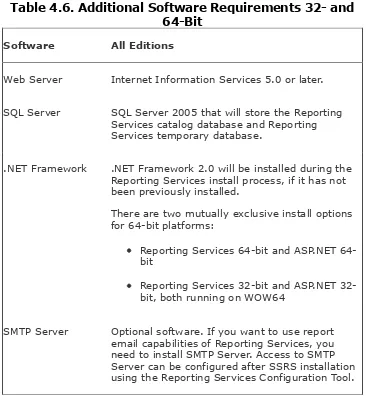
Software Requirements
Part II: Report Authoring from Basic to Advanced
Chapter 6. Report Designer
Two Main Report Designers from Microsoft
Visual Studio Haves Versus Have Nots
Solution, Project, File Hierarchy
Generating Reports with Visual Studio
Summary
Chapter 7. Report Definition Language
Language: A Way to Communicate
Declarative Programming
Using Expressions to Change Report Item Properties and Behavior
Example: Placing Emphasis on Certain Values
Summary
Chapter 9. Accessing Data
Data-Processing Extensions
Types of Data Sources
Data Regions, Containers, and Independent Report Items
Practical Application of Report Items
Practical Application of Chart and Matrix
Report Body Versus Page Header/Footer
Summary
Chapter 12. Grouping, Sorting, and Aggregating Data, Working with Scope
Grouping Data on a Report
Sorting, Including Interactive User Sorting
Interactive SortingNEW in 2005
Formatting-Related Report Item Properties
Formatting Numeric and Date/Time Values
Standard Date/Time Format Strings
Custom Date/Time Formatting
Creating Alternating Colors for the Lines on a Report
Paging Report
Summary
Chapter 14. Report Navigation
Hyperlink (Jump to URL) Navigation
BookmarkLink (Jump to Bookmark) Navigation
Document Map
Drillthrough (Jump to Report) Navigation
Hiding Items and Toggle Items
Practical Application of Action Items
Summary
Chapter 15. Working with Multidimensional Data Sources
Analysis Services Concepts
Data-Mining Concepts
Chapter 16. Ad Hoc Reporting New in 2005
Part III: Reporting Services Administration and Operations
Chapter 17. Managing Reports, Data Sources, and Models
Deployment Options in Visual Studio
Deployment Through Report Manager
Deploying Reports Through SQL Server Management Studio
Changing Report Properties
Setting Report History and Snapshots
My Reports
Summary
Chapter 18. Securing Report Server Items
Reporting Services Security Model
What Can Be Secured?
How Role Assignments Work
Relationships Between Roles, Tasks, and Users
Overview of Built-In Roles
Creating a Data-Driven Subscription
Summary
Chapter 21. Deploying and Configuring SSRS
Overview of Deployment Scenarios
Requirements for a Standard Deployment
Requirements for a Scale-Out Deployment
Configuring SSRS
Key Management
Summary
Part IV: Developing for Reporting Services
Chapter 22. Implementing Custom Embedded Functions
Adding Embedded Code
Debugging Embedded Code
Summary
Chapter 23. How to Create and Call a Custom Assembly from a Report
Strong-Named Custom Assemblies
NET Security Primer for a SSRS Administrator
Assemblies That Require Other Than Execute Permissions
Debugging Custom Assemblies
Report Management Web Service New in 2005 (ReportService2005.asmx)
How to Script Reporting Services (Using the RS Utility)
Working with Report Parameters
Security When Calling a Web Service
Some of the Commonly Used Methods with Short Code Snippets
Summary
Chapter 26. Writing Custom Reporting Services Extensions
Common Considerations for Custom Reporting Services Extensions:Implementation, Deployment, and Security Delivery Extension
Interactions Between User, SSRS, and a Delivery Extension
Summary
Chapter 27. Report Rendering Controls and SharePoint Services Web Parts
Microsoft SharePoint Web Parts
Summary
Chapter 28. Custom Report Definition Language (RDL) Generators and
Customizing Report Definition
Summary
Part V: Appendices
Appendix A. References and Additional Reading
Appendix B. Glossary
Appendix C. FAQ
Copyright
Microsoft® SQL Server 2005 Reporting Services
Copyright © 2006 by Sams Publishing
All rights reserved. No part of this book shall be reproduced, stored in a retrieval system, or transmitted by any means, electronic, mechanical, photocopying, recording, or otherwise, without written permission from the publisher. No patent
liability is assumed with respect to the use of the information contained herein. Although every precaution has been taken in the preparation of this book, the publisher and author assume no responsibility for errors or omissions. Nor is any liability assumed for damages resulting from the use of the information contained herein.
Library of Congress Catalog Card Number: 2005937212
Printed in the United States of America
First Printing: March 2006
08 07 06 05 4 3 2 1
Trademarks
All terms mentioned in this book that are known to be trademarks or service marks have been appropriately
Warning and Disclaimer
Every effort has been made to make this book as complete and as accurate as possible, but no warranty or fitness is implied. The information provided is on an "as is" basis. The author(s) and the publisher shall have neither liability nor responsibility to any person or entity with respect to any loss or damages arising from the information contained in this book.
Bulk Sales
Sams Publishing offers excellent discounts on this book when ordered in quantity for bulk purchases or special sales. For more information, please contact
U.S. Corporate and Government Sales
1-800-382-3419
For sales outside of the U.S., please contact
International Sales
Publisher
Paul Boger
Acquisitions Editor
Neil Rowe
Development Editor
Managing Editor
Michael Lisin: Dedicated to my family: my wife Anna, my daughter Helen, my mother, and the memory of my
About the Authors
Michael Lisin has been in the software industry for more than 14 years with 7 of those years working with Microsoft. He is currently working as a senior strategy consultant with Microsoft Consulting Services. Michael has been working with SQL Server for six years and with SQL Server Reporting Services starting from the pre-Beta version in 2002. Michael has taught
Reporting Services classes and presented SQL Server-related topics during various events. Michael will complete his MBA degree at Texas A&M this year.
Jim Joseph is a manager at Continental Airlines Inc. He currently functions as a SQL Server DBA within the Financial Systems Group with Continental Technology. He earned his MBA at the University of St Thomas in 2003, and undergraduate
Acknowledgments
The authors would like to thank the publishing team working with us on this book. Special thanks to: Neil, Mark, George, Karen, and Alex. Thank you for your valuable feedback,
answers, and hard work on this book. Without you all, this book would not be complete.
Thank you to Brian Welcker, Richard Waymire, Robert Bruckner, Thierry D'Hers, David Crawford, Bogdan Crivat, Donovan Smith, and Eli Ilionsky for helping with questions that arose while
writing this book. Thank you to Matt Whitten and Stephen Rauch for getting Michael started with Reporting Services.
We Want to Hear from You!
As the reader of this book, you are our most important critic and commentator. We value your opinion and want to know what we're doing right, what we could do better, what areas you'd like to see us publish in, and any other words of wisdom you're willing to pass our way.
As an associate publisher for Sams Publishing, I welcome your comments. You can email or write me directly to let me know what you did or didn't like about this bookas well as what we can do to make our books better.
Please note that I cannot help you with technical problems related to the topic of this book. We do have a User Services group, however, where I will forward specific technical questions related to the book.
When you write, please be sure to include this book's title and author as well as your name, email address, and phone number. I will carefully review your comments and share them with the author and editors who worked on the book.
Email: [email protected]
For more information about this book or another Sams
Introduction
SQL Server Reporting Services is a server-based, extensible and scalable platform that delivers and presents information based on data that a business collects during its operation.
Information, in turn, helps business managers to evaluate the current state of the enterprise and make decisions on how to increase revenues, reduce costs, and increase customer and employee satisfaction.
The Reporting Services scope extends from traditional paper reports to interactive content and various forms of delivery: email, file shares, and so on. SSRS is capable of generating reports in various formats, such as Hypertext Markup Language (HTML), Extensible Markup Language (XML), and Excel formats, thus allowing users to manipulate their data in whatever format is required.
Before diving into this book, let's take a moment to understand the layout as well as some of the conventions used in the book. First, we cover how this book is organized and what you can expect in each section. Second, we cover the style and
formatting conventions used in this book. It is particularly
noteworthy to note the style changes in reference to code lines, including SQL Server and .NET code.
How This Book Is Organized
This book begins with an introductory overview of SQL Server 2005 Reporting Services and covers a broad range of topics in the areas of report authoring, Reporting Services deployment and administration, and custom code development for Reporting Services.
provide a high-level overview of Reporting Services and
highlight key features of the Reporting Services, deployment scenarios, typical users of Reporting Services, and Reporting Services architecture. This part allows for leisurely reading and does not require you to have access to a computer.
The chapters in Part II, "Report Authoring from Basic to Advanced," take you through report development tools and processes. This part describes report building blocks and walks through building a report from simple to complex.
The chapters in Part III, "Reporting Services Administration and Operations," discuss advanced topics of Reporting Services
administration, such as setting proper security, managing
Reporting Services as individual servers and in a web farm, and gathering report execution information.
The chapters in Part IV, "Developing for Reporting Services," are for those of you who might want to extend Reporting
Services and incorporate reports in their applications. This part covers key programmable aspects of Reporting Services.
Conventions Used in This Book
SQL Server 2005 Reporting Services is frequently abbreviated as SSRS.
Business Intelligence Development Studio is frequently abbreviated as BIDS.
New features available in SQL Server 2005 Reporting Services as compared to SQL Server 2000 Reporting Services (SSRS2K) are labeled with "NEW in 2005".
2005, Report Designer, Report Builder, Report Manager, Windows, and so on.
Monospace is used to highlight:
Sections of code that are included in the flow of the
text"Add a text box to a report and place the following code in the Background Color property: =Code.Highlight(value)."
Filenames"Visual Studio creates a project with a single class
Class1. Let's rename file Class1.cs in Solution Explorer to MainClass.cs."
Pathnames"The compiled assembly must be located in directories where it is accessible by Report Designer (the default directory is C:\Program Files\Microsoft Visual Studio 8\Common7\IDE\PrivateAssemblies) and SSRS (default is C:\Program Files\Microsoft SQL Server\MSSQL.3\Reporting
Services\ReportServer\bin)."
Error numbers, codes, and messages: "
[rsInvalidReportParameterDependency] The report parameter
'SalesOrderId' has a DefaultValue or a ValidValue that depends on the report parameter "MaxOrderId". Forward dependencies are not valid."
Names of permissions, constants, properties, collections, and variables: Execute, Fields, ReportParameter, Parent.
To indicate adjustable information, we use
"{}", mostly where the variable information can be
confused with XML, for example <Value>{EXPRESSION}</Value>. In
Part I: Introduction to Reporting Services
In This Part
CHAPTER 1 Introduction to SQL Server Reporting Services (SSRS)
CHAPTER 2 Reporting Services Capabilities: Presentation, Navigation, and Programmability
CHAPTER 3 Reporting Services Architecture
CHAPTER 4 Reporting Services Deployment Scenarios
Chapter 1. Introduction to SQL Server
Reporting Services (SSRS)
In This Chapter
What Is SSRS?
SSRS for End Users
Overview of Features
Enterprise Report Examples
SSRS in the Report Development Life Cycle
Editions of Reporting Services
How Is SSRS Licensed?
Note
This book abbreviates SQL Server 2005
In today's ultracompetitive business environment, having good information is essential. Companies are awash in information, and with the advent of technologies such as RFID, more and more information is coming. Technology has made the job of gathering information trivial, but making sense of it all still remains elusive. This makes good reporting and business intelligence tools essential.
This first chapter is strictly nontechnical. This chapter focuses on the following:
Capabilities of SSRS
How it fits into the Microsoft Business Intelligence platform
Report development life cycle as it relates to SSRS
Editions of SSRS
What Is SSRS?
SSRS is Microsoft's answer to business reporting. It provides a unified, server-based, extensible, and scalable platform from which to deliver and present information. Its scope extends from traditional paper reports, to web-based delivery and interactive content. SSRS can also be configured to deliver reports to peoples' inboxes, file shares, and so on. SSRS is capable of generating reports in various formats, such as the web-oriented Hypertext Markup Language (HTML) and desktop application (Microsoft Excel and CSV) formats, thus allowing users to manipulate their data in whatever format is required.
SSRS is just one of the components in the Microsoft Business Intelligence (BI) platform. Combined, those components
provide an excellent platform for enterprise data analysis. The Microsoft BI platform includes the following:
SQL Server The traditional database engine, which also stores SSRS' catalog data.
SQL Server Analysis Services (SSAS) A component for online analytical processing (OLAP) and data mining. OLAP performs data aggregation and allows users to traverse from aggregations to details looking though the dimensions (such as geography or time) of data. Data mining helps users to discover patterns in data.
SQL Server Integration Services (SSIS) A component for extracting, transforming, and loading (ETL) data.
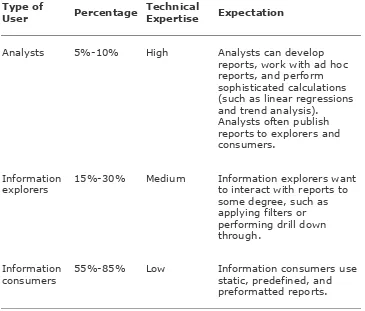
SSRS for End Users
SSRS is unique in the Microsoft Business Intelligence suite, as it covers a variety of information users. Microsoft divides users into three groups: information consumers, information
explorers, and analysts.
Table 1.1 briefly summarizes the percentages of users in each group, the level of technical experience, and the expectations from an enterprise reporting tool. All of these factors will vary from company to company, but generally the breakdown holds true.
Table 1.1. Breakdown of Information Workers
Type of
User Percentage TechnicalExpertise Expectation
Analysts 5%-10% High Analysts can develop reports, work with ad hoc reports, and perform sophisticated calculations (such as linear regressions and trend analysis).
Analysts often publish reports to explorers and consumers.
Information
explorers 15%-30% Medium Information explorers wantto interact with reports to some degree, such as applying filters or performing drill down through.
Information
To address the varying needs of these types of users, SSRS provides three main tools from the user perspective:
Report Viewer The primary mechanism for viewing reports over the Web. Report Manager is the name of the website that SSRS sets up. It provides a very clean and neatly
organized user interface for end users. Developers can also embed a Report Viewer control into both ASP.NET and
Windows Forms applications.
Report Builder The tool that provides users with a front end for ad hoc reporting against a SQL Server or Analysis Services database. Unlike most ad hoc reporting tools, users of Report Builder do not need to know Structured Query Language (SQL), or anything about joins or grouping to create reports.
Report Designer The tool that takes on the job of building advanced reports. Although Report Builder does a good job as an ad hoc reporting tool, Report Designer was made to tackle really advanced reports.
Figure 1.1 summarizes the type of reporting users, and
mentions some of the tools SSRS brings to the table for them.
Overview of Features
SSRS has a number of features to address complex business reporting needs. Over the course of this book, these features are explored more closely. For now, here is a brief overview:
SSRS can be used across the enterprise by various users simultaneously.
SSRS leverages .NET data providers and can query a variety of data sources. Examples of the .NET providers are SQL Server, Oracle, Analysis Services, Microsoft Access, and many more. If needed, SSRS can also be extended through the custom data-processing extensions.
SSRS includes delivery mechanisms to distribute reports to individual users on demand or on a scheduled basis.
SSRS reports can be rendered to a number of formats, including Excel or HTML. The reports themselves can also be used as data sources for other applications when
rendered to XML.
SSRS provides mechanisms for ad hoc reporting.
SSRS is highly available. Many enterprises are multinational companies and perform work in multiple shifts; to be a true enterprise reporting solution, SSRS had to include high-availability features.
Enterprise Report Examples
Each user is likely to have favorite reports to make timely and effective business decisions and although it is not possible to cover a whole gamut of reports in this book, some common ideas can help you think through practical applications of SSRS.
Score card reports are frequently used in today's businesses and provide information for each manager on how well his group is doing as compared to the goals set for the group. Usually, a score card implements a "traffic light" type of highlight or a "gage" indicator. Values on the score card are highlighted in green when the group is meeting its goals, in yellow when the group is doing so-so, and in red when the group's performance requires immediate attention. Score card reports can now take advantage of the new feature of Analysis Services 2005: Key Performance Indicators (KPI).
When users are looking to combine a comprehensive set of business health and "speed" gages (score card) and related information in a small space, a dashboard is used to accomplish this goal. A dashboard provides a short, typically one-page, summary view of a business (much like a car's dashboard summarizes a car's status) and allows drill down through the items on the top page to retrieve detailed information.
SharePoint is an excellent platform to host dashboards and
greatly simplifies arranging reports in the meaningful fashion on a page.
Today, when everybody is so short on time, it might be easy to miss an information point that could prove fatal for a business. Exception reporting is what comes to the rescue of a time-constrained user. Unlike regularly scheduled reports or summaries provided by score cards, exception reports are
reports, focusing instead on mission-critical anomalies. An example of such an anomaly could be a sudden drop in daily sales for a particular region.
Other typical reports include various views of sales (geographic, demographic, product, promotion breakdowns), inventory,
SSRS in the Report Development Life Cycle
To understand all of the ways SSRS can be used and deployed, you can simply walk through the report development life cycle, and see what features are useful in each stage.
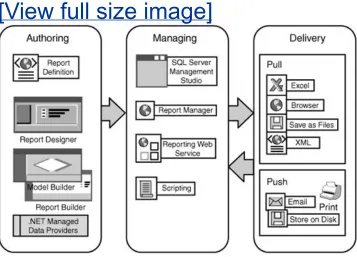
A typical reporting application goes through three stages (see
Figure 1.2): authoring, managing, and delivery. SSRS provides all the necessary tools to work with a reporting application in all three stages.
Figure 1.2. Reporting life cycle.
[View full size image]
During this stage, the report author defines the report layout and sources of data. For authoring, SSRS maintains all of the features of SSRS2K and adds some new features. Report
Designer is a tool that was previously available for SSRS2K. For SSRS2K, developers had to install Visual Studio 2003
Integrated Development Environment (IDE) for the Report Designer to function. Although integration with Visual Studio is still available in SSRS, today developers have a choice to use Report Designer within Visual Studio IDE or to use Report Designer within Business Intelligence Development Studio
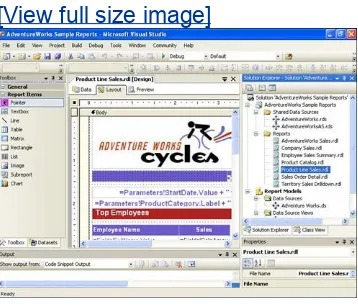
(BIDS). The Business Intelligence Development Studio shell has gone through changes from Beta 2 of SSRS. Starting from the Community Technology Preview release of SSRS, Visual Studio Express Edition, a free version of Visual Studio 2005 is included with SQL Server 2005 as a shell for the Report Designer. The Report Designer interface is shown in Figure 1.3.
Figure 1.3. Report Designer.
Report Designer is a full-featured report authoring tool that targets developers and provides extensive design capabilities and can handle a variety of data sources. Report Designer can work with all reports generated for SSRS, including reports generated by Report Builder. Report Designer incorporates the following productivity features:
Import Access reports, which allows designers to import Microsoft Access reports and creates a report definition in turn. In complex cases, it might not be able to successfully or completely import an Access report. The general rule of thumb is that SSRS will be able to convert approximately 80% of the existing Access reports.
NEW in 2005IntelliSense for expression editing, which
provides assistance with the syntax of a function used in expressions, names of class members, and indicates syntax errors in expressions by underlining them with squiggly red lines. You will see more details of this feature in Chapter 8, "Expressions."
NEW in 2005Multidimensional Expressions (MDX) and Data
Mining Expressions (DMX) query designer, which provides a drag-and-drop interface for writing MDX and DMX queries. This feature is covered in more details in Chapter 15,
"Working with Multidimensional Data Sources."
Relational query designer, which provides a drag-and-drop interface for writing SQL queries.
Preview mode, which allows a report author to preview the report design and layout before he publishes the report. This is a very powerful feature of a report designer that does not require Reporting Services to be installed on a computer on which the preview is generated.
Publishing and deployment functionality, which allows a report designer to publish a report to a target server. For example, the developer might choose to publish to a development or to a test reporting server.
The end user's ability to design reports is a new feature in SSRS. There are two tools that make this possible: Report
Builder and Model Builder. The combination of both tools allows an end user to develop, modify, and share her reports from SQL Server databasesboth relational and OLAPwithout the need to know either SQL or MDX.
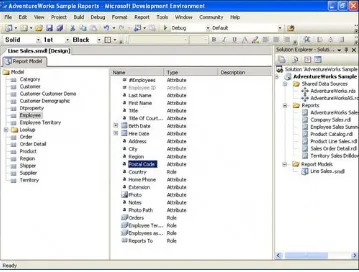
Before an end user can develop a report, a developer must create a model, using the Model Builder tool. Figure 1.4 depicts the Model Builder's interface. A model is similar to a report, in that a model is a file written in Extensible Markup Language (XML) with an extension of .SMDL. A model defines layout, data sources, data entities, and relationships in terms that are
understood by end users and not in terms of SQL or MDX.
Figure 1.4. Model Builder.
When a model is published, an end user can choose a report's layout and drag and drop model items on a report. This is how an end user can create ad hoc reports, based on the published model. Figure 1.5 shows the Report Builder interface.
Figure 1.5. Report Builder.
Report Builder targets end users and provides access to data sources predefined in a mode.
Note
Report Builder cannot modify reports generated by Report Designer.
Report Builder is a click once .NET smart client application that is launched from Report Manager's toolbar.
custom VB.NET functions, and expressions. RDL has powerful design elements (controls) such as the familiar Table, Chart, Subreport, and Matrix. SSRS has the capability to parameterize, sort, filter, drill down through, and aggregate data. RDL can be saved as a file on a file system or as data in the Reporting
Services database. RDL is an open language that allows third-party vendors to develop custom authoring tools.
Managing Stage of the Reporting Life Cycle
During this stage, the report author publishes the report to a central location where it can be managed by a report
administrator in terms of security and delivery. This central location is a SSRS database. After the report is published, the administrator can use Report Manager, custom written scripts, third-party tools, or SQL Server Management Studio to manage published reports. The report administrator can
Assign the report's security or the right a user might have to a report.
Establish execution control, such as selecting a time of an execution or caching options.
Access and organize subscriptions from a single location.
Control report execution properties, which controls how and when reports are processed. For example, the administrator can set processing options to prevent a large report from running on demand.
Automate report delivery through a standard subscription. Users can use subscriptions to set report presentation
preferences. Users who prefer to view a report in Excel, for example, can specify that format in a subscription.
Automate report distribution through data-driven subscriptions. A data-driven subscription generates a recipient list and delivery instructions at runtime from an external data source. A data-driven subscription uses a query and column-mapping information to customize report output for a large number of users.
Set delivery methods for a report, such as file share, printer (this would require a custom extension in the current
release, which is discussed in Chapter 26, "Writing Custom Reporting Services Extensions"), or email.
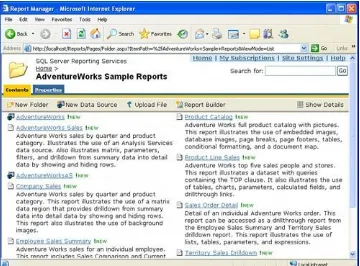
Figure 1.6 depicts the Report Manager's interface.
Figure 1.6. Report Manager.
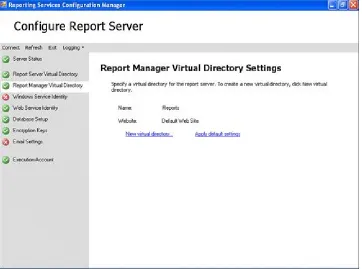
The default URL for Report Manager is http://<server>/reports (as shown in Figure 1.6). This is a default virtual directory in which Report Manager is installed. A report administrator can later change this URL by editing configuration files or using the Reporting Services Configuration Manager, as shown in Figure 1.7.
Figure 1.7. Reporting Services Configuration
Manager.
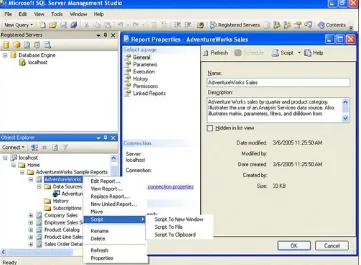
Using SQL Server Management Studio, shown here in Figure 1.8, an administrator can perform most of the operations that she would otherwise perform through Report Manager. SQL Server Management Studio can access the SSRS catalog
directly and does not require the SSRS Windows Service to be running to change the report's properties. However, an
administrator will not be able to view the report if the SSRS Windows Service is not running.
Figure 1.8. Managing within SQL Server
Management Studio.
Table 1.2 presents a summary of the management features of SSRS.
Table 1.2. SSRS Management Features
Feature Details
Browser-based management: Report Manager
Manages and maintains reports and the reporting environment.
Windows-based management: SQL Server Management Studio NEW in
2005
Manages and maintains reports and the
reporting environment; included in SQL Server Management Studio. Provides slightly better performance than the browser-based tool in addition to the convenience of a single point of access (SQL Server Management Studio) for management of all SQL Server-related components.
Command-line
Scripting support Helps automate server administration tasks. For example, an administrator can script deployment and security settings for the group of reports, instead of doing the same one by one using Report Manager.
Folder hierarchy Organizes reports by certain criteria, such as reports for specific groups of users (for example, a folder for the sales department).
Role-based security Controls access to folders, reports, and resources. Security settings get inherited
through the folder structure, similar to Windows folders security inheritance. Security can be inherited through the hierarchy or redefined at any level of hierarchy: folder or report. Role-based security works with Windows
authentication. Security is installed during SSRS installation.
Job management Monitors and cancels pending or in-process reports.
Shared data sources Share data source connections between multiple reports and are managed independently from any of the reports.
Shared schedules Share schedules between multiple reports and are managed independently from any of the reports.
History Allows storing snapshots of a report at any particular moment of time. You can add report snapshots on an ad hoc basis or as a recurring scheduled operation. History can be used to view past versions of a report and see how
information on a report has changed.
Linked reports Create a link to an existing report that provides a different set of properties, parameter values, or security settings to the original report. To the user, each linked report appears to be a
standalone report.
XML-based server
Database, server, and report logging capability
Contains information about the reports that execute on a server or on multiple servers in a single web farm. You can use the report
execution log to find out how often a report is requested, what formats are used the most, and what percentage of processing time is spent on each processing phase.
The true test of an enterprise system is shown by its ability to scale from a single user to up to thousands across an
enterprise. The second test of an enterprise system is to maintain uptime and reliability. SSRS passes both tests.
SSRS manages these tasks by using underlying Windows
technologies. The simplest deployment of SSRS simply places all of the components on a single machine. That single machine can then be updated with bigger and better hardware. The
single machine deployment model provides a relatively cheap and cost-effective way to get up and running with SSRS.
SSRS can also be deployed across a network load balanced (NLB) cluster, giving it scalability and availability. The database catalog that SSRS uses can also be deployed across a clustered database server apart from the web servers. This allows for virtually limitless growth in terms of number of users
(scalability) and, at the same time, maximum availability.
Delivery Stage of the Reporting Life Cycle
During this stage, the report is distributed to the report's users and is available in multiple output formats. The SSRS retrieval mechanism allows users to quickly change an output format.
application), printer (requires custom extension), or file system. If the delivery method of interest is not available by default
from SSRS, you can relatively easily develop custom delivery extensions. SSRS Books-On-Line provides a complete set of samples for various custom delivery extensions. You can learn more about custom extensions in Chapter 26.
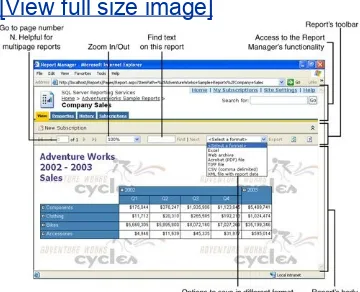
Reports are structured as items in a folder structure and allow for easy browsing and execution. You can see an example of viewing a report online in Figure 1.9. Please note that the report is shown inside of Report Manager. Report Manager provides an additional functionality, such as assigning security or subscribing to a report. You can also view the report directly in the browser without Report Manager.
Figure 1.9. Online viewing.
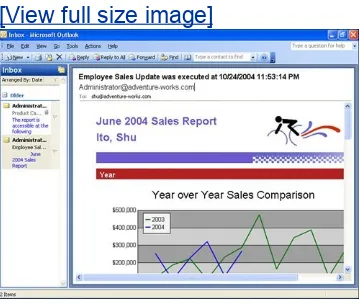
Alternatively, a user can subscribe to a report that subsequently will be delivered via email, as shown in Figure 1.10. Email
delivery is a push-model of report delivery. Push-model is
especially useful for the cases in which report generation takes a long time, the report needs to be delivered to an outside user, or there is an emergency situation that generates an exception report.
Figure 1.10. Email delivery.
[View full size image]
all-encompassing.
A perfect example of this is via embedded reporting. With Visual Studio 2005, Microsoft has developed an integrated Report
Viewer control. This control allows developers to embed SSRS reports into their Windows and web applications. Figure 1.11
shows the Report Viewer control.
Figure 1.11. Report Viewer control.
[View full size image]
the same web service calls. For example, with the API,
developers can modify permissions and create custom from ends.
Lastly, SSRS security is extensible. This allows access to SSRS reports from any custom portal such as SharePoint. SSRS
Editions of Reporting Services
SSRS comes in four editions that mirror the editions of SQL Server and Visual Studio. These editions range from free starter editions to full-scale Enterprise editions.
Chapter 4, "Reporting Services Deployment Scenarios," has more information on the different editions and supported
features. Table 1.3 offers a high-level overview of the different editions of SSRS.
Table 1.3. Overview of SSRS Editions
Edition Quick Overview
Express Express edition offers a lightweight edition of SSRS for developers who want to learn how to use SSRS.
Workgroup Workgroup edition is for use in small
departmental organizations or branch offices. Should needs increase, Workgroup edition can be upgraded to Standard or Enterprise editions.
Standard Standard edition is for use in small- to medium-sized organizations, or in a single server
environment. Standard edition supports all of the features of SSRS, except highly specialized data-driven subscriptions, and infinite drill down through Report Builder.
Enterprise Enterprise edition is for use in large organizations with complex database and reporting needs. Enterprise edition is fully functional, and supports scale out functionality across a web farm.
How Is SSRS Licensed?
The short answer is that every machine running SSRS has to be licensed as if it were running SQL Server. This means that any machine running SQL Server is automatically licensed for not just SQL Server, but for the entire Microsoft Business
Intelligence platform. This includes SSRS, SSAS, SSNS, and SSIS. This makes it really easy to get one's feet wet with SSRS. Simply install SQL Server on one machine, and then install
SSRS. On the flip side, if the choice was made to use Enterprise edition in a web farm scale-out scenario, every machine in the web farm has to be licensed to run SQL Server.
Microsoft offers three ways to license SQL Server. Table 1.4
summarizes the licensing options for SQL Server. For more information and specific costing options, you should contact your Microsoft sales representative or reseller.
Table 1.4. Licensing Options for SQL Server
License Options Description
Per processor Licenses are paid for each processor on the machine running SQL Server. This license is optimal for web facing or Business to Business machines running SQL Server. It is also helpful for very large user populations.
Server licence plus device Client Access Licenses (CALs)
Licenses are paid for the machine running SQL Server, and for every device connecting to SQL Server. An ideal situation for this is kiosks for which there are multiple users per device.
Server licence plus
Tip
When determining the most appropriate
licensing model, please make sure to calculate the total license cost for each option and
Summary
This chapter provided a high-level overview of SSRS features. It started with an overview of tools for the end user. From there, it showed how different SSRS features can be leveraged in the report development life cycle. Finally, it concluded with an overview of the different editions of SSRS, and how it is licensed.
The following chapters build on the content covered here, and delve into the capabilities of SSRS reports and into the
Chapter 2. Reporting Services
Capabilities: Presentation, Navigation,
and Programmability
In This Chapter
Report Layouts
Report Presentation (Rendering) Formats
Report Items, Visual Effects, and Charting
Report Navigation
Ad Hoc Reports NEW in 2005
Reporting Services Data Access Features
Programmability
Building on basics covered in the previous chapter, this chapter provides a deeper overview of features in SSRS, from rendering reports to programmability. Along the way, any new features that were not available in the previous version are pointed out. Specific topics include the following:
Report items
Report navigation
Ad hoc reporting
Report Layouts
SSRS has three report layout options for developers to choose from during the design phase: tabular (top-down, row-by-row, column aligned output), matrix (top to bottom and left to right, column- and row-aligned output), and free-form. Developers can combine various layouts on a single report. More detailed discussion about report layouts is available in Chapter 11, "Working with Report Items."
The report presented in Figure 2.1, taken as a whole, has a combination of layouts: free-form and tabular.
Figure 2.1. Tabular and free-form layout.
Tabular Report Layout
The tabular report layout is designed to display column-based data. This type of report is very similar to the way data is presented in a Microsoft Excel worksheet.
In the tabular report, developers can group and summarize
data using aggregate functions. Aggregate functions include Sum, Avg, Min, Max, and Count. Tabular report layout propagates from
top to bottom, row-by-row and allows grouping rows. Using a Table data region is the most common way to generate the
tabular report layout. Unlike a table, a list does not provide item alignment; however, this type of layout could also be created using a list. Figure 2.1 includes a tabular layout.
A large portion of reports are developed in a tabular layout.
Free-Form Report Layout
As the name implies, free-form layout can contain repetitive or nonrepetitive data; items can be free-form, grouped, nested within each other (providing multiple levels of grouping), and/or located side by side. Much like a Microsoft Office document, a report contains three main areas: the body (the main
informational content of a report), a page header (the
information that repeats at the top of each page of a report), and a page footer (the information that repeats at the bottom of each page of a report).
A header and a footer can contain a limited subset of report items: images, text boxes, and lines. A report's body can
container in that it allows you to place report items in any
position and, unlike tabular (or matrix) layout, does not restrict this position.
In addition, rectangle and list report items can be used as free-form containers for other report items. A free-free-form layout is shown in Figure 2.1.
Matrix Report Layout
Matrix layout (see Figure 2.2) is similar to a cross-tab or pivot table in Excel. Unlike table layout, which has a static number of columns and a dynamic number of rows, matrix layout has a dynamic number of rows and a dynamic number of columns. In other words, matrix layout propagates from top to bottom and from left to right. In turn, matrix layout allows grouping and summarizing by rows and columns. Developers can use
aggregate functions for each group of rows and/or columns.
Figure 2.2. Matrix report layout.
Report Presentation (Rendering) Formats
SSRS offers a choice of presentation formats for the report. The following formats are available: Extensible Markup Language (XML), web-oriented Hypertext Markup Language (HTML, HTML with Office Web Components, and Web archive MHT), page-oriented such as Tagged Image File Format (TIFF) or Portable Document Format (PDF), and desktop application (Excel and CSV) formats.
Report Items, Visual Effects, and Charting
Presentation elements in SSRS are called report items. Report items are very similar to visual controls available in Visual Studio languages, such as Visual Basic and C#. Report items are classified as data regions, containers, and independent
report items. Data regions support grouping and sorting of data and provide repetitive display of rows (or groups of rows) from a data set associated with a data region. Independent report items display a single value or a single image.
Containers contain other report elements, including data
regions. A container is fixed when the position of a report item is fixed. Most, but not all, of the containers are also data
regions. Thus, data regions can be nested within other data regions.
Note
Report Builder does not support nested data regions.
Developers can create visual effects by using rectangles, lines, and images (embedded or referenced) in a report. SSRS has extensive capabilities to specify properties of items on a report, including border, color, background color, and so on. For
example, a report can include bold totals and red negative
numbers. A report can include score card graphics, like a traffic light, with red indicating problematic areas and green
highlighting areas where everything is well.
charts. Just like any other data region, a chart has to be associated with one of the report's data sets to be able to display data. See Figure 2.3 for sample charts.
Figure 2.3. Report using bar and pie charts.
[View full size image]
A chart has comprehensive functionality and is very similar by capabilities to an Excel chart with a variety of chart types, 3-D effects, and more. Unlike an Excel chart, an SSRS chart does not build a trend line internally; however, this limit can be overcome by calculating values for a trend line in the data set and then providing it to a chart.
The chart control used in this release of Reporting Services is licensed from Dundas Software (www.dundas.com). In addition, a more comprehensive version of the chart can be purchased from Dundas Software.
List, Table, Matrix, and Chart report items are data regions. The Line, Text Box, Image, Rectangle, and Subreport report are independent items. Table 2.1 provides a summary of SSRS design elements.
Table 2.1. Report Items
Design
Element Description DataRegionContainer
Table Presents data with static columns and expands row by row. Allows developers to group and sort rows of data. Can have multiple groups. Table is faster than Matrix and List, which makes Table the fastest of all data regions. Table is a very powerful control and can be used for most reports.
Yes Fixed
Matrix Capable of having a dynamic number of rows and columns and expands row by row and column by column. Can act like a table (fixed columns, dynamic rows) or like a transposed table (fixed rows and dynamic columns).Allows developers to group and sort rows and columns of data. Can have multiple groups. Matrix can also be used when you want to transpose your data, that is, when you want to turn records into columns of your data. Also knownas cross-tab or pivot.
Yes Fixed
List[1] Presents data in a free-form fashion for complex
repeating areas. List repeats items based on the associated data set. Allows developers to group and sort rows of data. A single list can have only a single group, but lists can be nested within each other to provide multiple grouping.
Chart Provides a graphic presentation of data. Supports bar, pie, line, and many more chart types. Functionality is comparable to an Excel chart.
Yes Fixed
Text Box Displays all text data in the report. A table or matrix cell is a text box by default. Individual text boxes can be placed anywhere on a report and can include labels, data set fields, or calculated data.
No No
Image Displays an image. An image can be loaded from a URL, embedded in a report, or stored in a database. SSRS supports .bmp, .jpeg, .jpe, .gif, and .png image formats.
No No
Line Graphical element with no data associated with it. Can be placed anywhere on a report. Has styles commonly associated with lines: weight, color, and so on.
No No
Rectangle Provides a graphical element or a container for other report items. Can be placed anywhere on a report.
No Free-form
Subreport Provides a container for the body of another report on the report server. Better performance can be achieved by using data regions, instead of subreports.
No Free-form
Report Navigation
Developers can add interactive features to navigate to related reports (jump to report or URL) or within a single report (find, go to page, jump to bookmark, and document map).
Developers can add links to related reports, reports that have more details (drill down through or simply drill through), or, in general, to any web page. Bookmarks and document maps provide navigation within a large report.
For multipage reports, SSRS provides functionality to move through pages of the report, go to a specified page, and go to the beginning or the end of the report. In addition, users can search through a report for a string that they specify in search criteria.
If a report is too big or too small for a page, the zoom capability comes in handy. Users can zoom-in and zoom-out on the
report's page when using web-oriented formats (HTML,
HTMLOWA). Other formats such as PDF handle zoom through corresponding applications, such as Adobe Acrobat Reader.
After a user accesses the Reporting Services site, she can navigate a folder hierarchy to find reports and other items. In addition, reports can be added to a Favorites list in a web browser, presented via a web portal. Users can store and manage reports and other items in a personal workspace.
Ad Hoc Reports
NEW in 2005
This is a new capability that was added for SSRS and was not available prior to this release. Microsoft provides the Windows application Report Builder NEW in 2005 tool to support this functionality. Report Builder uses models generated by the Model BuilderNEW in 2005 tool.
Model Builder is a tool used by database developers to abstract the complexities of the database schema, and provide
information analysts with a view of "business objects" to which analysts can relate. The model also allows developers to relate the business objects (or entities) to other objects within the database. Because the model contains information on the underlying database schema, as well as how to abstract it, it becomes integral to ad hoc reporting. After a model is
complete, it is published to the report server, just as any report.
Reporting Services Data Access Features
SSRS data-processing extensions use ADO.NET-managed
providers and support a variety of data sources. SSRS includes the following providers: SQL Server (7.0-2005), SQL Server Analysis Services (2000-2005), Oracle, ODBC, and OLEDB. Other providers are usually available from corresponding
database vendors. In general, SSRS can populate reports with relational and multidimensional data from SQL Server, Analysis Services, and other .NET Framework data providers. Developers can also create custom data-processing extensions if there is no provider available for the specific data source.
SSRS allows using multiple data sources and multiple data sets within a single report. This allows developers, for example, to combine data from the SQL Server transactional database, SQL Server Analysis Services data warehouse, and Oracle database on the same report.
Developers can add parameters to refine a query or filter a data set. Dynamic parameters get values at runtime based on user selections (the selection of one parameter can build the value list for a second parameter).
Several new features were added to SSRS:
NEW in 2005Multidimensional Expressions (MDX)
query parameters A tool that allows you to pass parameters to multidimensional queries.
NEW in 2005MDX query designer An intuitive tool to develop multidimensional queries with a simple drag and drop.
designer An intuitive tool to develop data-mining queries with a simple drag and drop.
NEW in 2005Multivalued parameters A tool that allows
Programmability
This feature provides endless possibilities for developers to
extend SSRS. For example, developers can script administrative functionality, execute a report asynchronously[1] (using
BeginRender and EndRender functions) within their code, and more. Table 2.2 provides a summary of programmable features in SSRS.
[1] Asynchronous execution can be also accomplished within a custom extension. Additional asynchronous options are to schedule a snapshot or to subscribe to a report.
Table 2.2. Reporting Services Programmability and Extensibility Features
ProgrammableFunctionality Notes Language
Custom embedded code A code is embedded as a part of the report definition file and compiled together with the container report. Many errors are caught by the compiler when a reporting solution is built. Although embedded code allows a developer to use full object-oriented functionality of VB.NET, embedded code is mostly used for simple logic. Developing complex embedded code is possible, but not usually done due to limited debugging facilities and limited functionality of the
embedded code editor. The embedded code editor is a simple text box that does not have advanced features, such as code completion, which is available in Visual Studio.
VB.NET
Custom assembly A .NET assembly, which can be written in any .NET language and can be called from a report. Visual Studio .NET is the most popular tool for .NET development and provides full debugging capacities for .NET assemblies. Custom
assemblies can be used for complex logic and, for example, in cases when access to a file I/O or database is needed.
Any .NET
service/SOAP API The programmatic interfaces that provide anentry point to the complete functionality of SSRS. Reporting Services web service can be
called from .NET or SOAP-enabled applications and provides access to full Reporting Services functionality, including rendering, report management, report and folder browsing, and report deployment. Mainly used to incorporate report processing or management in custom web or Windows applications.
or SOAP-enabled application
SSRS scripts (rs.exe utility) The utility that provides access to Reporting Services web service by executing VB.NET scripts. Scripting allows a developer to use full object-oriented functionality of VB.NET and is mainly used to automate SSRS' management.
VB.NET
URL Access The tool that provides access to various features of Reporting Services through a parameterized URL string. Designed to retrieve rendered output, URL Access can be used with GET and POST methods and can be integrated in a web portal "as is" or as a source for a frame. URL Access can also be incorporated in a Windows or a webapplication using WebBrowser control.
HTML/URL
Report Definition Language
(RDL) The language that is an open and extensibleXML-based language that describes a report. Developers can write tools to customize RDL files, for example tools similar to the Report Designer. In addition, developers can add support for elements or features that are not present in the existing RDL schema, and then build custom tools and report-rendering extensions to handle new functionality.
RDL (XML)
Reporting Services extensions The appropriate hooks to enable developers to extend SSRS' functionality and write custom extensions. For example, delivery (cell phones, pagers, other applications), data processing, rendering, report processing, and security (security extensions are not available in Express edition) can be extended with new extensions.
Any .NET language: VB.NET, C#, and so on
WMI interfaces (manage SSRS
configuration) The interface used to manage Report ServerWindows service configuration. Can beused from any .NET application
Report Viewer controlNEW in
2005
The Web and Windows controls that make it easier to integrate reporting functionality into applications. Report Viewer can view server and local reports. Local reports rendered by the
Report Viewer control do not require access to
SSRS. application
In Reporting Services 2000 (as well as 2005), developers can use the WebBrowser control to embed reports in an application. WebBrowser is a simple HTML viewer and does not have
advanced capabilities of Report Viewer, such as an ability to render reports.
RSPrintClientNEW in 2005 The control that presents the Print dialog box for a user to initiate a print job, preview a report, specify pages to print, and change the margins. Developers can use this control in the code to enable report printing functionality.
Can be used from any .NET language application
SharePoint Web Parts (Viewer
and Explorer) Similar to report controls, the control that assistsintegration with SharePoint Portal applications. Web Parts had shipped with Reporting Services 2000 SP2. SSRS 2005 is the first version that includes it in the initial install.
SharePoint serves as a
container
Expressions A combination of variables, constants, functions, and operators that evaluate to a single data value. Simple expressions can be a constant, variable, column, or scalar function. Complex expressions are one or more simple expressions connected by operators. Most properties of the report take expressions. Expressions use VB.NET syntax and are technically very similar to Excel formulas. Expressions use Visual Basic runtime functions, most identical to functions used in Excel, such as IIF.
VB.NET
Custom report items NEW in
2005
The server controls that extend report
processing. Custom report items can be data bound and use familiar SSRS VB.NET,
functionality, such as expressions, grouping, sorting, and filtering. Custom report items can have its custom user interface and properties. Developers can add custom report items to a Report Designer toolbox. SSRS provides an infrastructure to support custom report items.
Any .NET language: C#, and so on
Summary
This chapter provided an overview of features in SSRS in the areas of data retrieval, presentation, navigation, and
programmability. SSRS added several new features to the
future mix that was available in the previous version, to name a few:
End-user capability to develop ad hoc reports
Intuitive, drag-and-drop editors for Multidimensional Expressions (MDX) and Data Mining Extensions (DMX)
New controls to integrate reports (ReportViewer) and report printing (RSPrintClient) in Windows or web applications
Ability to add custom (not defined in RDL) report items
Chapter 3. Reporting Services
Architecture
In This Chapter
Report Server Web and Windows Service
Programmatic Interfaces
Report Processor
Command-Line Utilities
Reporting Services Extensions
Report Server Databases
Scheduling and Delivery Processor
Report Builder NEW in 2005
Report ModelDesigner NEW in 2005
Report Designer
SQL Server Management Studio NEW in 2005
Reporting Services Configuration Tool NEW in 2005
RSPrintClient Control NEW in 2005
WMI Provider
Performance Monitoring Objects
SSRS is a comprehensive and extensible reporting platform, which includes an integrated set of processing components, programmatic interfaces, and tools. Processing components are the basis for the multilayered architecture of SSRS and interact with each other to retrieve data, process layout, render, and deliver a report to a target destination. SSRS supports two categories of components:
Processors Ensure integrity of SSRS and supply an infrastructure that enables developers to add a new functionality (extensions). Processors itself are not extendable in this release of SSRS.
Extensions Assemblies that are invoked by processors and perform specific processing functionality, such as data
retrieval. Developers can write custom extensions.
Figure 3.1. Reporting Services architecture.
Report Server Web and Windows Service
The Report Server is implemented as a symbiosis between a web service and Windows service. Services work together to host, process, and deliver reports.
Note
In SSRS 2005, Report Server supports multiple instances on a single computer.
When SSRS Windows service starts, it initially loads basic supporting assemblies (such as a SQL data provider and interface library), but it does not load extensions. In this release, SSRS Windows service handles encryption and
decryption and serves as a host for the Scheduling and Delivery Processor. The Scheduling and Delivery Processor uses a
PollingInterval configuration setting to monitor SSRS catalog's Event table for "events" (such as timed subscription). Events
instruct SSRS to "wake up" and start processing.
Similar to any .NET web service, SSRS web service is invoked ("wakened up") via Internet Information Server (IIS) and executes in the ASP.NET worker process (aspnet_wp.exe). "Wake
Programmatic Interfaces
The Reporting Services programmatic interfaces accept SOAP (via SSRS web service) and HTTP requests (via URL Access). For more information about SSRS web service, please see
Chapter 25, "How to Use Reporting Services Web Service." For more information about SSRS URL Access, please see Chapter 24, "How to Use URL Access."
SSRS 2005 web service provides three endpoints:
http://localhost/ReportServer/ReportService.asmx is provided for backward compatibility with SSRS 2000.
http://<server>/ReportServer/ReportService2005.asmx is the new management endpoint in SSRS 2005.
http://<server>/ReportServer/ReportExecution2005.asmx is the new execution endpoint.
The name of an endpoint describes the purpose. For example, the execution endpoint is designed to provide report execution (processing) interfaces and, with that, an access to functions, such as Render. Function Render returns a rendered report as a
stream with a specified format, such as HTML.
Programmatic interfaces facilitate retrieval of information from the SSRS catalog and information exchange between SSRS components.
Report Processor
The Report Processor ties components of a report server
together and takes care of caching within SSRS. Caching refers to an ability of the SSRS to keep a copy of a processed report and return that copy when a user opens the report. Caching can shorten the time required to retrieve a report, especially if the report is large or is accessed frequently. All report caches are stored in the SSRS catalog (specifically ReportServerTempDB database) and survive both SQL Server and Report Server restarts.
Report Processor performs the following operations:
Execution Retrieves a report definition and combines it with data retrieved by the data-processing extension. This operation generates an intermediate format.
Rendering Renders the intermediate format to a requested output format using rendering extensions.
Processing of models This is similar to Execution
operation for reports that are generated by Report Builder and contain a semantic model (or simply a model, which serves as a data source for a report) and a semantic query. Semantic query refers to a query performed against a
model that, in turn, just like a SQL query, generates a report's data set.
This is how Report Processor responds to users' requests:
Request to generate cache or snapshot Intermediate format is generated and stored in the database.
Command-Line Utilities
Three administration assistance utilities are installed automatically during the Reporting Services install:
rs.exe Host scripting operations. Developers can, for
example, create VB.NET script to deploy a set of reports. You can find more details about this utility in Chapter 25.
rsconfig.exe Use to modify encrypted connection information
to the Report Server database.
rskeymgmt.exe Back up/restore symmetric keys for encrypted
data used by a report server or delete encrypted data if the key is lost. For more details, please see Chapter 21,
"Deploying and Configuring SSRS."
Note
SSRS 2005 discontinued the rsactivate.exe utility,
which was used in the previous release to
Reporting Services Extensions
An extension is a .NET Assembly that is invoked by the Report Processor to perform certain processing functions. There are several types of extensions: Data Processing, Delivery,
Rendering, Security (authentication and authorization), SemanticQuery, ModelGeneration, and EventProcessing.
For an extension to be used by a report server, it has to be
installed (assuming default SSRS configuration) to the C:\Program Files\Microsoft SQL Server\MSSQL.3\Reporting Services\ReportServer\bin
directory and configured in C:\Program Files\Microsoft SQL
Server\MSSQL.3\Reporting Services\ReportServer\rsreportserver.config.
The last part of an extension filename usually implies the extension's functionality. For example, the HTML rendering
extension's filename is Microsoft.ReportingServices.HtmlRendering.dll.
Custom extensions allow developers to add complementing functionality that is not available in SSRS "out-of-the-box." For example, a company can implement an extension that delivers reports to a phone or a fax. You can learn more about
extensions in Chapter 26, "Writing Custom Reporting Services Extensions."
Note
This release of SSRS does not allow custom SemanticQuery, ModelGeneration, or