Next Page Professional SQL Serv er Analysis Serv ices 2005 with MDX
bySivakumar HarinathandStephen R. Quinn Wrox Press 2006 (856 pages)
ISBN:0764579185
W ritte n by m e m be rs o f the Ana lysis Se rvice s pro duct te a m a t Micro so ft, this tim e ly, a utho rita tive bo o k sho ws yo u ho w to use Ana lysis Se rvice s with SQ L Se rve r co m po ne nts to pro vide co m pre he nsive , e nd-to -e nd so lutio ns.
Table of Contents
Professional SQL Server Analysis Services 2005 with MDX Introduction
Section I - Introduction
C hapter 1 - Introduction to Data Warehousing and Analysis Services 2005 C hapter 2 - First Look at Analysis Services 2005
C hapter 3 - Introduction to MDX
C hapter 4 - Working with Data Sources and Data Source Views C hapter 5 - Dimension Design
C hapter 6 - C ube Design Section II - Adv anced Topics C hapter 7 - Advanced Topics in MDX C hapter 8 - Advanced Dimension Design C hapter 9 - Advanced C ube Design
C hapter 10- Extending MDX using External Functions
Section III - Administration, Performance Tuning Integration C hapter 11- Updating Your UDM Data
C hapter 12- Administering Analysis Services C hapter 13- Performance Optimization C hapter 14- Data Mining
C hapter 15- Analyzing C ubes using Office C lient C omponents C hapter 16- Integration Services
Section IV - Scenarios C hapter 17- Reporting Services C hapter 18- Designing Real-Time C ubes
C hapter 19- Securing Your Data in Analysis Services Appendix A- MDX Function and Operator Reference Index
List of Figures List of Tables List of C ode Examples
Next Page
Ba ck Cov e r
SQL Server Analysis Services 2005 provides you with the business intelligence platform needed to build full-scale, multidimensional databases. MDX is the query language used to extract information from those multidimensional databases. Analysis Services 2005 supports core business functions such as market analysis, budgeting and forecasting.
Written by members of the Analysis Services product team at Microsoft, this timely and authoritative book shows you how to use Analysis Services along with SQL Server components like Integration Services, Data Mining, and Reporting Services to provide comprehensive, end-to-end solutions. Ultimately you'll learn to solve business problems by leveraging all the tools that SQL Server 2005 has to offer.
What you will learn from this book
The development process for designing Unified Dimensional Models (UDM) Using MDX to query databases and for sophisticated business analysis
How to harness features such as multiple measure groups, BI wizards, Key performance indicators, and Actions
How to integrate Analysis Services with other SQL Server 2005 components in order to provide the best possible end-to-end solutions How to manage and secure Analysis Services efficiently in support of your BI users
How to optimize your design and/or scale Analysis Services to extract the best performance Who this book is for
This book is for database and data warehouse developers and administrators interested in exploiting the power of BI and leveraging the SQL Server 2005 tool set.
About the Authors
Sivakumar Harinath was born in C hennai, India. Siva has a Ph.D. in C omputer Science from the University of Illinois at C hicago. His thesis title was: "Data Management Support for Distributed Data Mining of Large Datasets over High Speed Wide Area Networks." Siva has worked for Newgen Software Technologies (P) Ltd., IBM Toronto Labs, C anada, and has been at Microsoft since February of 2002. Siva started as a Software Design Engineer in Test (SDET) in the Analysis Services Performance Team and is currently an SDET Lead for Analysis Services 2005. Siva's other interests include high performance computing, distributed systems and high speed networking.
Stephen Quinn was born in San Luis Obispo, C alifornia. Stephen has a Masters degree (1988) in C ognitive Psychology from C alifornia State University, C hico and is scheduled to receive his Masters of Business Administration (MBA) from the University of Washington, Seattle, in June 2006. He has been in most roles common to the R&D environment i.e., software developer, technical writer, technical support specialist and several quality assurance roles. Stephen has published some 20 articles in the magazines Byte, InfoWorld and Datamation. With 15+ years of software experience; Stephen has worked the last 8 years at Microsoft; most recently as a Technical Writer in SQL User Education and before that, for several years as Test Manager in the SQL Business Intelligence Unit.
Next Page
No part of this publication may be reproduced, stored in a retrieval system or transmitted in any form or by any means, electronic, mechanical, photocopying, recording, scanning or otherwise, except as permitted under Sections 107 or 108 of the 1976 United States Copyright Act, without either the prior written permission of the Publisher, or authorization through payment of the appropriate per-copy fee to the Copyright Clearance Center, 222 Rosewood Drive, Danvers, MA 01923, (978) 750-8400, fax (978) 646-8600. Requests to the Publisher for permission should be addressed to the Legal Department, Wiley Publishing, Inc., 10475 Crosspoint Blvd., Indianapolis, IN 46256, (317) 572-3447, fax (317) 572-4355, or online at http://www.wiley.com/go/permissions.
LIMIT OF LIABILITY/DISCLAIMER OF WARRANTY: THE PUBLISHER AND THE AUTHOR MAKE NO REPRESENTATIONS OR WARRANTIES WITH RESPECT TO THE ACCURACY OR COMPLETENESS OF THE CONTENTS OF THIS WORK AND SPECIFICALLY DISCLAIM ALL WARRANTIES, INCLUDING WITHOUT LIMITATION WARRANTIES OF FITNESS FOR A PARTICULAR PURPOSE. NO WARRANTY MAY BE CREATED OR EXTENDED BY SALES OR PROMOTIONAL MATERIALS. THE ADVICE AND STRATEGIES CONTAINED HEREIN MAY NOT BE SUITABLE FOR EVERY SITUATION. THIS WORK IS SOLD WITH THE UNDERSTANDING THAT THE PUBLISHER IS NOT ENGAGED IN RENDERING LEGAL, ACCOUNTING, OR OTHER PROFESSIONAL SERVICES. IF PROFESSIONAL ASSISTANCE IS REQUIRED, THE SERVICES OF A COMPETENT PROFESSIONAL PERSON SHOULD BE SOUGHT. NEITHER THE PUBLISHER NOR THE AUTHOR SHALL BE LIABLE FOR DAMAGES ARISING HERE-FROM. THE FACT THAT AN ORGANIZATION OR WEBSITE IS REFERRED TO IN THIS WORK AS A CITATION AND/OR A POTENTIAL SOURCE OF FURTHER INFORMATION DOES NOT MEAN THAT THE AUTHOR OR THE PUBLISHER ENDORSES THE INFORMATION THE ORGANIZATION OR WEBSITE MAY PROVIDE OR RECOMMENDATIONS IT MAY MAKE. FURTHER, READERS SHOULD BE AWARE THAT INTERNET WEBSITES LISTED IN THIS WORK MAY HAVE CHANGED OR DISAPPEARED BETWEEN WHEN THIS WORK WAS WRITTEN AND WHEN IT IS READ.
For general information on our other products and services please contact our Customer Care Department within the United States at (800) 762-2974, outside the United States at (317) 572-3993 or fax (317) 572-4002.
Trademarks: Wiley, the Wiley logo, Wrox, the Wrox logo, Programmer to Programmer, and related trade dress are trademarks or registered trademarks of John Wiley & Sons, Inc. and/or its affiliates, in the United States and other countries, and may not be used without written permission. SQL Server is a trademark of Microsoft Corporation in the United States and/or other countries. All other trademarks are the property of their respective owners. Wiley Publishing, Inc., is not associated with any product or vendor mentioned in this book.
Wiley also publishes its books in a variety of electronic formats. Some content that appears in print may not be available in electronic books. About the Authors
Sivakumar Harinath
Sivakumar Harinath was born in Chennai, India. Siva has a Ph.D. in Computer Science from the University of Illinois at Chicago. His thesis title was: "Data Management Support for Distributed Data Mining of Large Datasets over High Speed Wide Area Networks." Siva has worked for Newgen Software Technologies (P) Ltd., IBM Toronto Labs, Canada, and has been at Microsoft since February of 2002. Siva started as a Software Design Engineer in Test (SDET) in the Analysis Services Performance Team and is currently an SDET Lead for Analysis Services 2005. Siva's other interests include high performance computing, distributed systems and high speed networking. Siva is married to Shreepriya and had twins Praveen and Divya during the course of writing this book. His personal interests include travel, games/sports (in particular, Chess, Carrom, Racquet Ball, Board games) and Cooking. You can reach Siva at
[email protected] Stephen Quinn
Stephen Quinn was born in San Luis Obispo, California. Stephen has a Masters degree (1988) in Cognitive Psychology from California State University, Chico and is scheduled to receive his Masters of Business Administration (MBA) from the University of Washington, Seattle, in June 2006. Stephen is married to Katherine and is raising his daughter, Anastasia. He has been in most roles common to the R&D environment i.e., software developer, technical writer, technical support specialist and several quality assurance roles. Stephen has published some 20 articles in the magazines Byte, InfoWorld and Datamation. With 15+ years of software experience; Stephen has worked the last 8 years at Microsoft; most recently as a Technical Writer in SQL User Education and before that, for several years as Test Manager in the SQL Business Intelligence Unit. You can reach Stephen at [email protected]
Beth Brooks
I dedicate this book in the grandest possible manner to my dear wife Shreepriya who has been fully supportive and put up with me disappearing from home and the late nights when I worked on this book. It is also dedicated to my two month old twins Praveen and Divya who do not know what a book is yet. I wish their cute photographs could be on the cover page. I dedicate this book in memory of my father Harinath Govindarajalu who passed away in 1999 who I am sure would have been proud of this great achievement and to my mother Sundara Bai. Finally, dedicate the book to my inlaws Sundaravathanem Sanjeevi and Geethalakshmi Sanjeevi who have been very supportive and helping during the last six months.
Sivakumar Harinath
I dedicate my contribution to this book to the woman who was most supportive and encouraging about the project. That would be my wife, Kyung Eun (Katherine) Quinn. Also, I would like to dedicate this to my kid, Anastasia who would have preferred I spent much of that writing time with her. To my mother, Roselma Quinn who tolerated incessant last minute changes of plan due to book-related work. And my father, Stephen Thomas Quinn, who tolerated my whining about how much work this book was to produce. Finally, to my MBA study team, thanks to everyone on the team; Jim Braun, Liz Younger, Michael Styles, Kevin Heath, Eduardo Alvarez-Godinez, and Dave Lovely for being understanding about what I was going through. Stephen R. Quinn
In memory of all those who have been devastated due to the natural calamities in the last two years such as the South Asian Tsunami, Storms Katrina and Rita in the United States and earthquakes in India and Pakistan.
Acknowledgments
Wow!!! It has been an amazing two-year journey, almost to the day, from when we decided to partner in writing this book. It all started when Siva jokingly mentioned to his wife the idea of writing a book on SQL Server Analysis Services 2005. She took it seriously and motivated him to start working on the idea in October of 2003. As always, there are so many people who deserve mentioning that we're afraid we'll miss someone. If you are among those missed, please accept our humblest apologies. We first need to thank Amir Netz, our then Product Unit Manager, who not only granted us the permission to moonlight while working at Microsoft, but also provided constant encouragement and support. It is apropos that it is called moonlighting because we saw a lot of moonlight while working on this book - multiple all nighters took place. We thank Zhaohui Tang, who helped us get in touch with the right publishing people. Our sincerest thanks go to Wiley Publishing for giving us this opportunity and placing their trust in first-time authors like us. They provided immense help, constant feedback, and expert support. We would especially like to thank our editors, Bob Elliot and Adaobi Obi Tulton, who didn't so much as support us as prod us along — which is exactly what we needed at the time. We would like to thank our technical reviewers, Leah Etienne and Dylan Huang, who graciously offered us their assistance. Dylan also contributed to the technical content in chapters 9, 11 and 13. We thank all our colleagues in the Analysis Services product team (including Developers, Program Managers, and Testers) who helped us in accomplishing the immense feat of writing a book on a developing product. From the Analysis Services team, special thanks go to Akshai Mirchandani, Richard Tkachuk, Mosha Pasumansky, Marius Dumitru, T.K. Anand, Sasha Berger, Paul Sanders, Thierry D'Hers, Matt Carroll, Andrew Garbuzov, Zhaohui Tang, Artur Pop, and Rob Zare for patiently answering our questions. We also thank our Analysis Services documentation colleagues Dennis Kennedy and Tom Mathews for their helpful input.
Most importantly, we owe our deepest thanks to our wonderful families. Without their support and sacrifice, this book would have become one of those many projects that one begins and never finishes. Our families were the ones who truly took the brunt of it and sacrificed shared leisure time, all in support of our literary pursuit. We especially want to thank them for their patience with us, and the grace it took not killing us during some of the longer work binges. During this long journey life did not stand still: Siva's wife gave birth to twins, Praveen and Divya, and Stephen finished the first year (plus part of the second) of MBA studies at the University of Washington, Seattle. Finally to Siva's wife, Shreepriya, and to Stephen's wife, Katherine, none of this would have been possible without your support.
Next Page
Introduction
We decided to write this book because we sensed the power and excitement associated with Analysis Services 2005 early on in its development, especially in relation to improvements over Analysis Services 2000. We also sensed that with minimal effort you could probably re-configure the user interface elements to pilot a nuclear submarine. Our recommendation, however, is to use Analysis Services 2005 to build, process, and deploy top of the line business intelligence applications. Ok, so we are not shy about admitting to the apparent complexity of the product when faced with the user interface, which happens to be embedded in the Microsoft Visual Studio shell. This is great for you, especially if you are already familiar with the Visual Studio development environment.
With this book, we want to show that not only will you overcome any possible initial shock regarding the user interface, you will come to see it as your friend. It turns out there are many wizards to accomplish common tasks, or you can design the analytic infrastructure from the ground up, it is up to you. This formidable, yet friendly user interface will empower you to implement business analytics of a caliber formerly reserved for academicians writing up government grant proposals or Ph.D. dissertations. More importantly, this power to turn data into information, and we mean, real usable business-related decision making information, can impact the bottom line of your company in terms of dollars earned and dollars saved. And that is what data warehousing, ultimately, is all about. Put another way, the purpose of all this data warehousing is simple; it is about generating actionable information from the data stores created by a company's sales, inventory, and other data sources. In sum, it is all about decision support.
Who This Book Is For
What was the impetus for you to pick up this book? Perhaps you are passionate about extracting information from reams of raw data; or perhaps you have some very specific challenges on the job right now that you think might be amenable to a business analysis based solution. Then, there is always the lure of fame and fortune. Please be aware that attaining expert status in data warehousing can lead to lucrative consulting and salaried opportunities. However, it won't likely make you as rich as becoming a purveyor of nothing-down real estate courses. If your desire is to leave the infomercial career path to others and get really serious about data warehousing in general and business intelligence in particular, you have just the book in your hands to start or continue on your path to subject mastery.
The obvious question now is what are the pre-requisites for reading and understanding the content of this book? You certainly do not have to already know the intricacies of data
warehousing, you will learn that here as you go. If you have only the foggiest notion of what a relational database is; well, this book is going to challenge you at best and bury you at worst. If you are not intimidated by what you just read, this book is for you. If you have worked on data warehouses using non-Microsoft products and want to learn how Microsoft can do it better, this book is for you. If you are a database administrator, MIS Professional or application developer interested in exploiting the power of business intelligence then this book is definitely for you!
Next Page
What This Book Covers
Analysis Services 2005 is the premier multi-dimensional database from Microsoft. This is the most recent of three releases from Microsoft to date. In this release, the tools and server provided have been designed for use as an enterprise-class Business Intelligence Server and we think Microsoft has been successful. Analysis Services 2005 provides you with powerful tools to design, build, test and deploy your multi-dimensional databases. By integrating the tools within Visual Studio you really get the feel of building a BI project. Similar to any application you build within VS; you build your BI projects and deploy them to Analysis Services instance. Due to the new product design and enhanced features you definitely have to know how to create cubes, dimensions and many other objects, maintain them, and support your BI users. Similar to its well-liked predecessors, Analysis Services 2005 supports the MDX language by which you can query data. MDX is for querying multi-dimensional databases much like SQL is for query of relational databases. The MDX language is a component of the OLE DB for OLAP specification and is supported by other BI vendors. Microsoft's Analysis Services 2005 provides certain extensions that help you to achieve more from your multi-dimensional databases.
This book walks you through the entire product and the important features of the product with the help of step by step instructions on building multi-dimensional databases. Within each chapter you will not only learn how to use the features but also learn more about the features at a user level and what happens behind the scenes to make things work. We believe this will provide you additional insight into how features really work and hence provide insight into how they are best exploited. It will also enhance your ability to debug problems which you might not have been able to otherwise. This behind the scenes view is often surfaced through exposure of the XML for Analysis XML/A created by the product based on user interface settings. It works like this; Analysis Services 2005 uses the XML/A specification to communicate between client and server — The Analysis Services 2005 tools communicate to the server using XML/A. Once you have designed your multi-dimensional database using the tools you need to send the definition to the server. At that time the tools use XML/A to send the definitions. You will learn these definitions so that you have the ability to design a custom application which interacts with an Analysis Services instance.
MDX is the language used for data retrieval from Analysis Services. You will get an introduction to the MDX language with basic concepts and the various MDX functions in this book. When you are browsing data using Analysis Services tools; those tools send appropriate MDX to the instance of Analysis Services which contains the target data. By learning the MDX sent to the server for the various desired operations you will begin to understand the intricacies of MDX and thereby improve your own MDX coding skills by extension.
One of the key value-adds found in this book, which we think is worth the price of admission by itself, is that through the chapters you will begin to understand what design trade offs are involved in BI application development. Further, the book will help you in do better BI design for your company in the face of those trade off decisions– especially with the help of a few scenarios. And there are many scenarios discussed in this book. The scenarios are geared towards some of the common business problems that are currently faced by existing Analysis Services customers. While there is no pretension that this book will teach you business per se, it is a book on BI and we did take the liberty of explaining certain business concepts which you are sure to run into eventually. For example, the often misunderstood concept of depreciation is explained in some detail. Again, this aspect of the book is shallow, but we hope what pure business concepts are covered will provide you a more informed basis from which to work. If you know the concepts already, well, why not read about the ideas again? There might be some new information in there for you.
Finally, this book covers integration of Analysis Services with other SQL Server 2005 components – Data Mining, Integrations Services and Reporting Services. These chapters will help you go beyond just a passing level of understanding of Analysis Services 2005; it is really integration of these disparate components which ship in the box with SQL Server which allow you to build start to finish BI solutions which are scalable, maintainable, have good performance characteristics, and highlight the right information. Do not skip the chapters which do not at first seem crucial to understanding Analysis Services 2005 itself; it is the whole picture that brings the real value. Get that whole picture for stellar success and return on your investment of time, and energy.
Next Page
How This Book Is Structured
The authors of books in the Wrox Professional series attempt to make each chapter as stand alone as possible. This book is no exception. However, owing to the sophistication of the subject matter and the manner in which certain concepts are necessarily tied to others has somewhat undermined this most noble intention. In fact, unless you are a seasoned data warehousing professional; or otherwise have experience with earlier versions of Analysis Services, it is advised you take a serial approach to reading chapters. Work through the first three chapters in order as they will collectively provide you some architectural context, a good first look at the product and an introduction to MDX. Just to remind you, in the simplest terms, MDX is to Analysis Services what SQL is to SQL Server. Ok, that was just too simple an analogy; but let's not get ahead of ourselves! As for the actual layout of the book, we have divided the book into roughly four major sections.
In Part 1 we introduce the basic concepts and then get you kick started using Analysis Services with most of the common operations that you need to design your databases. You will become familiarized with the product if you aren't already and hopefully it will provide you some sense of achievement which will certainly help motivate you to go beyond the simple stuff and move to the advanced.
Part 2 contains chapters that prepare you for the more advanced topics concerning the creation of multidimensional databases. You will learn about the calculation model in Analysis Services 2005 and enhance your dimensions and cube designs using Business Intelligence Development Studio Further you will learn more about the new features in the product such as multiple measure groups, business intelligence wizards, key performance indicators, and actions.
In Part 3 of the book, we include some of the common scenarios used in BI spread across four chapters (all with specific learning agendas of their own). The idea here is for you to get comfortable solving business problems and start you on your way to thinking about how to build larger scale BI databases. We also, we focus on real world business aspects of product usage. Like budgeting and forecasting and to be particularly real world, we have a whole chapter on the use of Office analysis components.
Finally, in Part 4, we cover the integration of Analysis Services with other SQL Server 2005 components that help you build solutions and provide the best support possible to your administrators and BI users. Both Integration and Administration along with Performance are absolutely key to get the maximum out of the system after initial design. This is also the section where you will find Data Mining.
Together, these four sections, that is to say, this book, will provide you a full blown BI learning experience. Since BI and BI applications constitute such an incredibly complex and massive field of endeavor, no one book can possibly cover it all. In terms of BI though the eyes of SQL Server Analysis Services 2005, we hope this book has got it covered!
We also encourage you to take a look at Appendix A; it is the complete MDX Reference as obtained from the Wiley Publishing book, MDX Solutions, 2nd Edition. The authors would like to thank George Spofford and Wiley Publishing for allowing use of that reference; it should come in handy for you.
Next Page
What You Need to Use This Book
You need a computer running some version of the Windows operating system, like Windows XP Professional for example, and a copy of SQL Server 2005 installed on that system. Please see the appropriate documentation from Microsoft for the hardware requirements needed to support the particular version of Windows you own.
Next Page
Conventions
To help you get the most from the text and keep track of what's happening, we've used a number of conventions throughout the book. Important Boxes like this one hold important, not-to-be forgotten information that is directly relevant to the surrounding text. NoteTips, hints, tricks, and asides to the current discussion are offset and placed in italics like this.
As for styles in the text:
We highlight new terms and important words when we introduce them. We show keyboard strokes like this: Ctrl+A.
We show file names, URLs, and code within the text like so: persistence.properties. We present code in two different ways:
In code examples we highlight new and important code with a gray background.
The gray highlighting is not used for code that's less important in the present context, or has been shown before.
Next Page
Source Code
As you work through the examples in this book, you may choose either to type in all the code manually or to use the source code files that accompany the book. All of the source code used in this book is available for download at http://www.wrox.com. Once at the site, simply locate the book's title (either by using the Search box or by using one of the title lists) and click the Download Code link on the book's detail page to obtain all the source code for the book.
NoteBecause many books have similar titles, you may find it easiest to search by ISBN; for this book the ISBN is 0-764-579185
Once you download the code, just decompress it with your favorite compression tool. Alternately, you can go to the main Wrox code download page at http://www.wrox.com/dynamic/books/download.aspx to see the code available for this book and all other Wrox books.
Next Page
Errata
We make every effort to ensure that there are no errors in the text or in the code. However, no one is perfect, and mistakes do occur. If you find an error in one of our books, like a spelling mistake or faulty piece of code, we would be very grateful for your feedback. By sending in errata you may save another reader hours of frustration and at the same time you will be helping us provide even higher quality information.
To find the errata page for this book, go to http://www.wrox.com and locate the title using the Search box or one of the title lists. Then, on the book details page, click the Book Errata link. On this page you can view all errata that has been submitted for this book and posted by Wrox editors. A complete book list including links to each's book's errata is also available at
http://www.wrox.com/misc-pages/booklist.shtml.
If you don't spot "your" error on the Book Errata page, go to http://www.wrox.com/contact/techsupport.shtml and complete the form there to send us the error you have found. We'll check the information and, if appropriate, post a message to the book's errata page and fix the problem in subsequent editions of the book.
Next Page
http://p2p.wrox.com
For author and peer discussion, join the P2P forums at http://p2p.wrox.com. The forums are a Web-based system for you to post messages relating to Wrox books and related technologies and interact with other readers and technology users. The forums offer a subscription feature to e-mail you topics of interest of your choosing when new posts are made to the forums. Wrox authors, editors, other industry experts, and your fellow readers are present on these forums.
At http://p2p.wrox.com you will find a number of different forums that will help you not only as you read this book, but also as you develop your own applications. To join the forums, just follow these steps:
1. Go to http://p2p.wrox.com and click the Register link. 2. Read the terms of use and click Agree.
3. Complete the required information to join as well as any optional information you wish to provide and click Submit. 4. You will receive an e-mail with information describing how to verify your account and complete the joining process. NoteYou can read messages in the forums without joining P2P but in order to post your own messages, you must join.
Once you join, you can post new messages and respond to messages other users post. You can read messages at any time on the Web. If you would like to have new messages from a particular forum e-mailed to you, click the Subscribe to this Forum icon by the forum name in the forum listing.
For more information about how to use the Wrox P2P, be sure to read the P2P FAQs for answers to questions about how the forum software works as well as many common questions specific to P2P and Wrox books. To read the FAQs, click the FAQ link on any P2P page.
Next Page
Section I:
Introduction
Chapter List
Chapter 1: Introduction to Data Warehousing and Analysis Services 2005 Chapter 2: First Look at Analysis Services 2005
Chapter 3: Introduction to MDX
Chapter 4: Working with Data Sources and Data Source Views Chapter 5: Dimension Design
Chapter 6: Cube Design
Next Page
Chapter 1: Introduction to Data Warehousing and Analysis Services 2005
A data warehouse is a system that takes data from a company's databases and other data sources and transforms it into a structure conducive to business analysis. Mathematical operations are often performed on the newly structured or organized data to further its usefulness for making business decisions. Finally, the data is made available to the end user for querying and analysis. If the data warehouse is well architected then queries to the data warehouse will return query results quickly (in a matter of seconds). The business decision-maker will have a powerful tool that could never have been effectively used directly from the company's daily operational systems. We consider data analysis to be of two forms. The first requires a person to investigate the data for trends. This method is called On Line Analytical Processing (OLAP). The second form utilizes algorithms to scour the data looking for trends. This method is called Data Mining. Analysis Services 2005 is a business intelligence platform that enables you to use OLAP and Data Mining. Now that you have the big picture of data warehousing, let us look at what you will learn in this chapter.
In this chapter you learn what data warehousing really is and how it relates to business intelligence. This information comes wrapped in a whole load of new concepts, and you get a look at the best known approaches to warehousing with the introduction of those concepts. We explain data warehousing in several different ways and we are sure you will understand it. You will finally see how Analysis Services 2005 puts it all together in terms of architecture — at both client and server levels — based on a new data abstraction layer called Unified Dimensional Model (UDM).
A Closer Look at Data Warehousing
In the book Building the Data Warehouse, Bill Inmon described the data warehouse as "a subject oriented, integrated, non-volatile, and time variant collection of data in support of management's decisions." According to Inmon, the subject orientation of a data warehouse differs from the operational orientation seen in On-Line Transaction Processing (OLTP) systems; so a subject seen in a data warehouse might relate to customers, whereas an operation in an OLTP system might relate to a specific application like sales processing and all that goes with it. The word integrated means that throughout the enterprise, data points should be defined consistently or there should be some integration methodology to force consistency at the data warehouse level. One example would be how to represent the entity Microsoft. If Microsoft were represented in different databases as MSFT, MS, Microsoft, and MSoft, it would be difficult to meaningfully merge these in a data warehouse. The best-case solution is to have all databases in the enterprise refer to Microsoft as, say, MSFT, thereby making the merger of this data seamless. A less desirable, but equally workable, solution is to force all the variants into one during the process of moving data from the operational system to the data warehouse. A data warehouse is referred to as non-volatile since it differs from operational systems, which are often transactional in nature and updated regularly. The data warehouse is generally loaded at some preset interval, which may be measured in weeks or even months. This is not to say it is never measured in days; but even if updates do occur daily, that is still a sparse schedule compared to the constant changes being made to transactional systems.
The final element in this definition regards time variance, which is a sophisticated way of saying how far back the stored data in the system reaches. In the case of operational systems, the time period is quite short, perhaps days, weeks, or months. In the case of the warehouse, it is quite long — typically on the order of years. This last item might strike you as fairly self-evident because you would have a hard time analyzing business trends if your data didn't date back further than two months. So, there you have it, the classic definition that no good book on data warehousing should be without.
Taking the analysis one step closer to the nuts and bolts of working systems, consider that a relational database can be represented graphically as an Entity-Relationship Diagram (ERD) in a case tool or in SQL Server 2005 itself (see Figure 1-1 for an example). Not only will you see the objects in the database shown in the diagram, but you will also see many join connections which represent the relationships between the objects. Data warehouses can be formed from relational databases or multi-dimensional databases. When your data warehouse is modeled after the relational database model then data is stored in two-dimensional tables and analytical or business queries are normally very slow. When one refers to a data warehouse it is typically OLAP that is being referred to. In the case of OLAP you have a multi-dimensional database with data stored in such a way that business users can view it and efficiently answer business questions — all with fast query response times. There is more to come in this chapter on the differences between relational and OLAP databases.
Figure 1-1
Figure 1-2
Next Page
Key Elements of a Data Warehouse
Learning the elements of a data warehouse or data mart is, in part, about building a new vocabulary; the vocabulary associated with data warehousing can be less than intuitive, but once you get it, it all makes sense. The challenge, of course, is understanding it in the first place. Two kinds of tables form a data warehouse: fact tables and dimension tables.
Figure 1-3 shows a fact and a dimension table and the relationship between them. A fact table typically contains the business fact data such as sales amount, sales quantity, the number of customers, and the foreign keys to dimension tables. A foreign key is a field in a relational table that matches the primary key column of another table. Foreign keys provide a level of indirection between tables that enable you to cross-reference them. One important use of foreign keys is to maintain referential integrity (data integrity) within your database. Dimension tables contain detailed information relevant to specific attributes of the fact data, such as details of the product, customer attributes, store information, and so on. In Figure 1-3, the dimension table Product contains the information Product SKU and Product Name. The following sections go into more detail about fact and dimension tables.
Figure 1-3
Fact Tables
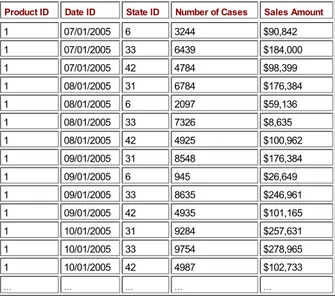
With the end goal of extracting crucial business insights from your data, you will have to structure your data initially in such a way as to facilitate later numeric manipulation. Leaving the data embedded in some normalized database will never do! Your business data, often called detail data or fact data, goes in a de-normalized table called the fact table. Don't let the term "facts" throw you; it literally refers to the facts. In business, the facts are things such as number of products sold and amount received for products sold. Yet another way to describe this type of data is to call them measures. Calling the data measures versus detail data is not an important point. What is important is that this type of data is often numeric (though it could be of type string) and the values are quite often subject to aggregation (pre-calculating roll-ups of data over hierarchies, which subsequently yield improved query results). A fact table often contains columns like the ones shown in the following table:
Product ID Date ID State ID Number of Cases Sales Amount
1 07/01/2005 6 3244 $90,842
This table shows the sales of different varieties of beer between the months of July and October 2005 in four different states. The product id, date id, and state ids together form the primary key of the fact table. The number of cases of beer sold and the sales amount are facts. The product id, date id, and state id are foreign keys that join to the products, date, and state tables. In this table the state ids 6, 31, 33, and 42 refer to the states MA, CA, OR, and WA, respectively, and represent the order in which these states joined the United States. Building the fact table is an important step towards building your data warehouse.
Dimension Tables
The fact table typically holds quantitative data; for example, transaction data that shows number of units sold per sale and amount charged to the customer for the unit sold. To provide reference to higher-level roll-ups based on things like time, a complementary table can be added that provides linkage to those higher levels through the magic of the join (how you link one table to another). In the case of time, the fact table might only show the date on which some number of cases of beer was sold; to do business analysis at the monthly, quarterly, or yearly level, a time dimension is required. The following table shows what a beer products dimension table would minimally contain. The product id is the primary key in this table. The product id of the fact table shown previously is a foreign key that joins to the product id in the following table:
Product ID Product SKU Product Name
For illustrative purposes, assume that you have a dimension table for time that contains monthly, quarterly, and yearly values. There must be a unique key for each value; these unique key values are called primary keys. Meanwhile, back in the fact table you have a column of keys with values mapping to the primary keys in the dimension table. These keys in the fact table are called foreign keys. For now it is enough if you get the idea that dimension tables connect to fact tables and this connectivity provides you with the ability to extend the usefulness of your low-level facts resident in the fact table.
A multi-dimensional database is created from fact and dimension tables to form objects called dimensions and cubes. Dimensions are objects that are created mostly from dimension tables. Some examples of dimensions are time, geography, and employee which would typically contain additional information about those objects by which users can analyze the fact data. The cube is an object that contains fact data as well as dimensions so that data analysis can be performed by slicing or dicing dimensions. For example, you could view the sales information for the year 2005 in the state of Washington. Each of those slices of information is a dimension.
Dimensions
To make sense of a cube, which is at the heart of business analysis and discussed in the next section, you must first understand the nature of dimensions. We say that OLAP is based on multidimensional databases because it quite literally is. You do business analysis by observing the relationships between dimensions like Time, Sales, Products, Customers, Employees, Geography, and Accounts. Dimensions are most often made up of several hierarchies. Hierarchies are logical entities by which a business user might want to analyze fact data. Each hierarchy can have one or more levels. A hierarchy in the geography dimension, for example, might have the following levels: Country, State, County, and City.
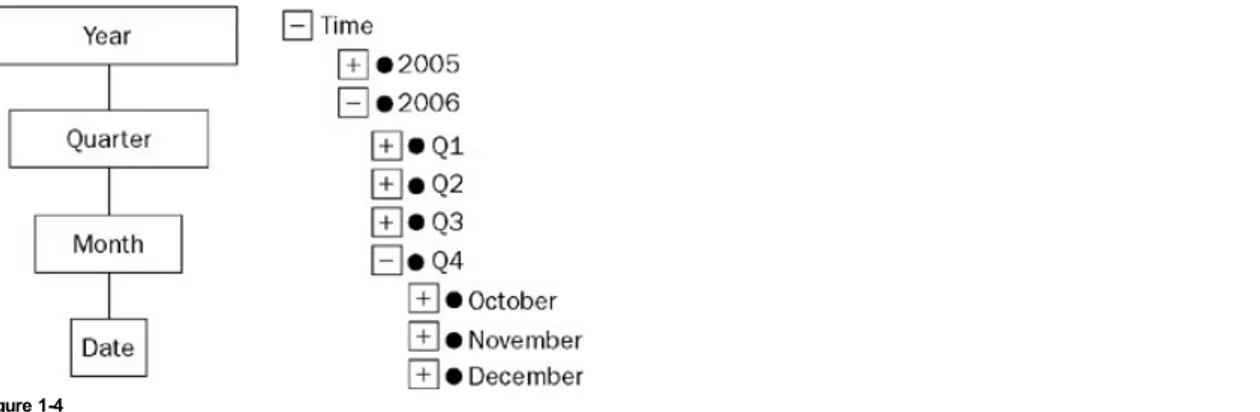
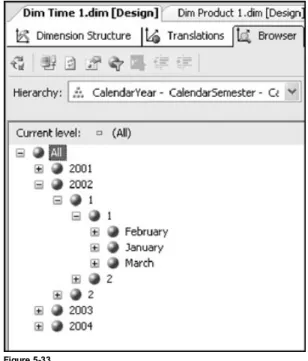
unbalanced hierarchies. An organization chart is an obvious example of an unbalanced hierarchy. There are different depths to the chain of supervisor to employee; that is, the leaf nodes are different distances from the top-level node. For example, a general manager might have unit managers and an administrative assistant. A unit manager might have additional direct reports such as a dev and a test manager, while the administrative assistant would not have any direct reports. Some hierarchies are typically balanced but are missing a unique characteristic of some members in a level. Such hierarchies are called ragged hierarchies. An example of a ragged hierarchy is a geography hierarchy that contains the levels Country, State, and City. Within the Country USA you have State Washington and City Seattle. If you were to add the Country Greece and City Athens to this hierarchy, you would add them to the Country and City levels. However, there are no states in the Country Greece and hence member Athens is directly related to the Country Greece. A hierarchy in which the members descend to members in the lowest level with different paths is referred to as a ragged hierarchy. Figure 1-4 shows an example of a Time dimension with the hierarchy Time. In this example, Year, Quarter, Month, and Date are the levels of the hierarchy. The values 2005 and 2006 are members of the Year level. When a particular level is expanded (indicated by minus sign in the figure) you can see the members of the next level in the hierarchy chain.
Figure 1-4
To sum up, a dimension is a hierarchical structure that has levels that may or may not be balanced. It has a subject matter of interest and is used as the basis for detailed business analysis.
Cubes
The cube is a multidimensional data structure from which you can query for business information. You build cubes out of your fact data and the dimensions. A cube can contain fact data from one or more fact tables and often contains a few dimensions. Any given cube usually has a dominant subject under analysis associated with it. For example, you might build a Sales cube with which you analyze sales by region, or a Call Processing cube with which you analyze length of call by problem category reported. These cubes are what you will be making available to your users for analysis.
Figure 1-5 shows a Beer Sales cube that was created from the fact table data shown previously. Consider the front face of the cube that shows numbers. This cube has three dimensions: Time, Product Line, and State where the product was sold. Each block of the cube is called a cell and is uniquely identified by a member in each dimension. For example, analyze the bottom-left corner cell that has the values 4,784 and $98,399. The values indicate the number of sales and the sales amount. This cell refers to the sales of Beer type Ale in the state of Washington (WA) for July 2005. This is represented as [WA, Ale, Jul '05]. Notice that some cells do not have any value; this is because no facts are available for those cells in the fact table.
Figure 1-5
The whole point of making these cubes involves reducing the query response time for the information worker to extract knowledge from the data. To make that happen, cubes typically contain pre-calculated summary data called aggregations. Querying existing aggregated data is close to instantaneous compared to doing cold (no cache) queries with no pre-calculated summaries in place. This is really at the heart of business intelligence, the ability to query data with possibly gigabytes or terabytes of pre-summarized data behind it and yet get an instant response from the server. It is quite the thrill when you realize you have accomplished this feat!
You learned about how cubes provide the infrastructure for storing multidimensional data. Well, it doesn't just store multidimensional data from fact tables; it also stores something called aggregations of that data. A typical aggregation would be the summing of values up a hierarchy of a dimension. For example, summing of sales figures up from stores level, to district level, to regional level; when querying for those numbers you would get an instant response because the calculations would have already been done when the aggregations were formed. The fact data does not necessarily need to be aggregated as sum of the specific fact data. You can have other ways of aggregating the data such as counting the number of products sold. Again, this count would typically roll up through the hierarchy of a dimension.
The Star Schema
Figure 1-6
The star schema provides you with an illustration of the relationships between business entities in a clear and easy-to-understand fashion. Further, it enables number crunching of the measures in the fact table to progress at amazing speeds.
The Snowflake Schema
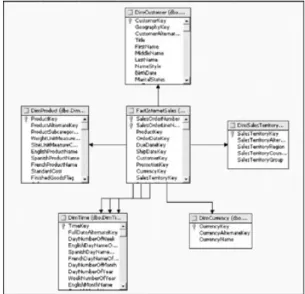
If you think the star schema is nifty, and it is, there is an extension of the concept called the snowflake schema. The snowflake schema is useful when one of your dimension tables starts looking as detailed as the fact table it is connected to. With the snowflake, a level is forked off from one of the dimension tables, so it is separated by one or more tables from the fact table. In Figure 1-7 the Product dimension has yielded a Product Category level. The Product Sub Category level is hence one table removed from the sales fact table. In turn, the Product Sub Category level yields a final level called the Product Category — which has two tables of separation between it and the sales fact table. These levels, which can be used to form a hierarchy in the dimension, do not make for faster processing or query response times, but they can keep a schema sensible.
Figure 1-7
You have so far learned the fundamental elements of a data warehouse. The biggest challenge is to understand these well and design and implement your data warehouse to cater to your end-users. There are two main design techniques for implementing data warehouses. These are the Inmon approach and the Kimball approach.
Next Page
Inmon Versus Kimball Different Approaches
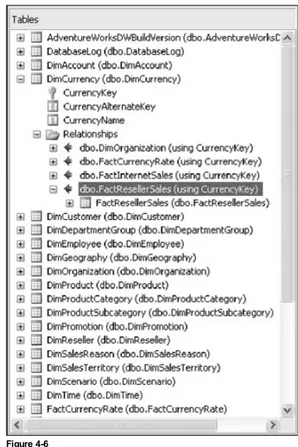
In data warehousing there are two commonly acknowledged approaches to building a decision support infrastructure, and both can be implemented using the tools available in SQL Server 2005 with Analysis Services 2005. It is worth understanding these two approaches and the often-cited difference of views that result. These views are expressed most overtly in two seminal works: The Data Warehouse Lifecycle Toolkit by Ralph Kimball, Laura Reeves, Margy Ross, and Warren Thornthwaite, and Corporate Information Factory by Bill Inmon, Claudia Imhoff, and Ryan Sousa.
Kimball identified early on the problem of the stovepipe. A stovepipe is what you get when several independent systems in the enterprise go about identifying and storing data in different ways. Trying to connect these systems or use their data in a warehouse results in something resembling a Rube-Goldberg device. To address this problem, Kimball advocates the use of conformed dimensions. Conformed refers to the idea that dimensions of interest — sales, for example — should have the same attributes and rollups (covered in the "Aggregations" section earlier in this chapter) in one data mart as another. Or at least one should be a subset of the other. In this way, a warehouse can be formed from data marts. The real gist of Kimball's approach is that the data warehouse contains dimensional databases for ease of analysis and that the user queries the warehouse directly.
The Inmon approach has the warehouse laid out in third normal form (not dimensional) and the users query data marts, not the warehouse. In this approach the data marts are dimensional in nature. However, they may or may not have conformed dimensions in the sense Kimball talks about.
Happily it is not necessary to become a card-carrying member of either school of thought in order to do work in this field. In fact, this book is not strictly aligned to either approach. What you will find as you work through this book is that by using the product in the ways in which it was meant to be used and are shown here, certain best practices and effective methodologies will naturally emerge.
Next Page
Business Intelligence Is Data Analysis
Having designed a data warehouse the next step is to understand and make business decisions from your data warehouse. Business intelligence is nothing but analyzing your data. An example of business analytics is shown through the analysis of results from a product placed on sale at a discounted price, as commonly seen in any retail store. If a product is put on sale for a special discounted price, there is an expected outcome: increased sales volume. This is often the case, but whether or not it worked in the company's favor isn't obvious. That is where business analytics come into play. We can use Analysis Services 2005 to find out if the net effect of the special sale was to sell more product units. Suppose you are selling organic honey from genetically unaltered bees; you put the 8-ounce jars on special — two for one — and leave the 10- and 12-ounce jars at regular price. At the end of the special you can calculate the lift provided by the special sale — the difference in total sales between a week of sales with no special versus a week of sales with the special. How is it you could sell more 8-ounce jars on special that week, yet realize no lift? It's simple — the customers stopped buying your 10- and 12-ounce jars in favor of the two-for-one deal; and you didn't attract enough new business to cover the difference for a net increase in sales.
You can surface that information using Analysis Services 2005 by creating a Sales cube that has three dimensions: Product, Promotion, and Time. For the sake of simplicity, assume you have only three product sizes for the organic honey (8-ounce, 10-ounce, and 12-ounce) and two promotion states ("no promotion" and a "two-for-one promotion for the 8-ounce jars"). Further, assume the Time dimension contains different levels for Year, Month, Week, and Day. The cube itself contains two measures, "count of products sold" and the "sales amount." By analyzing the sales results each week across the three product sizes you could easily find out that there was an increase in the count of 8-ounce jars of honey sold, but perhaps the total sales across all sizes did not increase due to the promotion. By slicing on the Promotion dimension you would be able to confirm that there was a promotion during the week that caused an increase in number of 8-ounce jars sold. When looking at the comparison of total sales for that week (promotion week) to the earlier (non-promotion) weeks, lift or lack of lift is seen quite clearly. Business analytics are often easier described than implemented, however.
Next Page
Analysis Services 2005
Analysis Services 2005 is part of Microsoft's product SQL Server 2005. SQL Server 2005 is the latest SQL Server release from Microsoft in November of 2005. In addition to Analysis Services 2005, SQL Server 2005 contains other services such as Integrations Services, Reporting Services, and Notification Services among other things. Integration Services, Analysis Services, and Reporting Services together form the core of business intelligence platform with SQL Server as the backend. Analysis Services 2005 not only provides you the ability to build dimensions and cubes for data analysis but also supports several data mining algorithms which can provide business insight into your data that are not intuitive. Analysis Services is part of a greater Business Intelligence platform, which leverages not only the rest of SQL Server 2005, but the .NET Framework (Common Language Runtime) and Visual Studio development environment as well. Next you will learn about the overall architecture of Analysis Services 2005 followed by the concept of Unified Dimensional Model (UDM) which helps you to have a unified view of your entire data warehouse.
SQL Server Analysis Services 2005 has been re-architected as both scalable and reliable enterprise class software that provides fine-grain security. So, not only is it quite manageable; but also protects your data from malicious attacks. The architecture of Analysis Services 2005 provides efficient scalability in terms of scale-out and scale-up features. Several instances of Analysis Services 2005 can be integrated together to provide an efficient scale-out solution. On the other hand, the service has been architected with efficient algorithms to handle large dimensions and cubes on a single instance. Analysis Services 2005 provides a rich set of tools for creating OLAP databases; efficient and easy manageability, as well as profiling capabilities.
The Business Intelligence Development Studio (BIDS) integrated within Visual Studio is the development tool shipped with Analysis Services 2005 used for creating and updating cubes, dimensions, and Data Mining models. The SQL Server Management Studio (SSMS) provides an integrated environment for managing SQL Server, Analysis Services, Integration Services, and Reporting Services. SQL Profiler in the SQL Server 2005 releases supports profiling Analysis Services 2005, which helps in analyzing the types of commands and queries sent from different users or clients to Analysis Services 2005. You learn more about BIDS and SSMS in Chapter 2 with the help of a tutorial. You learn about profiling an instance of Analysis Services using SQL Profiler in Chapter 12. In addition to the above-mentioned tools, Analysis Services 2005 provides two more tools: the Migration Wizard and the Deployment Wizard. The Migration Wizard helps in migrating Analysis Services 2000 databases to Analysis Services 2005. The Deployment Wizard helps in deploying the database files created using BIDS to Analysis Services 2005.
The SSMS provides efficient, enterprise-class manageability features for Analysis Services. Key aspects of an enterprise class service are availability and reliability. Analysis Services 2005 supports fail-over clustering on Windows clusters through an easy setup scheme and fail-over clustering certainly helps provide high availability. In addition, Analysis Services 2005 has the capability of efficiently recovering from failures. You can set up fine-grain security so that you can provide administrative access to an entire service or administrative access to specific databases, process permissions to specific databases, and read-only access to metadata and data. In addition to this, certain features are turned off by default so that the Service is protected from hacker attacks.
Analysis Services 2005 natively supports XML for Analysis specification defined by the XML/A Advisory Council. What this means is that the communication interface to Analysis Services from a client is XML. This facilitates ease of interoperability between different clients and Analysis Services 2005. The architecture of SQL Server Analysis Services 2005 includes various modes of communication to the service as shown in Figure 1-8. Analysis Server 2005 provides three main client connectivity components to communicate to the server. The Analysis Management Objects (AMO) is a new object model that helps you manage Analysis Server 2005 and the databases resident on it. The OLE DB 9.0 is the client connectivity component used to interact with analysis services 2005 instances s for queries that conforms to the OLE DB standard. The ADOMD.Net is dot Net object model support for querying data from Analysis Services 2005. In addition to the three main client connectivity components, two other components are provided by Analysis Services 2005. They are DSO 9.0 (Decision Support Object) and HTTP connectivity through a data pump. DSO 8.0 is the extension of the management object of Analysis Server 2000 so that legacy applications can interact with migrated Analysis Server 2000 databases on Analysis Server 2005. The data pump is a component that is set up with IIS (Internet Information System) to provide connection to Analysis Services 2005 over HTTP (Hypertext Transfer Protocol).
Figure 1-8
Even though XML/A helps in interoperability between different clients to Analysis Server, it comes with a cost on performance. If the responses from the server are large, transmission of XML data across the wire may take a long time depending on the type of network connection. Typically slow wide area networks might suffer from performance due to large XML responses. In order to combat this, Analysis Services 2005 supports the options for compression and binary XML so that the XML responses from the server could be reduced. These are optional features supported by Analysis Services 2005 that can be enabled or disabled on the Server.
Analysis Services 2005 stores metadata information of databases in the form of XML. Analysis Services 2005 provides you with the option of storing the data or aggregated data efficiently in a proprietary format on Analysis Services instance or storing them in the relational database. If you choose the data and/ or aggregated data to be stored in the proprietary format you can expect better query performance than the case where the data is being retrieved from the relational database. This proprietary format helps Analysis Services 2005 to retrieve the data efficiently and thereby improves the query performance. Based on where the data and/or aggregated fact data is stored you can classify the storage types as MOLAP (Multi-dimensional OLAP), ROLAP (Relational OLAP), or HOLAP (Hybrid OLAP).
MOLAP is the storage mode in which the data and aggregated data are both stored in proprietary format on the Analysis Services instance. This is the default and recommended storage mode for Analysis Services databases since you get better query performance as compared to the other storage types. The key advantages of this storage mode is fast data retrieval while analyzing sections of data and therefore provides good query performance and the ability to handle complex calculations. Two potential disadvantages of MOLAP mode are storage needed for large databases and the inability to see new data entering your data warehouse.
ROLAP is the storage mode in which the data is left in the relational database. Aggregated or summary data is also stored in the relational database. Queries against the Analysis Services are appropriately changed to queries to the relational database to retrieve the right section of data requested. The key advantage of this mode is that the ability to handle large cubes is limited by the relational backend only. The most important disadvantage of the ROLAP storage mode are slow query performance. You will encounter slower query performance in ROLAP mode due to the fact that each query to the Analysis Services is translated into one or more queries to the relational backend.
The HOLAP storage mode combines the best of MOLAP and ROLAP modes. The data in the relational database is not touched while the aggregated or summary data is stored on the Analysis Services instance in a proprietary format. If the queries to Analysis Services request aggregated data, they are retrieved from the summary data stored on the Analysis Services instance and they would be faster than data being retrieved from the relational backend. If the queries request detailed data, appropriate queries are sent to the relational backend and these queries can take a long time based on the relational backend.
Based on your requirements and maintainability costs you need to choose the storage mode that is appropriate for your business. Analysis Services 2005 supports all three storage modes.
Next Page
The Unified Dimensional Model
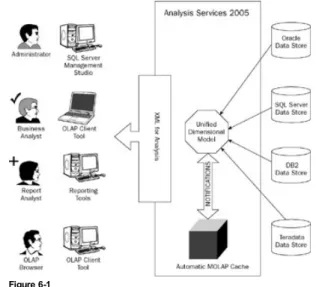
Central to the architecture is the concept of the Unified Dimensional Model (UDM) which, by the way, is unique to this release of the product. UDM, as the name suggests, provides you with a way to encapsulate access to multiple heterogeneous data sources into a single model. In fact, with the UDM, you will be buffered from the difficulties previously presented by multiple data sources. Those difficulties were often associated with cross-data-source calculations and queries — so, do not be daunted by projects with lots of disparate data sources. The UDM can handle it! The UDM itself is more than a multiple data-source cube on steroids; it actually defines the relational schema upon which your cubes and dimensions are built. Think of the UDM as providing you with the best of the OLAP and relational worlds. UDM provides you with the rich metadata needed for analyzing and exploring data along with the functionality like the complex calculations and aggregations of the OLAP world. It supports complex schemas, and is capable of supporting ad-hoc queries that are needed for reporting in the relational world. Unlike the traditional OLAP world that allows you to define a single fact table within a cube, the UDM allows you to have multiple fact tables. The UDM is your friend and helps you have a single model that will support all your business needs. Figure 1-9 shows a UDM within Analysis Services 2005 that retrieves data from heterogeneous data sources and serves various types of clients.
Figure 1-9
Key elements of the UDM are as follows:
Heterogeneous data access support: UDM helps you to integrate and encapsulate data from heterogeneous data sources. It helps you combine various schemas into a single unified model that gives end users the capability of sending queries to a single model.
Real-time data access with high performance: The UDM provides end users with real-time data access. The UDM creates a MOLAP cache of the underlying data. Whenever there are changes in the underlying relational database, a new MOLAP cache is built. When users query the model, it provides the results from the MOLAP cache. During the time the cache is being built, results are retrieved from the relational database. UDM helps in providing real-time data access with the speed of an OLAP database due to the MOLAP cache. This feature is called proactive caching. You learn more about proactive caching in Chapter 17.
Rich metadata, ease of use for exploration, and nav igation of data: UDM provides a consolidated view of the underlying data sources with the richness of metadata provided by the OLAP world. Due to rich metadata supported by OLAP, end users are able to exploit this metadata to navigate and explore data in support of making business decisions. UDM also provides you with the ability to view specific sections of the unified model based on your business analysis needs.
Rich analytics support: In addition to the rich metadata support, the UDM provides you with the ability to specify complex calculations to be applied to the underlying data; in this way you can embed business logic. You can specify the complex calculations by a script-based calculation model using the language called MDX (Multi-Dimensional eXpressions). UDM provides rich analytics such as Key Performance Indicators and Actions that help in understanding your business with ease and automatically take appropriate actions based on changes in data.
Model for Reporting and Analysis: The UDM provides the best functionality for relating to both relational and OLAP worlds. UDM provides you with the capability of not only querying the aggregated data that are typically used for analysis, but also has the ability to provide for detailed reporting up to the transaction level across multiple heterogeneous data sources.
Another handy aspect of using the UDM is the storage of foreign language translations for both data and metadata. This is handled seamlessly by the UDM such that a connecting user gets the metadata and data of interest customized to his or her locale. Of course, somebody has to enter those translations into the UDM in the first place; it is not actually a foreign language translation system.
Next Page
Summary
Reading this chapter may have felt like the linguistic equivalent of drinking from a fire hose; it is good you hung in there because now you have a foundation from which to build as you work through the rest of the book. Now you know data warehousing is all about structuring data for decision support. The data is consumed by the business analyst and business decision-maker and can be analyzed through OLAP and Data Mining techniques.
OLAP is a multidimensional database format that is a world apart in form and function when compared to an OLTP relational database system. You saw how OLAP uses a structure called a cube, which in turn relies on fact tables (which are populated with data called facts) and dimension tables. These dimension tables can be configured around one or more fact tables to create a star schema. If a dimension table is deconstructed to point to a chain of sub-dimension tables, the schema is called a snowflake schema.
By choosing Analysis Services 2005 you have chosen a business intelligence platform with awesome innovations built right in; like the UDM. Also, there is an advantage that Analysis Services 2005 offers — it comes from a particularly strong and reliable company that had the highest market share with its earlier product, Analysis Services 2000. The rest of this book illustrates the power of the platform quite clearly.
In the unlikely event that you didn't read the introduction, mention was made that you should read at least the first three chapters serially before attempting to tackle the rest of the book. So, please do not skip Chapter 2, an introduction to Analysis Services and Chapter 3, an introduction to the technology behind the most famous acronym in business analytics, MDX.
Next Page
Chapter 2: First Look at Analysis Services 2005
Overview
In Chapter 1 you learned general data warehousing concepts, including some key elements that go into successful warehouse projects, the different approaches taken to build warehouses, and how the warehouses are subsequently mined for information. This chapter introduces you to Analysis Services 2005 and includes an introduction to SQL Server Analysis Services 2005 Tools. These are the very tools, resident in two different environments, which you'll need to develop and manage Analysis Services databases. This chapter also covers some of the differences between Analysis Services 2000 and Analysis Services 2005.
You familiarize yourself with the development environment and interface by working through a tutorial based on a sample database that ships with SQL Server Analysis Services 2005, called Adventure Works DW. This tutorial covers many basic concepts and takes you through the Cube Wizard to build and then browse a cube. The tutorial will guide you through using the tools and provide you insights into what the product is doing behind the scenes.
In the management environment you learn the basic operations associated with manageability of Analysis Services 2005. Further, you learn about the constituent objects that make up an Analysis Services 2005 database and what management actions can be taken against them in the management environment. Finally, you are introduced to the MDX Query Editor for querying data from the cubes.
NoteMDX, which stands for Multi-Dimensional eXpressions, is the language through which you retrieve data from multi-dimensional databases.
By the end of this chapter you will be familiar with key components that constitute the Analysis Services Tools, the process of building Analysis Services databases, and how to use MDX to retrieve data from Analysis Services databases. So, snap on your seatbelt and get started!