DOI: 10.4018/IJWP.2018070102
Copyright © 2018, IGI Global. Copying or distributing in print or electronic forms without written permission of IGI Global is prohibited.
A Web Portal for Rice Crop Improvements
James W. Baurley, Bioinformatics and Data Science Research Center, Bina Nusantara University, Jakarta, Indonesia Arif Budiarto, Computer Science Department, School of Computer Science, Bina Nusantara University, Jakarta, Indonesia & Bioinformatics and Data Science Research Center, Bina Nusantara University, Jakarta, Indonesia
Muhamad Fitra Kacamarga, Computer Science Department, School of Computer Science, Bina Nusantara University, Jakarta, Indonesia & Bioinformatics and Data Science Research Center, Bina Nusantara University, Jakarta, Indonesia Bens Pardamean, Computer Science Department, BINUS Graduate Program – Master of Computer Science, Bina Nusantara University, Jakarta, Indonesia & Bioinformatics and Data Science Research Center, Bina Nusantara University, Jakarta, Indonesia
ABSTRACT
High quality models of factors influencing rice crop yield are needed in countries where rice is a staple food. These models can help select optimal rice varieties for expected field conditions. Development of a system to help scientist track and make decisions using this data is challenging. It involves incorporation of complex data structures - genomic, phenotypic, and remote sensing - with computationally intensive statistical modeling. In this article, the authors present a web portal designed to help researchers to manage and analyze their datasets, apply machine learning to detect how factors taken together influence crop production, and summarize the results to help scientists make decisions based on the learned models. The authors developed the system to be easily accessed by the entire team including rice scientist, genetics, and farmers. As such, they developed a system on a server architecture comprised of a SQLite database, a web interface developed in Python, the Celery job scheduler, and statistical computing in R.
KeyWoRdS
Crop Improvements, Data Science, Databases, High Performance Computing, Machine Learning, Web Portals
1. INTRodUCTIoN
Potential land for agriculture in Indonesia is approximately 96 million hectares, comprising 71 million hectares of dry land, 5 million hectares of wet land, and 20 million hectares of marsh land (Kementan, 2015). From the total area, only about 1.2 million hectares of dry land is being used for the production of rice and low productivity is a problem. The average yield is about 3.3 tons/ ha, contributing to about 5% of national rice production (Kementan, 2014). In an effort to improve production, rice scientists in Indonesia are keeping track of genomic and field factors and production outcomes. The objective is to use these data to help improve crops through selection of optimal seeds for expected field conditions and using genetic markers to inform plant breeding. The goal of the latter is to produce rice varieties with good production qualities, such as resistance to disease.
Increasing production is a challenging task. Rice farmers can provide agricultural researchers with valuable information on the current conditions of rice farming. Conversely, researchers are the main providers of information to farmers on new or improved rice varieties. Information must be passed in both directions to make informed decisions on how to improve rice production. Additionally, plant characteristics as well as environmental factors influence production traits. A deep understanding of these factors are needed to optimize production. A genomic approach can be useful in identifying the molecular features that predicts resistant to environmental conditions such as drought and salt tolerance (Papageorgiou, 2017).
1.1. Rice Genetics
The rice genome is relatively small (430 megabase-pairs) and well mapped (Sasaki et al., 2002). The rice genome was one of the first genome sequencing projects. It is the smallest genome among cereals (Eckardt, 2000). Because of these characteristics, rice is considered to be a model plant and research into the rice genome has been ongoing over the last decades. The rice genome consists of 12 chromosome pairs. Along these chromosomes, there are points where the nucleotides vary from plant to plant. The most common type of genetic variation found at these sites are single-nucleotide polymorphisms (SNPs). The nucleotides at these points of variation are called alleles, and since the chromosomes are paired, two alleles make up a genotype. Genotypes for variants in nearby proximity are often correlated because they are more likely to be copied together. Genotypes are captured with DNA genotyping or sequencing technologies.
Research programs analyze the rice genome in order to understand genomic diversity and support development of new varieties. These programs began in the 1990s in Japan (Sasaki, 2003) focusing on two rice subspecies: Indica and Japonica. This provided the groundwork for scientist to improve the quality of rice, and also the quality of cereals in general. Today, given its importance for food security, rice genomics is one of the top research areas in life sciences, after human and mouse (Wang, Xia, Li, Hou, & Yu, 2013). Much work is focused on marker-assisted selection (MAS). This approach uses genetic markers to screen plants for breeding. This process is used to create new varieties of plants with desirable traits, such as yield improvement, drought and disease resistance (He et al., 2014). These technologies allows scientists to create new plant varieties more efficiently by genetically predicting the phenotype rather than observing it after the plant has grown.
1.2. data-driven Crop Improvements
can be applied to predict traits under new sets of observed or expected scenerios. This helps rice scientists make decisions based on the existing data. For example, predicting yield based on the genomic profile of a new rice variety.
Organizing the data, implementing machine learning algorithms, and validating and applying these models for prediction represent barriers to use in practice. Motivated by rice crop improvement research in Indonesia, we have developed a web portal to help scientist use data and machine learning in their agriculture research. Here we present the design and implementation of a portal that implements a workflow for storage, processing, analysis, and reporting of rice data. Additionally, we comment on design decisions related to cloud computing, user interfaces, security, and technology selection. The resulting portal is expandable to additional data and machine learning techniques and applicable to other agriculture studies aimed at data-driven crop improvements.
2. ReLATed WoRK
Information technology (IT) tools for life sciences are needed to facilitate data management and analysis as well as reproducible research. Increasing size and scale of data and the difficulties in applying a complicated technology stack to the data has slowed progress in agriculture genomics (P´erez-Enciso & Ferretti, 2010). The increased amount of genomic data is an result of low cost but high throughput DNA processing (Canturk et al., 2014). Whole-genome DNA sequencing and genotyping technologies are a driving factor for new computational and analytic tools development (Weber & Kim, 2016). However, these tools require powerful and reliable computing systems, mostly available at large commercial and academic institutions. Thus, agriculture genomic research is often limited by restricted IT resources (J M Reecy et al., 2014). There is an urgency to increase the speed of genomic analyses in agriculture, especially with crop improvements becoming national priorities (Arnold, Goldenberg, Mewes, & Rattei, 2014).
In general, there are two different approaches of implementing IT tools in genomics. The first focuses on high performance computing (HPC) hardware. HPC has been commonly used in bioinformatics because genomic data is large (e.g., raw data for one human genome is about 200 gigabytes). The use of HPC has certainly become a vital factor in dealing with massive and complex genomic data. Several works have demonstrated the advantages of HPC in bioinformatics. For instance, Reecy et al. developed an application programming interface (API) and integrated HPC to process and analyze complex and high dimensional data (Reecy et al., 2014). They focused on improving analysis performance with specialized hardware, such as Stampede and Lonestar at the Texas Advanced Computing Center, Blacklight at the Pittsburgh Supercomputing Center, and Trestles at San Diego Supercomputing Center. By developing this infrastructure, they were able to provide an affordable yet powerful platform for plant and animal researchers to store, share, and analyze large datasets.
Davis, Pandey, and McKinney tried to identify the best computer architecture and specifications for an algorithm designed to prioritize genetic variants for further research. They compared the performance of Central Processing Unit (CPU) and Graphical Processing Unit (GPU) in the application of the SNPrank algorithm (Davis, Pandey, & McKinney, 2011). They compared different programming languages such as Python, Matlab, and Java on analysis performance. They concluded that GPU implementations of the SNPrank algorithm yielded a significant improvement in execution times.
The second approach is using cloud or web portal technologies to make the solution widely available for users. Fang et al. developed a web portal for a project focused on the emergence and spread of foodborne pathogens in outbreak scenarios (Fang et al., 2010). They developed software called ArrayTrack for enabling detection and characterization of bacterial foodborne pathogens. In another example, Arnold et al. created a solution called The Similarity Matrix of Proteins (SIMAP) to speed up computationally expensive protein sequence analysis (Arnold et al., 2014). They designed a web service that connected SIMAP with other common bioinformatics tools. They found that using cloud technologies to share computational resources is quite useful in accelerating research. Recently, Feng et al., in a study related to pathogens in rice, developed a database and web portal to be accessed by the researcher community so they can collaborate efficiently (Feng et al., 2015). They developed a cloud-based system to allows researchers to store data related to rice pathogens. perform genome analysis, and visualize the results.
It is clear that each approach has its own advantages. HPC technology is the best solution to increase the speed of data analysis. Cloud or web portal technology enables the research community to collaborate and share their resources efficiently, thus accelerating scientific advancements. By combining these two approaches, a high impact solution can be developed to help scientists. This was highlighted in a recent research project by Alonso et al. (2016) that focused on using HPC to accelerate the computationally intensive analysis of RNA sequencing results. They developed a web-based reporting application to track and manage the results. The most notable distinction of this pipeline was the design of computational resources for each stage of analysis. This allowed granular optimization of HPC resources. The flexibility of this platform was another strong point. The pipeline enabled the users to set analysis parameters and configurations as needed. The web reporting system also allowed the user to track and monitor every stage of the analysis process. Velosso et al. encapsulated bioinformatics tools into a package called Bioinformatics Open Web Services (BOWS). The purpose of this package was for bioinformaticians to do genomic data analysis without having to setup and configure hardware and software (Velloso, Vialle, & Ortega, 2015). BOWS provides programmatic access using web services. It allows the users to run analysis on HPC clusters. The design of BOWS was compartmentalized into a front-end and back-end. The front-end provides the user with a gateway for submitting jobs to the system and reading the results. The back-end configures the hardware and runs the data management and analysis jobs on the data.
3. WeB PoRTAL deSIGN
Crop improvement programs involve many facilities that must share resources and data. For example, there are 12 locations for the rice sciences program in Indonesia. Thus a key requirement for development of a web portal is to allow access and sharing of data in a unified and secure platform.
The network architecture of the web portal is composed of many clients accessing resources through a single portal. Clients could be a single computer or various mobile devices. Examples of clients could be rice breeding facilities, agriculture genomics labs, and institute scientists.
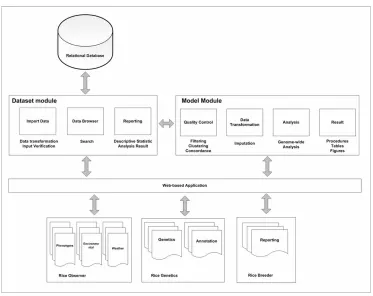
We designed the portal with two modules: datasets and models as can be seen in Figure 1. This layout was inspired by current machine learning interfaces. The datasets module manages a variety of data inputs that are important to rice production including DNA genotypes, phenotype and trait data gathered in the field, and field environmental data and weather information. The portal allows the user to manage multiple datasets. The portal also allows for multiple data processing and analytical models to be applied efficiently to the datasets.
delimited text formats as data inputs. Input data is verified for completeness and manually verified by staff before being inserted into the database.
The model module offers a variety of analysis options for crop improvement programs (e.g., identifying markers related to improved crop yield). This module is designed to extract relevant data, apply machine learning algorithms, and summarize the learned model in useful outputs. The data extraction process includes filtering, quality control and imputation of missing values using database queries and a variety of custom and open source scripts. The user can use defaults or customize the parameters for this workflow as it is applied to the data. The learned models and weights are stored in the database and can be applied by the user to new observations to predict traits of interest.
3.1. database
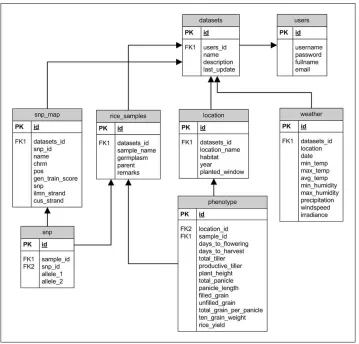
The system incorporates a relational database for data storage and retrieval. Requirements of the database management system (DBMS) were ease of deployment, user authentication and authorization, and support for large structured datasets. The entity relationship diagram for the database is presented in Figure 2.
The application was designed to interact with the database so that security permissions can be specific to the users and data tables. The tables consist of rice variety information, observed crop characteristics, the plant genotypes, planting location and field weather conditions. The phenotype table contains the rice production traits (e.g, yield, days to flowering). This table is linked to the planting location, which makes it possible to have multiple phenotype measurement over time and location. To capture the genotypes for the rice varieties, three tables were used: rice samples, snp map, and snp. The rice samples table contains information on the rice varieties and the DNA sample. The
snp map table stored information on the genetic markers (SNPs) captured with the DNA genotyping technology, includes the chromosomes and position on the chromosome of the DNA variant. The genotypes for each rice sample were contained in a long table snp containing the many genotypes for each rice sample. The rice genotypes, phenotype, and growing conditions were linked to the datasets table, that describes the current version available for statistical modeling.
3.2. Workflow
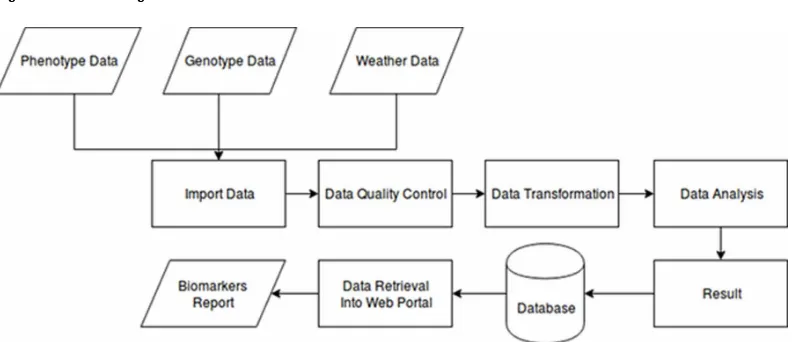
The system captures a data management and analysis workflow for crop improvements. Prior to performing an analysis task, the user needs to prepare their own data in comma delimited formats (CSV). These files can then be imported into the database. Required elements include data on the rice samples (columns: Name, Germplasm, parent), the phenotypes (i.e., maturity and yield components), SNP map (Columns: SNP Id, name, chromosome, pos, gen train score, snp), and the SNP (SNP id, allele 1, allele 2). Weather data columns include minimum, maximum, average temperature and humidity, and daily precipitation. Once the data is imported, the system generates descriptive statistics for the phenotype and weather data; and runs a basic regression analysis using the phenotype variable “Yield” as the dependent variable.
After data importation and basic analysis, users can apply machine learning algorithms to evaluate the effects of multiple variables on rice yield. Here, we implemented a recently developed machine
learning approach to perform variable selection and effect estimation on rice data (Armagan, Dunson, & Lee, 2013, 2010). User have control of several parameters related to the model learning algorithm and the data preparation steps (e.g., imputation methods for missing data). After all parameters are set, the user submits the analysis job to the job scheduler where it will be run in the background. All analysis jobs created by users are managed in a queue by the job scheduler. Once finished, the results are stored in the database with information on the submitter, run time, and parameters for the run. Then web portal retrieves the results from the database and display the variables selected and the model weights for the phenotypes or traits of interest in a biomarker report. This workflow is shown in Figures 3. Users can input new values and predict yield from the model. This computation is achieved by applying the model weights to the newly inputted values.
3.3. Machine Learning
The system currently uses a machine learning algorithm developed specifically to learn the important predictors in complex data inherent to crop studies. Other machine learning algorithms could readily be added to the system in the future. A Bayesian hierarchical model was developed in the R language that identifies the genetic and field factors associated with rice yield. The algorithm, unlike previous approaches, accounts for various correlations existing in the data: the genetic similarities between plants, the genetic correlations between SNPs, and the repeated measurements of traits over seasons. This methodology, makes use of a double Pareto Bayesian shrinkage prior (Armagan et al., 2013), and is called the Genetic Generalized Double Pareto (GGDP). This prior allows the algorithm to select important predictors in the model while also estimating their effects. The method of computing the genetic similarity among plants may be specify by the analyst. The expectation-maximization algorithm is used to fit the model. The results of the model are imported into the database to be summarized and presented to the user. These models can be applied to new data, first to validate the model and then to predict traits of interests.
4. IMPLeMeNTATIoN
The web portal introduced here is developed using Flask, a Python web framework (Clemencic, Couturier, & Kyriazi, 2015; Gundersen et al., 2015). The application is deployed on Apache HTTP server (Fielding & Kaiser, 1997; Goel, Bansal, & Gupta, 2016). For the relational database SQLite (Maragkakis, Alexiou, Nakaya, & Mourelatos, 2016; Pruim et al., 2010) is used for retrieval and data storage. In this application, the analysis could be developed in a variety of programming languages.
Currently, the machine learning algorithm is implemented using the R programming language (Ho¨hna et al., 2016; Gu¨ell, Yang, & Church, 2014). The rpy2 library is used to access the analysis functions from Python.
The job queue was implemented using Celery, a distributed job scheduler written in the Python language (Lunacek, Braden, & Hauser, 2013). Redis was used as a message broker, which acts as an intermediate between the web portal and the task queue. In this application for convenience the worker and master operate on the same computing node. When the user submits an analysis tasks, the webserver (master) submits the job to the message broker, and Celery assign the job to the worker. The worker runs the machine learning code and once finished, the results are inserted into the SQLite database. The webserver gets the results from the database and the formats and displays them in the web portal.
5. APPLICATIoN To INdoNeSIAN RICe ReSeARCH
The system was used to store datasets related to genotypes, phenotypes, and field data related to rice production in Indonesia. The objective of this application was to help rice scientists investigate genetic diversity and identify factors linked to crop production properties in the rice varieties found in Indonesia. The ultimate goal of this research program is to improve rice varieties and ensure food security.
Data was captured on a panel of 467 rice varieties planted in four different locations, each with unique climate characteristics. The first location was a greenhouse in Bogor with a controlled environment. The three other locations were fields located in the cities of Subang, Citayam, and Kuningan, representing low, medium, and high elevations respectively. Data collection was conducted during two planting seasons, in Kuningan during rainy season 20102011, in Subang during rainy season 2011-2012 and in Citayam during rainy season 2012-2013.
The rice varieties were genotyped on a panel of 1,538 single nucleotide polymorphisms (SNPs) using the GoldenGate genotyping platform (Chen et al., 2014). This panel was used to assess genetic diversity and the relation of genetics to important production outcomes. These production traits include times to flowering and harvest, panicle number and length, total and productive tiller, plant height, grain numbers and weight, and crop yield.
With the genomic and production data, weather data was collected at the rice fields. There were two weather data sources. The first one was from the Bureau of Meteorology. Data from this source includes temperature, humidity, rainfall, and solar exposure. Weather data from all field locations, from 2010 to 2015, were compiled and incorporated into the project database. The second weather data source was the Automatic Weather Stations (AWS) in Subang and Kuningan. Data included temperature and humidity, similar to the previous data source. In addition, there were also precipitation (mm) and irradiance (MJ/mm2) data. Weather data from the second source was preferred since the data were collected from the field locations of the crops, rather than regionally. There were issues related to data missingness at these local weather stations as they were offline at times during the growing season.
5.1. Web Portal
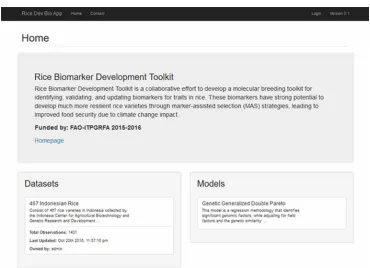
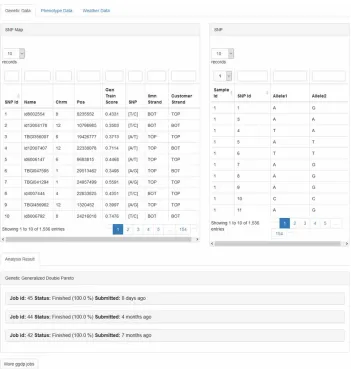
Overall, this system provides two main features. These features are data management and data analysis. The web portal homepage consists of a description of the project and the two main components: Datasets and Models, as shown in Figure 4.
On the Datasets tab, there are descriptions about the data as well as other attributes such as dataset size and last updated time. Only administrators can add a new dataset into the system using the “+ New Dataset” button. To view the data users may click the “View Data” button. The view data page can be seen in Figure 5 and Figure 6. Users may view the data in the following six tabs:
1. Description Tab: On this tab, users get a description of the dataset. It includes a briefdescription of the data, size, and source of the data.
2. Rice Samples Tab: Here users can see attributes of the 467 rice varieties used in theresearch study. For example, the variety name and germplasm for each sample are displayed.
3. Genetic Data Tab: User can view all attributes of the genomic data such as the geneticvariant name and chromosome position. These data can also be sorted by sample id.
4. Phenotype Data Tab: On this tab, users can view all phenotype attributes such as daysto flowering and yield.
5. Weather Data Tab: All attributes related to weather data in each location can be shownin this tab. 6. Analysis Result Tab: On this tab the user can view analysis results that has been run, included
the learned model and weights.
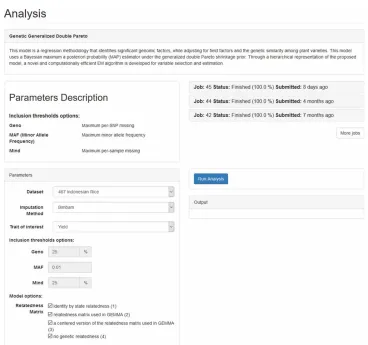
To perform the statistical analysis of the data, users click the “Analysis” button inside the “Models” tab from the home page. The analysis page is divided into two parts. The first describes the machine learning algorithm as well as parameters for fitting the model (see Figure 7). There is also a list of analyses that have been performed previously. The users can review the details of these analyses by clicking the hyperlinks.
The second panel displays important details on the analysis process. These include the parameters using in the modeling, such as the method of imputing missing data, the phenotype/trait of interest,
and options for adjusting for correlations among rice varieties. Once all the modeling parameters are set, the user can click the “Analysis” button to begin fitting the models.
Using a high-performance server, the data analysis process for this dataset was completed in several minutes. This server is a HP Proliant ML350 with 32 GB RAM, Intel Xeon E5-2620 CPU (6 core, 2.00 GHz, 15MB, 95W), and NVIDIA GPU Tesla K40. The analysis results are shown below the “Analysis” button once it is complete.
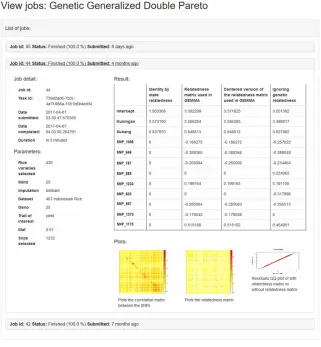
Once the analysis process is done, the user may see the results in the web portal as shown in Figure 8. The results dashboard includes details on the job, the modeling parameters, and the factors that have a significant effect on the traits of interest (i.e. crop yield). There are tabular and graphic results. The table consists of the significant genetic variants identified in any of the machine learning approaches applied. In this example, four methods were applied. If the value is zero, that genetic variant was not significant using that approach. If the value is non-zero, that factor (genetic or field) was significant, and the estimated effect is displayed. All of the methods identified field as an important factor. Using the identity by state relatedness matrix, the model included field factors but no genetic variants. The other relatedness matrices identified seven genetic variants predictive of yield. Ignoring relatedness identified nine genetic variants related to yield. These learned models may be validated and applied by rice scientists to new data to predict yield based on genotypes and as candidate
marker for molecular breeding research. The system also generates three plots: the correlation matrix between the genetic variants (SNPs), the relatedness matrix (i.e. similarity) between rice varieties, and modelling diagnostics (quantile-quantile plot). The plots show the complex correlations
in the data. Users may predict yield for new plants by applying the model weights to its genetic profile and expected field conditions.
6. CoNCLUSIoN
This web portal has become a valuable resource for rice scientists in Indonesia. It helps them manage and analyze data on many rice varieties and planting conditions. A major advantage of this web portal is its universal accessibility. The implementation takes advantage of cloud technologies. This allows multiple researchers to access, enter data, and run analysis jobs within the web portal at the same time. Additionally, the system removes IT barriers, such as installing and configuring software. Using this architecture researchers can share datasets while performing different analysis based on their own research aims. Concurrent analysis is streamlined using a modern job scheduler.
Due to the long planting cycle of rice, data management and analysis tools are needed to make decisions based on data. The insights learned from this data could help rice scientists plan and produce rice varieties with improved production qualities. For example, with additional data (currently being collected) rice scientists in Indonesia could validate the models presented. Once verified, they could
apply the model in various what-if scenarios. One usecase is providing the expected field conditions and use the model for selecting the rice varieties that have the best expected yields for planting. Another use-case is entering the genetic profile for candidate varieties for breeding and predicting their yield based on the model. The theme
is that by keeping score, this system can help users make informed decisions. This web portal provides a tool to estimate specific biosignatures that related to particular traits. The goal is that with enough data, the system could use those signatures to make predictions that could help reduce the costs and boost outputs for rice production.
While there are many advantages, this web portal still has several limitations that could be improved. One issue is the performance of importation of large genomic datasets. The current implementation requires that users manually import dataset in text formats. The import process depends on a stable and fast internet connection. A poor internet connection could cause a failure in the data import process, especially for extra large dataset. Tools to manage the upload process would be a valuable addition to the system. Another issue is many of the data processing software and algorithms do not take advantage of parallel processing. This will become an important issue as more -omic, field, and environmental data flows into the system. With larger datasets, stronger computational resources and parallel implementations of the steps in the workflow will be needed. In future versions of the system, General-purpose graphics processing unit (GPGPU) architectures,
graph-based schedulers, and map-reduce frameworks will be considered. These frameworks should offer significantly speedup in terms of data processing and fitting the models. In term of data processing and management, automatic data stream could improve the system. A mobile application is one possible solution to help field researchers capture data immediately and provide on the spot quality control. Another possibility is streaming weather data directly from the instruments on the field. These approaches will make the data flow into the system more seamless and with less error.
The system was applied to a small-scale application and additional data is needed to improve and validate the models. There are thousands of rice varieties and fields in Indonesia thus 467 rice samples across three fields is a beginning. As data collection and data driven decision making becomes a priority, the impact of the presented system increases. The database could be expanded to capture additional genomic information and field variables (e.g., type: type upland, swampy, irrigated and hybrid; field elevation, water pH, fertilization measure). Data from multiple seasons and fields are needed to distinguish important field factors and recognize trends. Should these data become available, the platform can incorporate these factors and build better prediction models. Once built they can be validated, and the models can be applied to crop improvement programs.
To face the anticipated food security issues caused by increased demand and challenging crop environments, a data driven approach to decision making is needed. Rice scientists must carefully collect and interpret complex data to make recommendations and develop improved rice varieties. The
web-portal, consisting of a database and machine learning analytics, provides the tools to help these scientists. The web portal allows for continued data integration, and translation of data to knowledge. The portal allows for updated models as more data becomes available, enabling new models to be created and validated for specific and changing needs. The web-portal fosters collaboration among agriculture stakeholders: researchers, breeders, and farmers. The learned models may be used to help produce improved rice varieties, and thus lowering costs in rice production.
ACKNoWLedGMeNT
ReFeReNCeS
Al-Ali, R., Kathiresan, N., El Anbari, M., Schendel, E. R., & Zaid, T. A. (2016). Workflow optimization of performance and quality of service for bioinformatics application in high performance computing. Journal of Computational Science, 15, 3–10. doi:10.1016/j.jocs.2016.03.005
Armagan, A., Dunson, D., & Lee, J. (2010). Bayesian generalized double pareto shrinkage. Biometrika. Armagan, A., Dunson, D. B., & Lee, J. (2013). Generalized double pareto shrinkage. Statistica Sinica, 23(1), 119. PMID:24478567
Arnold, R., Goldenberg, F., Mewes, H.-W., & Rattei, T. (2014). Simapthe database of all-against-all protein sequence similarities and annotations with new interfaces and increased coverage. Nucleic Acids Research,
42(D1), D279–D284. doi:10.1093/nar/gkt970 PMID:24165881
Canturk, K. M., Ozdemir, M., Can, C., Oner, S., Emre, R., Aslan, H., & Artan, S. et al. (2014). Investigation of key mirnas and target genes in bladder cancer using mirna profiling and bioinformatic tools. Molecular Biology Reports, 41(12), 8127–8135. doi:10.1007/s11033-014-3713-5 PMID:25189652
Challinor, A. J., Watson, J., Lobell, D., Howden, S., Smith, D., & Chhetri, N. (2014). A metaanalysis of crop yield under climate change and adaptation. Nature Climate Change, 4(4), 287–291. doi:10.1038/nclimate2153 Chen, W., Chen, H., Zheng, T., Yu, R., Terzaghi, W. B., Li, Z., & He, H. et al. (2014). Highly efficient genotyping of rice biparental populations by goldengate assays based on parental resequencing. Theoretical and Applied Genetics, 127(2), 297–307. doi:10.1007/s00122-013-2218-2 PMID:24190103
Clemencic, M., Couturier, B., & Kyriazi, S. (2015). Improvements to the user interface for lhcb’s software continuous integration system. Journal of Physics: Conference Series, 664(6), 062025. doi:10.1088/1742-6596/664/6/062025
Davis, N. A., Pandey, A., & McKinney, B. A. (2011). Real-world comparison of cpu and gpu implementations of snprank: A network analysis tool for gwas. Bioinformatics (Oxford, England), 27(2), 284–285. doi:10.1093/ bioinformatics/btq638 PMID:21115438
Eckardt, N. A. (2000, November). Sequencing the Rice Genome. The Plant Cell, 12(11), 2011–2018. Retrieved from http://www.ncbi.nlm.nih.gov/pmc/articles/PMC526008/
Fang, H., Xu, J., Ding, D., Jackson, S. A., Patel, I. R., Frye, J. G., & Tong, W. et al. (2010). An fda bioinformatics tool for microbial genomics research on molecular characterization of bacterial foodborne pathogens using microarrays. BMC Bioinformatics, 11(Suppl. 6), S4. doi:10.1186/1471-2105-11-S6-S4 PMID:20946615 Feng, W., Wang, Y., Huang, L., Feng, C., Chu, Z., Ding, X., & Yang, L. (2015). Genomicassociated markers and comparative genome maps of xanthomonas oryzae pv. oryzae and x. oryzae pv. oryzicola. World Journal of Microbiology & Biotechnology, 31(9), 1353–1359. doi:10.1007/s11274-015-1883-5 PMID:26093644 Fielding, R. T., & Kaiser, G. (1997). The apache http server project. IEEE Internet Computing, 1(4), 88–90. doi:10.1109/4236.612229
Goel, A., Bansal, N., & Gupta, S. (2016). Comparison of different web servers. Imperial Journal of Interdisciplinary Research, 2(12).
Gopalan, N. P., & Nagarajan, K. (2005). Self-refined fault tolerance in hpc using dynamic dependent process groups. In A. Pal, A. D. Kshemkalyani, R. Kumar, & A. Gupta (Eds.), Distributed computing – iwdc 2005: 7th international workshop, Kharagpur, India, December 27-30 (pp. 153–158). Springer. Retrieved from doi:10.1007/11603771_18
He, J., Zhao, X., Laroche, A., Lu, Z.-X., Liu, H., & Li, Z. (2014). Genotyping-by-sequencing (gbs), an ultimate marker-assisted selection (mas) tool to accelerate plant breeding. Frontiers in Plant Science, 5. PMID:25324846 Ho¨hna, S., Landis, M. J., Heath, T. A., Boussau, B., Lartillot, N., Moore, B. R., & Ronquist, F. et al. (2016). Revbayes: Bayesian phylogenetic inference using graphical models and an interactive model-specification language. Systematic Biology. PMID:27235697
Kementan. (2014). Statistik pertanian 2014. Kementan. (2015). Statistik pertanian 2015.
Kruuk, L. E. B. (2004, June). Estimating genetic parameters in natural populations using the “animal model”.
Philosophical Transactions of the Royal Society B: Biological Sciences, 359(1446), 873–890. doi:10.1098/ rstb.2003.1437
Libbrecht, M. W., & Noble, W. S. (2015, June). Machine learning in genetics and genomics. Nature reviews. Genetics, 16, 321–332. doi:10.1038/nrg3920
Lunacek, M., Braden, J., & Hauser, T. (2013). The scaling of many-task computing approaches in python on cluster supercomputers. In 2013 IEEE international conference on Cluster computing (cluster) (pp. 1–8). doi:10.1109/CLUSTER.2013.6702678
Lyons, E., Baes, C. F., & Vaughn, M. W. (2014). Cyberinfrastructure for life sciences -ianimal resources for genomics and other data driven biology. doi:10.13140/2.1.2361.3444
Maragkakis, M., Alexiou, P., Nakaya, T., & Mourelatos, Z. (2016). Clipseqtools—a novel bioinformatics clip-seq analysis suite. RNA, 22(1), 1–9. doi:10.1261/rna.052167.115 PMID:26577377
Papageorgiou, M. (2017). Genomics-centric approach: An insight into the role of genomics in assisting gm-rice varieties with-in a paradigm of future climate-change mitigation, food security, and gm regulation. J. Plant Sci. Agric. Res., 1, 1.
P´erez-Enciso, M., & Ferretti, L. (2010). Massive parallel sequencing in animal genetics: wherefroms and wheretos. Animal Genetics, 41(6), 561–569. doi:10.1111/j.13652052.2010.02057.x
Price, A. L., Helgason, A., Thorleifsson, G., McCarroll, S. A., Kong, A., & Stefansson, K. (2011, February). Single-Tissue and Cross-Tissue Heritability of Gene Expression Via Identity-by-Descent in Related or Unrelated Individuals. PLoS Genetics, 7(2). doi: 10.1371/journal.pgen.1001317
Pruim, R. J., Welch, R. P., Sanna, S., Teslovich, T. M., Chines, P. S., Gliedt, T. P., & Willer, C. J. et al. (2010). Locuszoom: Regional visualization of genome-wide association scan results. Bioinformatics (Oxford, England),
26(18), 2336–2337. doi:10.1093/bioinformatics/btq419 PMID:20634204
Sasaki, T. (2003). Rice genome analysis: Understanding the genetic secrets of the rice plant. Breeding Science,
53(4), 281–289. doi:10.1270/jsbbs.53.281
Sasaki, T., Matsumoto, T., Yamamoto, K., Sakata, K., Baba, T., Katayose, Y., & Gojobori, T. et al. (2002). The genome sequence and structure of rice chromosome 1. Nature, 420(6913), 312–316. doi:10.1038/nature01184 PMID:12447438
Toha, H. M. (2011). Pengembangan padi gogo mengatasi rawan pangan wilayah marginal.
Velloso, H., Vialle, R. A., & Ortega, J. M. (2015). Bows (bioinformatics open web services) to centralize bioinformatics tools in web services. BMC Research Notes, 8(1), 206. doi:10.1186/s13104-015-1190-0 PMID:26032494 Wang, D., Xia, Y., Li, X., Hou, L., & Yu, J. (2013, January). The Rice Genome Knowledgebase (RGKbase): an annotation database for rice comparative genomics and evolutionary biology. Nucleic Acids Research, 41, D1199–D1205. doi: 10.1093/nar/gks1225
Weber, T., & Kim, H. U. (2016). The secondary metabolite bioinformatics portal: Computational tools to facilitate synthetic biology of secondary metabolite production. Synthetic and Systems Biotechnology, 1(2), 69–79. doi:10.1016/j.synbio.2015.12.002 PMID:29062930
James W. Baurley’s educational background is computer science (Clemson University) and statistical genetics (University of Southern California). His research interest is on statistical computing in genomics.
Arif Budiarto is a technology enthusiast. He has work experiences ranging from system implementer to UX researcher at several IT companies. He also had a great opportunity to join summer internship program at the Royal Bank of Scotland (RBS) as a business and technology analyst. His expertise areas include Internet of Things (IoT) and Human Computer Interaction (HCI). His current research interest is how to design from, with and by data. He aims to combine his expertise in IoT with the advantage of data science to solve multidisciplinary real-life problems. He previously studied computer science at Bina Nusantara University for his bachelor’s degree and earned an MSc with distinction in Advanced Design Informatics at the University of Edinburgh.
Muhamad Fita Kacamarga is an innovative and knowledgeable network engineer and software developer with proven skills in installing, designing and developing IT solution. Fitra is proficient in network management tools and programming languages. His expertise includes cloud computing applications, big data processing, and implementation of variety of network devices. He is also a lecturer at Bina Nusantara University. His current research interest focusses on developing tools for big data analysis and parallel programming especially in bioinformatics problems. He earned a bachelor’s degree in Computer Science and master’s degree in Information Technology both from Bina Nusantara University.