CHANNEL ANALYSIS OF OPERATION POWER FLUCTUATION FOR
AP1000 REACTOR
Muh. Darwis Isnaini, Deswandri, Geni Rina Sunaryo
Center for Nuclear Reactor Technology and Safety, BATAN,
PUSPIPTEK Area Building no.80 Serpong, Tangerang Selatan, 15310 Indonesia email: [email protected]
ABSTRACT
CHANNEL ANALYSIS OF OPERATION POWER FLUCTUATION FOR AP1000 REACTOR. A study to analyze the influence of operation power fluctuations on channel analysis of AP1000 reactor has been carried out. The calculation was conducted as channel analysis, because sub-channel analysis could not be done by using COBRA-EN code for transient or power as time function. The calculations found that hot channel at peak linear power of 42.66 kW/m could represent hot sub-channel with peak linear power of 48.88 kW/m, fairly well. Between the two models, it was found that the peak center line fuel temperature, the peak radial average fuel temperature and MDNBR were 5.54%, -2.83% and 6.35%, respectively. For calculations of operation power fluctuations the 12-3-3-3-0.5-0.5-0.5-0.5-1 mode was used as a model for the hot channel using fuel and clad thermal properties as temperature functions. The results showed that on full power, 50-percent power and 110-percent power, the peak center line fuel temperatures were found to be 1697.25°C, 840.25°C and 1868.75°C, respectively. Moreover, the MDNBR were 2.65, 5.32 and 2.41, respectively. It was concluded that the reactor could be operated safely, while operation power fluctuation occurred.
Keywords: channel analysis, operation power fluctuation, COBRA-EN, AP1000.
ABSTRAK
ANALISIS KANAL TERHADAP PENGARUH FLUKTUASI DAYA OPERASI PADA
REAKTOR AP1000.Telah dilakukan suatu penelitian untuk mengetahui pengaruh fluktuasi
daya operasi pada analisis kanal reaktor AP1000. Perhitungan dilakukan dengan analisis kanal, karena pada kondisi transien atau daya fungsi waktu, analisis sub kanal tidak bisa dilakukan dengan menggunakan kode COBRA-EN. Dari perhitungan diperoleh bahwa kanal panas dengan puncak daya linier 42,66 kW/m mampu mewakili sub kanal panas dengan puncak daya linier 48,88 kW/m dengan cukup baik. Antara kedua model, diperoleh perbedaan untuk temperatur puncak sumbu bahan bakar, temperatur puncak rerata radial bahan bakar dan MDNBR masing-masing sebesar 5,54%, -2,83% dan 6,35%. Pada perhitungan fluktuasi daya dengan model 12-3-3-3-0.5-0.5-0.5-0.5-1, pada kanal panas dengan sifat termal sebagai fungsi temperatur. Hasil analisis menunjukkan bahwa pada daya penuh, daya 50-persen dan daya 110-persen diperoleh temperatur puncak sumbu bahan bakar masing-masing sebesar 1697,25°C, 840,25°C dan 1868,75°C. Sedangkan MDNBR masing-masing sebesar 2,65, 5,32 dan 2,41. Dari hasil tersebut dapat disimpulkan bahwa reaktor dapat beroperasi dengan tetap selamat, ketika terjadi fluktuasi daya operasi.
Kata kunci: analisis kanal, fluktuasi daya operasi, COBRA-EN, AP1000.
INTRODUCTION
condition obtained in the core analysis. And the hot sub-channel was only a fuel rod among 41448 fuel rods in the core.
In research on thermal-hydraulics analysis of radial and axial power fluctuation [1], the channel and sub-channels analysis have been conducted by using COBRA-EN code for beginning, middle and end of cycles of steady state condition. At the beginning of the cycle (BOC), the total peaking factors used in the analysis were 1.79 and 2.60, for hot channel and hot sub-channel, respectively. Using fixed thermal properties of fuel and cladding, the calculation results for hot channel showed that, the peak fuel center line temperature was 1208.65°C and the Minimum Departure from Nucleate Boiling Ratio (MDNBR) was 3.38, whereas for hot sub-channel showed that, the peak fuel center line temperature was 1608.15°C and the MDNBR was 2.49. In other research [2], thermal-hydraulics sub-channel analysis also has been carried out for nominal and over power on steady state condition, using COBRA-EN code. In this analysis, it showed that, for over power condition, the peak fuel center line was 1861.15°C and the MDNBR was 2.10. Other analysis using COBRA-EN also have been conducted for nano fluid application [3], optimizing a gap conductance [4], validation of SIMBAT-PWR [5], comparison analysis using fixed and temperature function of thermal conductivity [6], assessment of LWR performance [7], calculation capability for VVER [8,9,10] as well as thermal-hydraulic modeling of nano fluid [11,12].
Normally, the reactor was operated at nominal power. However, a fluctuation electricity demand in a region sometimes happened. For example, electricity demand increase between 5 a.m and 6 p.m in industry area, whereas for city lighting will increase between 6 p.m and 6 a.m, etc. So that, the electricity demand will increase between 12 p.m and 12 a.m, and decrease from 12 a.m to 12 p.m. It means that the fluctuation of electricity demand happens. Consequently, the change of reactor power was needed as time function. One of the power operation condition as time function was 12-3-6-3 daily load cycle as load follows capability of Nuclear Steam Supply System (NSSS) of PWR reactors. The 12-3-6-3 daily load cycle means the NSSS was operated for 12 hours at full power, decreasing load to 50-percent power over a 3 hour period, remaining at 50-percent power for 6 hours and returning to full power over a 3 hour period, in a simple called power fluctuations. This power fluctuation could be followed daily in PWR’s operation, through all of fuel cycles [13].
For analysis of steady state condition, COBRA-EN [14] could be used for channel and sub-channel analysis. However, for transient condition (condition for power operation as time function), COBRA-EN code could be used for channel (core) analysis only, but not for sub-channel analysis. The hot condition was found by sub-sub-channel analysis, which has 2.60 total peaking factor [1,2]. When the total peaking factor of 1.79 (equal to 33.52 kW/m of peak linear power) was used as a hot channel analysis, it was found that the peak fuel center line temperature was too low compared to one of the hottest sub-channel analysis. However, when the total peaking factor of 2.60 (equal to 48.88 kW/m of peak linear power) was used as a hot channel analysis, the MDNBR would drop to be very low. In the channel analysis condition, meant 264 fuel rods in the hot channels had peaking factor of 2.60. When mixing a fuel rod of 2.60 peaking factors with 263 fuel rods of 1.79 peaking factors, it will be found a homogeneous channel of 1.793 total peaking factors. A handy reference by NUREG [15], gave a comparative analysis of LWR fuel designs. For PWR 17×17 assemblies, channel with peak linear power of 13 kW/ft (equivalent to 42.66 kW/m) was advised to be analyzed as a hot channel. To obtain the peak linear power of 42.66 kW/m (equal to the total peaking factor of 2.216), equal to mixing 139 fuel rods of 2.60 peaking factors to 125 fuel rods of 1.79 peaking factors.
METHODOLOGY
The problem in the thermal-hydraulics analysis during reactor operation is the fluctuation of the operating power. One of PWR’s capabilities is that the reactor can be operated as time functions, such as 12-3-6-3 daily load cycle.
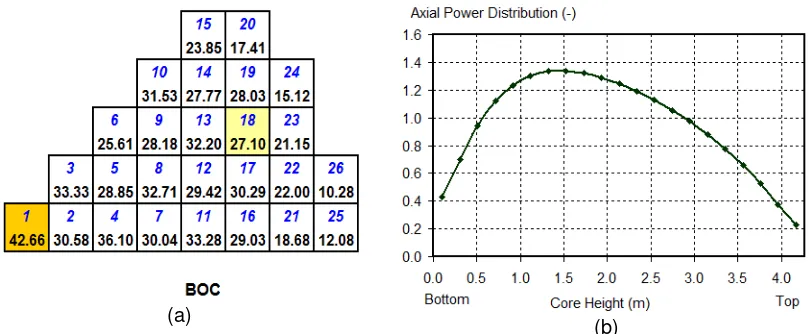
In the thermal-hydraulics calculation on the reactor operation fluctuation, the modeling and calculation were done using the COBRA-EN code and sub routine MATPRO for calculating the thermal properties of fuels and clad as temperature function. The calculation was based on the horizontal power distribution at Beginning of Cycle (BOC) [1] that was modified and converted to linear power distribution, and axial power distribution was found for 157 fuel assemblies at inserted control rod and hot full power conditions at BOC [14], as shown in Figure 1. From Figure 1.a., the peak linear power is 42.66 kW/m (position of H-8) and the axial power factor (Fz) is 1.34, respectively.
(a)
(b)
Figure 1. (a). Horizontal peak linear power distribution [1], and (b). Axial power distribution at BOC [14]
In the first step, the core thermal-hydraulics calculations (channel analysis) at full power and steady state condition were conducted, especially for hot channel model which has peak linear power of 42.66 kW/m. The calculation result would be compared to the result of hot sub-channel model which has peak linear power of 48.88 kW/m [1]. The comparison would give priority to the value of the peak fuel center line and average fuel temperature and the MDNBR.
In the second step, the calculations for reactor power fluctuation were conducted as channel analysis model. The reactor was modeled to be operated as time functions. The operation as time function in this model is not for daily operation [13], but the modified model was assumed as a human mistake operation. The modified power operation condition as a time function was 12-3-3-3-0.5-0.5-0.5-0.5-1. It means the reactor was operated for 12 hours at full power (100%), decreasing load to percent over a 3 hour period, remaining at 50-percent power for 3 hours, and returning to full power over a 3 hour period, remaining at full power for 0.5 hour, and then assumed a human mistake occurs by increasing load to 110-percent over a 0.5 hour, remaining at 110-110-percent power for 0.5 hour, returning to full power over a 0.5 hour, and remaining at full power for 1 hour, as shown in Table 1.
Table 1. Power fluctuation model as time function of reactor operation.
RESULTS AND DISCUSSION
Comparison of core calculation for the hot channel which has peak linear power of 42.66 kW/m and hot sub-channel calculation which has peak linear power of 48.88 kW/m is shown in Figure 2. Calculation for hot channel was done using fuel and clad thermal properties as temperature function, whereas the calculation of the hot sub-channel was using fixed thermal properties of fuels and clad.
(a) (b)
Figure 2. Graph of fuel temperature distribution versus core height. (a). Center line fuel temperature, and (b). Average fuel meat temperature
Figure 2(a) shows that the peak center line fuel temperature of hot channel and hot sub-channel are 1697.25°C and 1608.15°C, respectively. The peak center line fuel temperature of hot channel is 5.54% greater than the hot sub-channel, whereas at the lower and upper ends, the center line fuel temperature of hot channel is 14.78% and 8.87% lower than the hot sub-channel, respectively. This phenomenon happens, because at temperature lower than 1400°C, the average fuel thermal conductivity is greater than the fixed fuel thermal conductivity of 3.6 W/m°C [6]. Thereby, the center line fuel temperature of hot channel is lower than the hot sub-channel at the lower and upper ends. Whereas, at a temperature of higher than 1400°C, the average fuel thermal conductivity is lower than the fixed fuel thermal conductivity of 3.6 W/m°C [6]. Therefore, at around the mid fuel length, the center line fuel temperature of hot channel is higher than the hot sub-channel.
Figure 2(b) shows that the peak average fuel temperature of hot channel is 1094.45°C, about 2.83% less than the hot channel of 1126.35°C. The radial average fuel temperature along the hot channel is lower than the hot sub-channel. This phenomenon happens, because the radial average temperature along the channel is lower than 1400°C, so the average fuel thermal conductivity is greater than the fixed fuel thermal conductivity of 3.6 W/m°C. Therefore, the radial average fuel temperature along the hot channel is lower than the hot sub-channel.
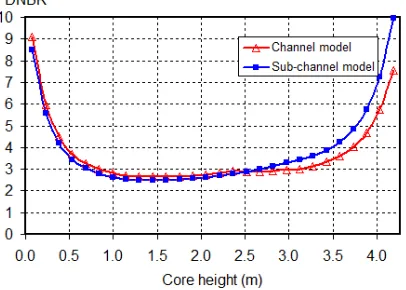
Figure 3 shows the distribution of DNBR along the hot channel and hot sub-channel. The MDNBR of hot channel is 2.65 which is 6.35% higher than the MDNBR of hot channel of 2.49 [1]. It means that hot channel analysis gives better MDNBR than hot sub-channel analysis.The phenomenon is due to the possible effect of homogenizing the sub-channel model. In modeling sub-channel, each fuel rod was surrounded by a flow area of 0.000087914 m2, wetted perimeter of 0.02983 m and hotted perimeter of 0.02983 m, Whereas in modeling channel, each homogenized fuel assembly was surrounded by a flow area of 0.024713 m2 (equal to flow area of 264 fuel rods and 25 guide thimble), wetted perimeter of 8.76088 m (equal to the wetted perimeter of 264 fuel rod and 25 guide thimble), and hotted perimeter of 7.87911 m (equal to the hotted perimeter of 264 fuel rods). Compare to MDNBR of general PWR of 2.17 [2,16], the MDNBR in the hot channel analysis (W-3 correlation) is found to be 14.75% greater.
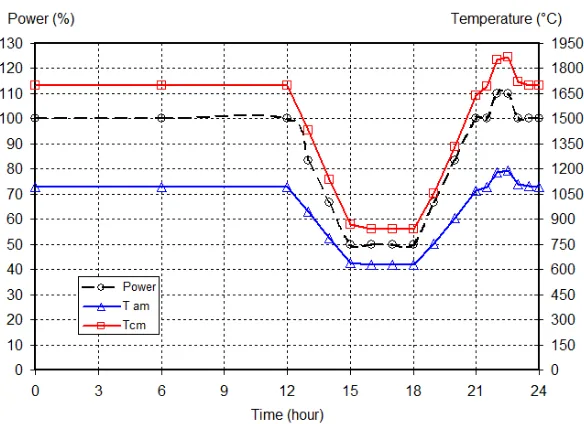
Based on the deviation of the peak center line fuel temperature, the peak average fuel temperature and the MDNBR, the thermal-hydraulics characteristics of the hot sub-channel of 48.88 kW/m could be well represented by hot channel of 42.66 kW/m in the transient channel analysis. In this channel analysis, operation power fluctuation in the twenty fourth hours is considered for calculation. Figure 4 shows the graph of peak center line fuel temperature and peak average fuel temperature during the power fluctuates.
Figure 4. Graph of peak center line and peak average fuel temperatures during the reactor power fluctuation
Figure 4 shows that the peak center line fuel temperatures on full power, 50-percent power and 110-percent power are 1697.25°C, 840.25°C and 1868.75°C, respectively. The graph also shows that the peak center line fuel temperature on full power steady state and at just reached full power are different, i.e., 1697.25°C and 1639.45°C, respectively. Likewise, the peak center line fuel temperature at just reached 110-percent power and in a little while returning to full power are also different, i.e., 1852.85°C and 1868.75°C, respectively. When the power is reached, but the heat generation has not been steady yet, so its temperature is less than steady temperature.
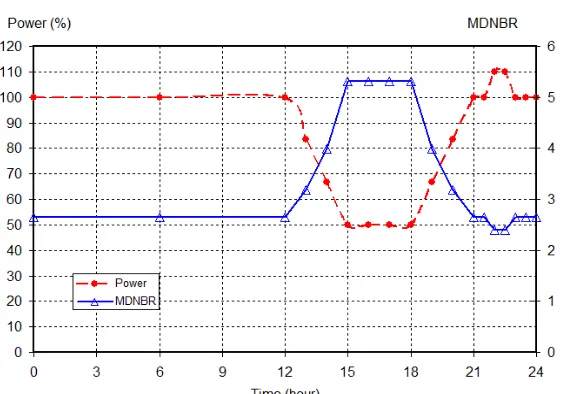
Figure 5. Graph of MDNBR during the reactor power fluctuation
CONCLUSION
The analysis of AP1000 channel thermal-hydraulic for determining the effect of operation power fluctuations was carried out. The analysis using thermal properties of fuels and clad as temperature function, was conducted by using COBRA-EN code + MATPRO. The channel analysis, which has peak linear power of 42.66 kW/m represent hot sub-channel of 48.88 kW/m, fairly well. The operation power fluctuation analysis showed that the peak center line fuel temperatures at full power, 50-percent power and 110-percent power were 1697.25°C, 840.25°C and 1868.75°C, respectively. Moreover, the MDNBR were 2.65, 5.32 and 2.41, respectively. It was concluded that the reactor could be operated safely, while operation power fluctuation occurred.
ACKNOWLEDMENT
This research was funded by the Center of Nuclear Reactor Technology and Safety in BATAN’s DIPA 2017/ Number: SP DIPA 080.01.1.450310/2017.
REFERENCES
1. Isnaini, M.D., Widodo S., and Subekti M., “Thermal-Hydraulics Analysis on Radial and Axial Power Fluctuation for AP1000 Reactor” Tri Dasa Mega, Vol. 17 No. 2, pp. 79-86, Jakarta (2015).
2. Isnaini M.D., and Subekti M., “Analisis Termohidrolika Sub Kanal AP1000 pada Kondisi Tunak Daya Nominal dan Daya Lebih” Prosiding Seminar Nasional Teknologi Energi Nuklir, p. 673-682, Pontianak (2014). (In Indonesian)
3. Zarifi E., Jahanfarnia G., Veysi F., “Sub-channel Analysis of Nanofluids Application to VVER-1000 Reactor. Chemical Engineering Research and Design 91, pp.625-632, (2013).
4. Rahgoshay M., Tilehnoee M.H., “Optimizing a Gap Conductance Model Applicable to VVER-1000 Thermal-Hydraulic Model”, Annals of Nuclear Energy 50, p. 263-267, (2012).
5. Isnaini M.D., Subekti M., “Validation of SIMBAT-PWR Using Standard code of COBRA-EN on Reactor Transient Condition”, Tri Dasa Mega, Vol. 18 No. 1, p. 41-50, Jakarta (2016).
6. Isnaini M.D., and Mutiara E., “A Comparison in Thermal-Hydraulics Analysis of PWR-1000 Using Fixed and Temperature Function of Thermal Conductivity”, Jurnal Pengembangan Energi Nuklir, Volume 18 No. 1, p. 31-38, Jakarta (2016).
7. Ott L.J., Robb K.R., Wang D., “Preliminary Assessment of Accident-Tolerant Fuels on LWR Performance During Normal Operation and Under DB and BDB Accident Condition”, Journal of Nuclear Materials 448, pp.520-533, (2014).
9. Rahmani Y., Pazirandeh A., Ghofrani M.B., Sadighi M. “Calculation of the Deterministic Optimum Loading Pattern of the BUSHEHR VVER-1000 Reactor Using the Weighting Factor Method”. Annals of Nuclear Energy 49, p. 170-181 (2012).
10. Kalkhoran O.N., Minuchehr A., Shirani A.S., Rahgoshay M., “Full Scope Thermal-Neutronic Analysis of LOFA in a VVER-1000 Reactor Core by Coupling PARCS v2.7 and COBRA-EN”, Progress in Nuclear Energy 74, p.193-200, (2014).
11. Zarifi E., Jahanfarnia G., Veysi F., “Thermal-Hydraulics Modeling of Nanofluids as the Coolant in VVER-1000 Reactor Core by the Porous Media Approach”, Annals of Nuclear Energy 51, pp.203-212, (2013).
12. Rahimi M.H., Jahanfaria G. “Thermal-Hydraulic Core Analysis of the VVER-1000 Reactor Using Porous Media Approach”. Journal of Fluids and Structures 51, p. 85-96, (2014).
13. Anonymous “The Westinghouse Pressurized Water Reactor Nuclear Power Plant”, Westinghouse Electric Corporation Water Reactor Divisions, Chapter 16: Plant Operation, pp. 207-218 (1984).
14. Basile D., Behgi M., Chierici R., Salina E., Brega E., “COBRA-EN : Code System for Thermal-Hydraulic Transient Analysis of Light Water Reactor Fuel Assemblies and Cores”, RSICC Code Package PSR-507, May, Oak-Ridge (2001)
15. O’Donnell G.M., Scott H.H., Meyer R.O., “A New Comparative Analysis of LWR Fuel Designs”, NUREG-1754, pp.11-1 - 11-25 (2001).