Advance Access publication September 13, 2011
Single Nucleotide Polymorphisms and
Haplotype Diversity in Rice
Sucrose
Synthase 3
P
UJIL
ESTARI, G
IANL
EE, T
AE-H
OH
AM, R
EFLINUR, M
I-O
KW
OO, R
IHUAP
IAO, W
ENZHUJ
IANG,
S
ANGH
OC
HU, J
OOHYUNL
EE,
ANDH
EE-J
ONGK
OHFrom the Department of Plant Science, Plant Genomics and Breeding Institute, and Research Institute of Agriculture and Life Sciences, Seoul National University, Seoul 151-921, Korea (Koh, Lestari, Ham, G. Lee, Woo, Jiang, Piao, Chu, Reflinur, and J. Lee); the National Academy of Agricultural Sciences, Rural Development Administration, Suwon, Korea (G. Lee); and the Indonesian Center for Agricultural Biotechnology and Genetic Resources Research and Development, Bogor, Indonesia (Lestari and Reflinur).
Address correspondence to H.-J. Koh at the address above, or e-mail: [email protected].
Abstract
Ricesucrose synthase 3(RSUS3) is expressed predominantly in rice seed endosperm and is thought to play an important role in starch filling during the milky stage of rice seed ripening. Because the genetic diversity of this locus is not known yet, the full sequence ofRSUS3from 43 rice varieties was amplified to examine the distribution of DNA polymorphisms. A total of 254 sequence variants, including SNPs and insertion/deletions, were successfully identified in the 7733 bp sequence that comprises the promoter, exons and introns, and 3# downstream nontranscribed region (NTR). Eleven haplotypes were distinguished among the 43 rice varieties based on nucleotide variation in the 3 defined regions (5#NTR, transcript, and 3# NTR). The promoter region showed evidence of a base change on acis-element that might influence the functional role of the motif in seed-specific expression. The genetic diversity of theRSUS3gene sequences in the rice germplasm used in this study appears to be the result of nonrandom processes. Analysis of polymorphism sites indicated that at least 11 recombinations have occurred, primarily in the transcribed region. This finding provides insight into the development of a cladistic approach for establishing future genetic association studies of theRSUS3 locus.
Key words: haplotype, rice, SNP, sucrose synthase 3
Sucrose synthase, also termed UDP-glucose: D-fructose 2-glucosyl-transferase, plays a major role in the entry of sucrose into diverse pathways involved in cellular processes. Sucrose synthase (SUS) genes have been isolated in starch-storing plants as well as in sucrose- and hexose-starch-storing plants (Heim et al. 1993). SUS isoforms are encoded by 2–3 genes that have been isolated in monocots, including rice (Wang et al. 1992; Huang et al. 1996; Hirose et al. 2008). Two or more genes that encode SUS isoforms have also been isolated from dicots (Chopra et al. 1992;Horst et al. 2007). However, the SUS genes of monocots and dicots differ markedly in their evolutionary origin based on their sequence and overall structure (Komatsu et al. 2002).
Rice SUS (RSUS) are involved in various growth processes and response to environmental stress in rice. RSUS3 is the third of 6 genes that encode RSUS that have been identified and characterized (Wang et al. 1999; Hirose et al. 2008). RSUS1andRSUS2participate in a number of housekeeping roles, whereas RSUS3 and RSUS4 play a potential role in
carbon allocation in the filling grain. In contrast, transcript
levels of RSUS5 and RSUS6 are low in all tissues and
suppressed in germinating shoots (Hirose et al. 2008). Sequence analysis revealed thatRSUS2andRSUS3may have evolved from the same ancestor after the divergence of RSUS1. The levels ofRSUS3andRSUS1in developing seeds are complementary, indicating that they are equally important in rice seed development (Wang et al. 1999).
RSUS3is localized predominantly to the endosperm and the aleurone layer, being induced at the onset of starch synthesis (Huang et al. 1996). RSUS3 is predominantly expressed in cells that contain starch granules. During the milky stage, the activity ofRSUS3is at its highest, indicating that RSUS3plays an important role in starch filling during the milky stage in rice (Wang et al. 1999).
Several studies in rice have yielded important information about RSUS3, such as its complete structure (Huang et al. 1996), its genetic locus (Kishimoto et al. 2001), its de-velopmentally regulated expression (Wang et al. 1999), its
at Seoul National University on December 13, 2011
http://jhered.oxfordjournals.org/
expression profile in rice (Hirose et al. 2008), and characterization of its promoter (Rasmussen and Donaldson 2006). Since Huang et al. (1996) first sequenced the coding region and the associated intron ofRSUS3, great strides have been made in analysis of theRSUS3sequence. For example, it has been reported that duplication of the promoter region of RSUS3enhances gene expression (Rasmussen and Donaldson 2006). Moreover, the presence of an intron upstream of the ATG translational start site is conserved in most SUSgenes (Simpson and Filipowics 1996), includingRSUS3(Huang et al. 1996). However, none of these studies have addressed the haplotype structure and genetic variation ofRSUS3.
Direct analysis of genetic variation in the DNA sequence at a locus of interest has become possible due to improve-ments in DNA sequencing technology. Genotyping method especially SNPs-based approach makes the SNPs more attractive as genetic markers (Ching et al. 2002). SNPs derived from a whole-genome scan or full sequence of locus are able to provide high marker density, which is required for trait mapping by allele association (Syvanen 2001). SNPs may also be used for the integration of genetic and physical maps and mapping expressed sequence tags. In addition, variation of DNA sequence allows for the elucidation of valuable information about the evolutionary history of a particular region in a genome and/or species. Consequently, compar-ison of the level and distribution of nucleotide variation at specific loci within and between species would be useful for investigating the role of molecular evolution.
Because the genetic diversity of the RSUS3 locus is not known yet, a study of the genetic variation ofRSUS3in the relevant rice germplasm would provide a better understanding of the range of diversity and the nature of the genetic changes associated with domestication and selection of rice. Therefore,
we generated and compared the full-length DNA sequences of RSUS3from a number of domesticated and wild rice strains to determine the genetic variability of this locus. In this study, we described haplotype diversity, an evolutionary divergence, and a history of recombination events in this gene in rice.
Materials and Methods
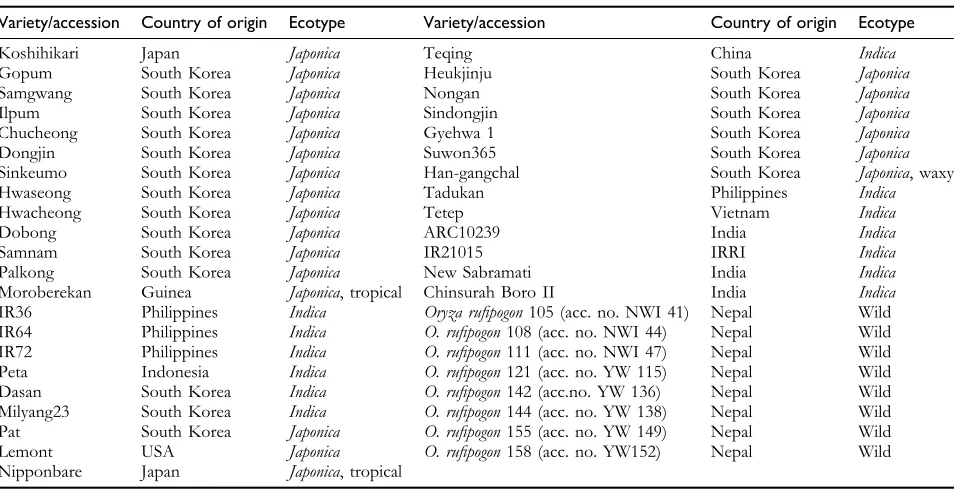
Plant Materials and DNA ExtractionRice varieties/accessions from multiple origins were obtained from the germplasm collection maintained by the Crop Molecular Breeding Laboratory at Seoul National University and the Rural Development Administration, Suwon, Korea (Table 1). Thirty-five domesticated rice varieties and 8 wild rice accessions were used in this study.
In the tillering stages, leaves were harvested for DNA extraction. Genomic DNA was extracted using cetyl trimethyl ammonium bromide method based on the protocol of
Murray and Thompson (1980).
Gene Sequences and Primer Design
The RSUS3 sequences in the genomic database (www.
gramene.org), SUS 3_ORYSJ (LOC_Os07g42490), and the
promoter (AX063520) (Rasmussen and Donaldson 2006),
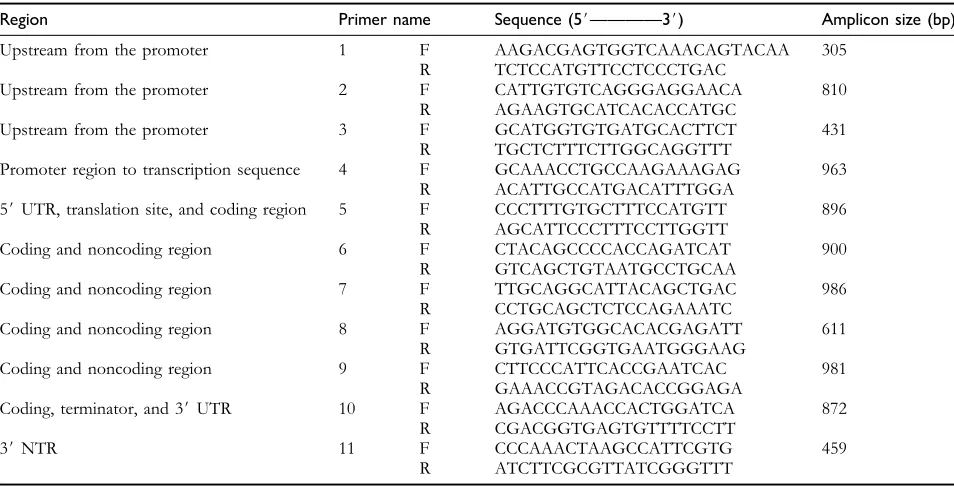
totaling 7733 bp, were amplified and resequenced from 43 rice varieties/accessions (Figure 1). For amplification of the 5#upstream promoter region,RSUS3transcript, intron, and
3# downstream nontranscribed region (NTR), 11
over-lapped primer pairs were designed for polymerase chain reaction (PCR) using the PRIMER3 program available at http://frodo.wi.mit.edu/cgi-bin/primer3 (Rozen and Skaletsky 2000) (Table 2). To assure the fidelity ofRSUS3
Table 1 List of rice varieties/accessions used in this study
Variety/accession Country of origin Ecotype Variety/accession Country of origin Ecotype
Koshihikari Japan Japonica Teqing China Indica
Gopum South Korea Japonica Heukjinju South Korea Japonica Samgwang South Korea Japonica Nongan South Korea Japonica Ilpum South Korea Japonica Sindongjin South Korea Japonica Chucheong South Korea Japonica Gyehwa 1 South Korea Japonica Dongjin South Korea Japonica Suwon365 South Korea Japonica Sinkeumo South Korea Japonica Han-gangchal South Korea Japonica, waxy Hwaseong South Korea Japonica Tadukan Philippines Indica Hwacheong South Korea Japonica Tetep Vietnam Indica
Dobong South Korea Japonica ARC10239 India Indica
Samnam South Korea Japonica IR21015 IRRI Indica
Palkong South Korea Japonica New Sabramati India Indica Moroberekan Guinea Japonica, tropical Chinsurah Boro II India Indica IR36 Philippines Indica Oryza rufipogon105 (acc. no. NWI 41) Nepal Wild IR64 Philippines Indica O. rufipogon108 (acc. no. NWI 44) Nepal Wild IR72 Philippines Indica O. rufipogon111 (acc. no. NWI 47) Nepal Wild Peta Indonesia Indica O. rufipogon121 (acc. no. YW 115) Nepal Wild Dasan South Korea Indica O. rufipogon142 (acc.no. YW 136) Nepal Wild Milyang23 South Korea Indica O. rufipogon144 (acc. no. YW 138) Nepal Wild Pat South Korea Japonica O. rufipogon155 (acc. no. YW 149) Nepal Wild Lemont USA Japonica O. rufipogon158 (acc. no. YW152) Nepal Wild Nipponbare Japan Japonica, tropical
at Seoul National University on December 13, 2011
http://jhered.oxfordjournals.org/
sequenced in this study, the sequences resulting from the overlapped primers designed were assembled with pairwise aligment (optimal GLOBAL alignment) using BioEdit program. After all, those all sequences were confirmed with theRSUS3sequence available in the database.
PCR Amplification and Sequencing Analysis
Standard PCR using Ex Takara Taq Polymerase (Takara Bio, Inc., Japan) was performed. The reaction parameters were as follows: 10 s at 95°C, 30 s at 55°C, and 1 min at 72°C for
a total of 35 cycles in a PTC 200 Peltier Thermal Cycler (MJ Research, Watertown, MA). The purified PCR products were TA cloned into pGEM-T Easy vector and transformed into Escherichia coli DH5a-competent cells prepared as
recommended by the protocol of Sambrook and Russell
(2001). The plasmid was isolated using DNA-spin Plasmid DNA Purification Kit (Intron Biotechnology, Korea) and further sequenced with an ABI 3700 DNA Sequencer (Applied Biosystems, Inc.). Any ambiguous sequences were resolved by repeated PCR runs and sequencing of the plasmid from both ends.
Data Analysis
The sequences were assembled and aligned using BioEdit software (http://www.mbio.ncsu.edu/BioEdit/bioedit.html), which was used to identify polymorphism sites. The sequences were then edited for further analysis. The frequencies of polymorphic sites per base pair were calculated by dividing the total number of polymorphic sites of a given type (SNPs, insertion/deletions [indels], or both) by the length of the
Figure 1. Representation of the DNA region containing RSUS3that was amplified and sequenced from 43 rice varieties/
accessions. The relative position of the base mutation in thecis-element in the promoter region is indicated in which CATGCATA existed in other varieties, whereas CATGCAAA was only in Pat and Lemont. UTR, untranslated region; NTR, nontranscribed region; ATG, start codon; and TGA, stop codon.
Table 2 Primers used for PCR amplification and sequencing of theRSUS3gene
Region Primer name Sequence (5#————3#) Amplicon size (bp)
Upstream from the promoter 1 F AAGACGAGTGGTCAAACAGTACAA 305 R TCTCCATGTTCCTCCCTGAC
Upstream from the promoter 2 F CATTGTGTCAGGGAGGAACA 810 R AGAAGTGCATCACACCATGC
Upstream from the promoter 3 F GCATGGTGTGATGCACTTCT 431 R TGCTCTTTCTTGGCAGGTTT
Promoter region to transcription sequence 4 F GCAAACCTGCCAAGAAAGAG 963 R ACATTGCCATGACATTTGGA
5#UTR, translation site, and coding region 5 F CCCTTTGTGCTTTCCATGTT 896 R AGCATTCCCTTTCCTTGGTT
Coding and noncoding region 6 F CTACAGCCCCACCAGATCAT 900 R GTCAGCTGTAATGCCTGCAA
Coding and noncoding region 7 F TTGCAGGCATTACAGCTGAC 986 R CCTGCAGCTCTCCAGAAATC
Coding and noncoding region 8 F AGGATGTGGCACACGAGATT 611 R GTGATTCGGTGAATGGGAAG
Coding and noncoding region 9 F CTTCCCATTCACCGAATCAC 981 R GAAACCGTAGACACCGGAGA
Coding, terminator, and 3#UTR 10 F AGACCCAAACCACTGGATCA 872 R CGACGGTGAGTGTTTTCCTT
3#NTR 11 F CCCAAACTAAGCCATTCGTG 459
R ATCTTCGCGTTATCGGGTTT
F, Forward primer; R, Reverse primer.
at Seoul National University on December 13, 2011
http://jhered.oxfordjournals.org/
nucleotide sequence. The distribution of polymorphisms
throughout the RSUS3 gene was tested for random
expectation using chi square. For this analysis, the total length of the sequence was divided into 3 sections, namely a 1652 bp upstream sequence (harboring the promoter elements), a 2815 bp transcript (5#untranslated region/UTR, coding region, and
3# UTR), and a 542 bp 3# NTR sequence. The combined
results from analysis with DNASP 3.14 (Rozas J and Rozas R 1997) and MEGA 4.0 (Tamura et al. 2007) were used to conduct intraspecific analysis, calculate genetic distances, and identify recombination events.
The sequence diversity was estimated as the nucleotide diversity (p) and the evolutionary divergence (k) within each group and each defined region (Nei 1987). Estimates of evolutionary divergence were based on the pairwise distance between sequences using the maximum composite likelihood method (Tamura et al. 2007). To test the neutrality of the polymorphisms, we utilized Tajima’sDstatistical test (Tajima
1989), which considers the difference between theta
Watterson (hw) and nucleotide diversity (p). The coalescence
process defined by Fu and Li’sD* andF* statistical tests (Fu and Li 1993) was used to test for evidence of the neutral theory of molecular evolution. The minimum number of recombination events, Rm (Hudson and Kaplan 1985), in the history of theRSUS3locus among rice varieties was calculated using the four-gamete test. The estimator of recombination (C54Nc) was based on the variance of the average number of nucleotide differences between pairs of sequences.
With MEGA 4.0, neighbor joining trees were built based on the haplotype sequences using differences in nucleotide number as a distance measure. Multiple bootstrap resamples
of the nucleotide alignment were determined by 1000 bootstrap replications (Ching et al. 2002) of the data. This analysis was used in conjunction with the consensus tree program to perform bootstrap analysis and provide an internal estimate of how well the data supported the phylogenetic trees (Tamura et al. 2007).
Results
Nucleotide Polymorphisms and Allele Distribution
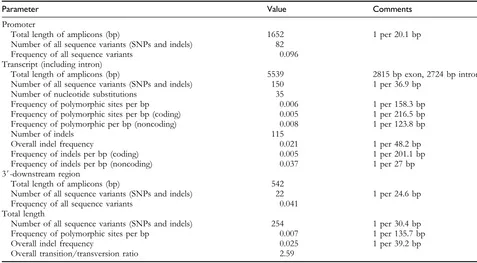
Nucleotide changes and indels at the RSUS3 locus were
identified, and the results are summarized inTable 3. Analysis of the tested germplasm, consisting of 13 indica varieties, 22 japonica varieties, and 8 wild rice accessions (Oryza rufipogon), revealed allelic diversity at the RSUS3 locus. Sequence polymorphisms were detected across the length of 7733 bp, which covers a 1652 bp upstream region, a 2815 bp coding region, a 2724 bp noncoding region, and a 542 bp downstream region (Figure 1). From the 43 rice varieties/accessions, a total of 254 variants were detected, revealing the frequencies of SNPs and indels (1 SNP every 135.7 bases and 1 indel every 39.2 bases on average). No triallelic SNPs were found in any of the defined regions. The frequency of SNPs/indels was highest in the promoter region, a finding driven by the large number of SNPs/indels in the promoter region in the wild rice accessions. The 3# NTR contained abundant nucleotide and length polymorphisms (frequency of total variants 5 0.041), which were distributed between the cultivated varieties and the wild rice accessions. However, the overall indel frequency in the transcribed region was higher than the nucleotide
Table 3 Summary of the frequency of polymorphisms
Parameter Value Comments
Promoter
Total length of amplicons (bp) 1652 1 per 20.1 bp Number of all sequence variants (SNPs and indels) 82
Frequency of all sequence variants 0.096 Transcript (including intron)
Total length of amplicons (bp) 5539 2815 bp exon, 2724 bp intron Number of all sequence variants (SNPs and indels) 150 1 per 36.9 bp
Number of nucleotide substitutions 35
Frequency of polymorphic sites per bp 0.006 1 per 158.3 bp Frequency of polymorphic sites per bp (coding) 0.005 1 per 216.5 bp Frequency of polymorphic per bp (noncoding) 0.008 1 per 123.8 bp
Number of indels 115
Overall indel frequency 0.021 1 per 48.2 bp
Frequency of indels per bp (coding) 0.005 1 per 201.1 bp Frequency of indels per bp (noncoding) 0.037 1 per 27 bp 3#-downstream region
Total length of amplicons (bp) 542
Number of all sequence variants (SNPs and indels) 22 1 per 24.6 bp Frequency of all sequence variants 0.041
Total length
Number of all sequence variants (SNPs and indels) 254 1 per 30.4 bp Frequency of polymorphic sites per bp 0.007 1 per 135.7 bp
Overall indel frequency 0.025 1 per 39.2 bp
Overall transition/transversion ratio 2.59
at Seoul National University on December 13, 2011
http://jhered.oxfordjournals.org/
substitution frequency in the region. The SNP frequency in the coding region was less than the average of SNP frequency in the entire transcribed region; one SNP occurred every 216.5 bp in the coding region. The frequency of nucleotide substitutions was about 1.6 times higher in the noncoding region than in the coding region, and both nucleotide changes and indels were more frequent in the noncoding region than in the coding region. The differences in the distribution of the differences in the lengths of the indels in all regions varied in size from 1 to 32 bp, with an average indel length of 2.87 bp. The distribution of SNP and indel sites was not significantly different (when degrees of freedom52, SNPsv250.228; indelsv250.377) across the entire region excluding intron (5#NTR-transcript-3# NTR).
Most of the nucleotide changes in the protein-coding regions were nonsynonymous substitutions in codon triplets; 9 of 13 changes resulted in an amino acid alteration. Of the 4 synonymous substitutions, 1 was detected in Koshihikari, a high palatable rice variety, 2 were shared by most of theindicavarieties, and 1 was specific to thejaponica varieties. For the ‘‘rare’’ allele in each of the 9 nonsynonymous base substitutions, 1 was unique to Koshihikari, 1 was shared by 2O. rufipogonaccessions (105 and 108), 3 were detected only in Koshihikari and Gopum, and the other 4 nonsynonymous substitutions were found in most ofindicavarieties. The fact that nonsynonymous variability is higher, relative to synon-ymous site, suggesting that it is involved in the selective process and leads to state that balancing selection takes place at this loci.
Polymorphism analysis confirmed the high frequency of polymorphism inRSUS3locus into a large number of SNPs and indels. Particularly, nonsynonymous substitutions un-dergone in the protein-coding region might provide a beneficial source of functional markers. As preliminary stride, 2 markers based on the indel and SNP found in RSUS3, namely S3cI (indel marker) and S3cII (dCAPS marker) were developed. The S3cI primer was effectively included in the model regression equation for evaluation of eating quality ofjaponica rice (Lestari et al. 2009). More markers have been being explored on the basis of nucleotide variation inRSUS3locus. The allele distribution in the germplasm used in this study was evaluated by Tajima’sDtest (Tajima 1989) and Fu and Li’s D* and F* tests (Fu and Li 1993) to assess the neutrality of the mutations. The frequency spectrum of polymorphic sites for the total length was skewed toward
a deficit of low-frequency alleles relative to expectations based on a positive outcome by Tajima’sDtest (0.923). The Tajima’s D value for the total region of RSUS3 excluding intron was lower than that for the entire length. Separate Tajima’s D tests for each region (upstream, coding, and noncoding region) revealed positive and nonsignificant departures from the neutral expectation, with the exception of the 3#downstream NTR, which had a negative Tajima’s Dvalue (D50.326). Using the coalescent process to test
the neutrality of the mutations in the entire gene sequence, similar positive values were obtained, but significant deviation from the neutral expectation (P,0.02) occurred
with the Fu and Li D* (1.959) and F* (1.894) tests.
A summary of this neutrality test is presented in Table 4.
Genetic Variability and Divergence
Rasmussen and Donaldson (2006) reported that putative endosperm and seed-specific elements involved in the regulation of gene expression were present in the sequences of the promoter region of the RSUS3gene. Therefore, we examined the sequence variation identified in the promoter regions. In Pat and Lemont rice varieties, the RY repeats, which arecis-elements involved in seed specificity, contained
a base mutation from T (CATGCATA) to A
(CATG-CAAA), indicating that these varieties contain different consensus cis-elements than the other cultivated varieties and wild rice accessions. A summary of the analysis of the promoter elements is presented in Figures 1and2.
The full-length sequence of RSUS3 in the tested rice varieties/accessions contained 57 segregating sites. However, only 35 of the segregating sites were detected across the region of 5#NTR-transcript-3#NTR. Moreover, some variants were detected only in the same variety group and revealed higher nucleotide diversity (0.263) than indel diversity (0.015). The mean nucleotide diversity and the mean pairwise distance used to estimate the average evolutionary divergence for the total length ofRSUS3was higher (p50.291,k50.481) than the mean nucleotide diversity and mean pairwise distance of the total region except intron (p50.263,k50.406). Moreover, the noncoding region showed higher nucleotide diversity (p5 0.336) and divergence (k 5 0.762) compared with the other regions. In the coding region, the nucleotide diversity of the synonymous sites (p 50.703) was 2.8-fold greater than that of the nonsynonymous sites (p 5 0.254). Analysis of the
Table 4 Nucleotide diversity and divergence in each region of theRSUS3gene
Parameter Promoter Exon Intron 3#downstream NTR Promoterþtranscriptþdownstream NTR Entire length
S 14 13 22 8 35 57
p 0.269 0.292 0.336 0.204 0.263 0.291
k 0.514 0.613 0.762 0.277 0.406 0.481
D 0.514ns 0.809ns 1.501ns 0.326ns 0.472ns 0.923ns
D* 1.538* 1.508* 1.703** 1.308ns 1.845** 1.959**
F* 1.415ns 1.507ns 1.936** 0.926ns 1.623ns 1.894**
S, number of segregating sites;p, nucleotide diversity;k, average evolutionary divergence;D, Tajima’sDtest;D*, Fu and Li’sD*; andF*, Fu and Li’sF*. ns, nonsignificant at 5%; * and **, significant at 5% and 1%, respectively.
at Seoul National University on December 13, 2011
http://jhered.oxfordjournals.org/
sequence diversity of the entire region without intron revealed thatindicavarieties were less diverse (p50.028) thanjaponica varieties (p50.069) and that both types showed less genetic diversity than the wild rice accessions (p50.087). The mean diversities within the groups comprising japonica, indica, and O. rufipogon (0.236) were higher than the mean intergroup diversity (0.169), suggesting the influence of demographic factors. For the entire region and its specific functional parts, nucleotide diversity, divergence estimates, and neutrality tests are presented inTable 4.
To quantify the degree of variation between different varieties, the mean of the evolutionary distance between the sequences in the region of 5# NTR-transcript-3# NTR was calculated. Based on pairwise comparison analysis of all 43 sequences using the maximum composite likelihood method (Tamura et al. 2007), the distances between the Milyang 23 and Hwacheong varieties were determined to be the largest (1.290). In addition, the distances between some pairs (Teqing–Peta, Gopum–Koshihikari, Ilpum–Samkwang, and Sindongjin–Moroberekan) were identical. The evolutionary divergence between japonica and O. rufipogon (0.334 for the entire region and 0.282 for the entire region excluding intron) was less than between indicaand O. rufipogon (0.553 for the entire region and 0.479 for the entire region excluding intron). Even though the japonica varieties showed a slightly higher pairwise distance mean than theindicavarieties, they were still
of a comparatively similar evolutionary distance from one another.
Haplotype Diversity
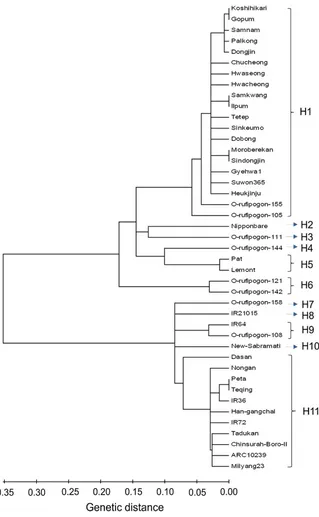
An initial prediction of the number of haplotypes ofRSUS3 was determined using the coalescent theory (Wall and Hudson 2001). The predicted haplotype numbers for each functional part of the promoter, transcript, and downstream region were 17, 12, and 12, respectively. The highest haplotype diversity (Hd: 0.866) was observed in the promoter region, and the lowest Hd (0.828) was observed in the downstream region. Analysis of the entire region excluding intron with the method of Kreitman and Hudson (1991) with a 95% confidence threshold using the fixed-S approach and 104 replicates revealed that the nucleotide diversity ranged from 1.645 to 1.801, and the estimated haplotype number was from 10 to 22. Finally, using bootstrap analysis, the genealogy of the sequences containing 11 major highly differentiated haplotypes groups across the region of 5# NTR-transcript-3# NTR was successfully assembled. Similar variants contributed to cate-gorize each unique haplotype group that tend to be inherited together. A neighbor joining tree was constructed to illustrate
the phylogenetic branching order between the 5#
NTR-transcript-3# NTR and to elucidate the evolutionary history (Figure 3). As expected from the spread of evolutionary distances between all pairs of sequences, the branch lengths
Figure 2. The sequence of upstream promoter elements of thesucrose synthase 3gene. Underlined letters denote the position of
the putative intron sequence. The TATA box and start codon of ATG are indicated by bold–underlined black letters. Underlined brown letters indicate the GCN4 element and endosperm boxes, whereas underlined blue italic letters indicate the RY repeats in whichcis-elements play a role in seed specificity (Baumlein et al. 1992;Rasmussen and Donaldson 2006). The black letter ‘‘T’’ in the
one ofcis-elements undergoes a point mutation to ‘‘A.’’ at Seoul National University on December 13, 2011
http://jhered.oxfordjournals.org/
were proportional to evolutionary distance. Analysis using an arbitrary 85% cutoff with 1000 bootstrap samples indicated that H6 (Pat and Lemont) and part of H1 (between Koshihikari and Gopum) were strongly supported.
The phylogenetic tree revealed that these haplotypes appeared to be related to the variety of the rice rather than to the ecotype from a particular geographical area. Two haplotypes, namely H1 and H11, appeared to be the major
haplotypes, encompassing almost all of thejaponicaandindica varieties. The other minor haplotypes contained 1 or 2 wild accessions/varieties. Interestingly, H9 contained the indica variety, IR64, and wild accession ofO. rufipogon108, whereas Nipponbare, the reference variety used in rice genomics studies was individually classified. The wild Nepalese O. rufipogon represented 6 of the 11 haplotypes, based on homozygous SNPs. The cultivated rice varieties (indica and
Figure 3. Neighbor joining tree representing theRSUS3haplotype relationships based on the entire region excluding intron
(upstream, transcript, and 3#downstream NTR sequence).
at Seoul National University on December 13, 2011
http://jhered.oxfordjournals.org/
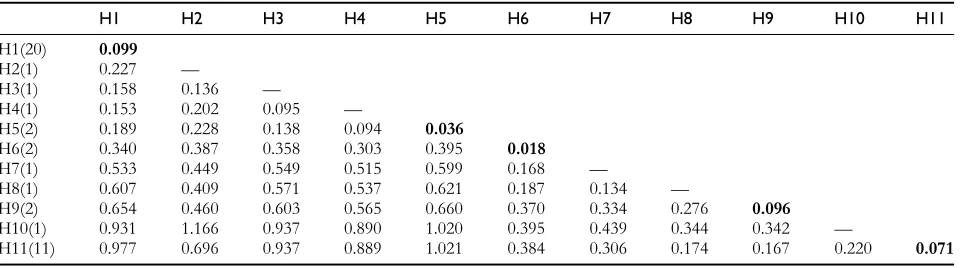
japonica) showed more divergence (0.437) compared with the wild rice accessions (0.239). In regard to the wild rice, O. rufipogon 142 was less divergent (0.292) from the cultivated haplotypes than any of the other varieties. In contrast, O. rufipogon 144 showed the greatest divergence from cultivated rice (0.420). According to determination of evolutionary distance within the haplotypes, the largest divergence was in the H1 group (0.099), which consisted primarily ofjaponicavarieties. The second largest divergence was in the H9 group (0.096). The H6 group, consisting of the wild rice accessions, showed the smallest mean evolutionary distance (0.018). The mean distance between haplotype groups illustrates the high evolutionary
diver-gence of the RSUS3 gene (0.977), principally between
japonica (H1) and indica (H11), although the greatest divergence (1.166) was between H2 (Nipponbare) and H10 (New Sabramati). The haplotypes containing wild rice strains showed less divergence from the haplotype contain-ingjaponicavarieties (0.094), as evidenced by the divergence between the H4 (O. rufipogon 144) and the H5 (Pat and Lemont). The other wild rice haplotypes, H3 and H4, also showed less distance (0.095); moreover, these 2 were less divergent from the japonica haplotype (H1) than the indica haplotype (H11). A summary of the mean evolutionary distances within and between the assigned haplotypes is presented inTable 5. The distribution of SNP and indel sites in the promoter and the transcribed region contributed a unique polymorphism in each haplotype established in this study. The SNP and indel positions in the RSUS3 gene– upstream region and transcribed and downstream regions supporting the development of 11 haplotypes are presented inTables 6and7, respectively.
Evidence of Recombination
A total of 48 polymorphic sites in the entire region without intron were analyzed for evidence of recombination. The patterns of the polymorphisms identified in the varieties and accessions surveyed in this study indicated a history of recombination at the RSUS3 locus, which contributed to haplotype diversity. Using the algorithm of Hudson and Kaplan (1985), it was determined that at least 11 re-combination events were responsible for the polymorphism
pattern identified in the RSUS3 gene. The recombinations were detected in the informative sites of the 3 regions: a minimum of 3 recombinations in the 5#NTR (1639 to
1630, 1594 to 1588, and 679 to 600), 4 in the
transcribed region (1072–2734, 2734–3305, 4117–4148, and 4148–4572), 1 in the position between the transcribed region and the downstream region (4572–5627), and 3 in the 3# NTR (5627–5923, 6041–6050, and 6050–6055).
Evidence of recombination events was found by comparing the polymorphism pattern in the Tetep variety (H1) to that of other haplotypes. The 5#NTR sequence of Tetep, originally characterized as an indica variety, was identical to that of commonjaponicahaplotype (H1). On the other hand, most of the polymorphism sites in the transcribed region of Tetep were shared with at least 2 wild rice accessions (O. rufipogon111 and 144). In the downstream region, Tetep was not similar to the japonicahaplotype but highly similar to theindicahaplotype (H11), with 14 identical indels in particular (Table 7). This suggests that theRSUS3 gene sequence detected in Tetep is a product of the result of at least 2 past recombination events between the either the indica orjaponicahaplotype and/or vice versa.
Discussion
A number of nucleotide and length polymorphisms are
evenly distributed in the RSUS3 locus, as shown by
a nonsignificant difference in the frequencies detected among 5# NTR, transcript, and 3# NTR region. Because Tajima’s D test for the total sequence with and without intron was also not significant, this suggests that the population is evolving as predicted by infinite-site models.
The variants in the RSUS3 gene are maintained in the
population, showing excess heterozygosity relative to the number of segregating sites. Balancing selection may not influence this locus in particular but instead have an effect by maintaining genetic polymorphisms (Hedrick 2007).
Both the entire length of the RSUS3sequence and the total region excluding intron had positive Tajima’sDvalues, indicating that a deficiency in the number of low-frequency alleles in the population could be the result of a demographic process, such as a population bottleneck or subdivision
Table 5 Mean evolutionary distances within and between assigned haplotype groups
H1 H2 H3 H4 H5 H6 H7 H8 H9 H10 H11
H1(20) 0.099
H2(1) 0.227 —
H3(1) 0.158 0.136 —
H4(1) 0.153 0.202 0.095 —
H5(2) 0.189 0.228 0.138 0.094 0.036
H6(2) 0.340 0.387 0.358 0.303 0.395 0.018
H7(1) 0.533 0.449 0.549 0.515 0.599 0.168 —
H8(1) 0.607 0.409 0.571 0.537 0.621 0.187 0.134 —
H9(2) 0.654 0.460 0.603 0.565 0.660 0.370 0.334 0.276 0.096
H10(1) 0.931 1.166 0.937 0.890 1.020 0.395 0.439 0.344 0.342 —
H11(11) 0.977 0.696 0.937 0.889 1.021 0.384 0.306 0.174 0.167 0.220 0.071
H, haplotype. Parenthesis indicates the number of varieties in each haplotype. Bold numbers indicate mean distances within the haplotype.
at Seoul National University on December 13, 2011
http://jhered.oxfordjournals.org/
Ha
- - - -1 -1 -1 – -1 1 1 1 1 1 1 1 1 9 9 7 7 6 6 6 6 6 6 6 6 6 6 5 4 – 4 3 – 3 3 3 3 3 1 6 6 6 – 5 5 5 4 4 4 1 1 1 0 0 8 3 7 7 7 6 6 1 1 1 1 0 9 7 – 3 7 – 7 7 6 6 6 8 3 3 1 – 9 9 8 7 3 3 3 3 3 1 0 1 3 9 8 7 8 2 7 6 5 4 0 8 4 – 5 5 – 3 2 6 5 4 3 9 0 1 – 8 4 8 5 2 1 8 6 5
1 G C ——————————— T G G G ——— A T - A C G - T G/C G/- T A/- A/C C/T T/- A/- G - CCGTTACCTGACCA AGAATGGTATCT
— T T T T A
2 G C GGACTTATATTATG C A A A ——— A T - A C G - T G G T A A C T A G - ————————— — T T T T A 3 A C ——————————— C G G A ——— A T - A C G - T G G T A A C T A G - ————————— — T T T T A 4 A T ——————————— C G G A ——— A T - A C G - T G G T A A C T A G - ————————— — T T T T A 5 G C ——————————— C G G A ——— A T - A C A - T G G A A A C T A G - ————————— — T - - T A 6 G T ——————————— C G G G ——— - T - A C G - T G G T A A C T A G - ————————— — - T T - A 7 G C ——————————— T A A A CGTGT A T T - - G G T G G T A A C T A G - ————————— GAT T T T - A 8 G C ——————————— C A A A ——— - T - A C G - T G G T A A C T A G - ————————— — - T T - A 9 G C ——————————— C A A A ——— A - - A C G - T G G T A A C T A G - ————————— — - T T - C 10 G C ——————————— T G G G ——— A - - A C G - T G G T A A C T A A G ————————— — - T T - C 11 G C ——————————— C A A A ——— A - - A C G - C G G T A A C T A G - ————————— — - t t - c
SNPs relative to the most common sequence are indicated in boldface. A horizontal dash indicates the absence of the indicated base, insertion, or deletion from the sequence for that haplotype. A slash between SNPs indicates the alternate base exists in that haplotype, the boldface and regular letters denote the most common and inferior alleles, respectively. H: haplotype.
a
Varieties corresponding to each haplotype are: 1. Koshihikari, Gopum, Samnam, Palkong, Dongjin, Chucheong, Hwacheong, Hwaseong, Samgwang, Ilpum, Tetep, Sinkemo, Dobong, Morobereken, Sindongjin, Gyehwal, Suwin365, Heukjinju, andOryza rufipogon155 and 105; 2. Nipponbare; 3.O. rufipogon111; 4.O. rufipogon144; 5. Pat and Lemont; 6.O. rufipogon121 and 142; 7.O. rufipogon158; 8. IR21015; 9. IR64 and
O. rufipogon108; and 10. New Sabramati; 11. Dasan, Nongan, Peta, Teqing, IR36, Han-gangchal, IR72, Tadukan, Chinsurah Boro II, ARC10239, and Milyang23.
743
Lestar
i
et
al.
Haplotype
Diver
sity
of
Rice
Sucrose
Synthase
(Tajima 1989). Based on the nonsignificant results of the Tajima’sDtest, selection might not act on theRSUS3gene in cultivated rice as effectively as in wild rice. It is not in good agreement with the previously reported evolutionary analysis of theRSUS3-closely related genes, namely starch-synthesizing genes, Wx gene of nonwaxy rice (Olsen and Purugganan 2002), andSSIIa(sucrose synthase IIa) of rice (Bao et al. 2006b). In contrast, these studies reported that selection was fully detected in the Wx gene of waxy rice (Olsen and Purugganan 2002).
In addition, Fu and Li’sD* andF* tests were also used to determine whether the genealogy fits a neutral genetics model. Demographic processes can influence allele distri-bution, which can be a means of selection. Based on a significant deviation from neutrality, these demographic factors are likely responsible for the patterns of genetic variation observed in RSUS3. Statistical analysis revealed a significant difference between Fu and Li’s D* and F* values, even though there was no significance from Tajima’s Dtest for the entire sequence with or without intron. These neutrality tests (Table 4) demonstrate that the slight influence of demographic factors without artificial selection have impacted the genetic variation ofRSUS3. These results are still consistent with the conclusion ofChing et al. (2002), that a small number of haplotypes, relative to neutral expectation, is consistent with the effects of breeding-induced bottlenecks in the germplasm pool.
The single-base mutation identified in the RY repeat in theRSUS3promoter could be valuable for investigation of seed specificity among rice varieties (Figure 1). The varieties that contained this mutation predominantly belonged to one haplotype, H5. This cis-element, which provides a binding
site for one or more transacting factors, may be involved in the regulation of RSUS3 expression. Throughout both the entire sequence and in the Upstream-Downstream-Tran-script region region, the genetic diversity of RSUS3 was greater than that of both SSIIa (Bao et al. 2006b) and Isa gene (isoamylase) (Bundock and Henry 2004). The entire length of RSUS3, spanning the 5# NTR to the 3# NTR, provided complete nucleotide variability compared with the shorter consensus sequences in SSIIaandIsa. Furthermore, the nucleotide variability and frequency of SNP changes, both throughout the genome and the broader germplasm (japonica, indica, and O. rufipogon), allowed for increased detection of genetic diversity in this study. Sequence variation of RSUS3 gene between cultivated rice and wild rice is not known; in consequence, we analyzed not only cultivated rice but also wild rice accessions, which provided us a wide representation of rice varieties from countries throughout Asia. This study may be relevant to the previous reports describing nucleotide diversity between cultivated barleys and wild barleys possibly derived from predomi-nantly outcrossing on adh2 (Lin et al. 2002) and Isa gene (Bundock and Henry 2004). The information on the genetic diversity of entire length of theRSUS3gene obtained in this study is complementary to previous studies ofWxgenes of rice (Olsen and Purugganan 2002) and wild barley (Morrell et al. 2005). Study of nucleotide variation in genes of interest is useful for the exploration of genetic diversity and can be used for association mapping or inferring selection, domestication, and demographic prototype.
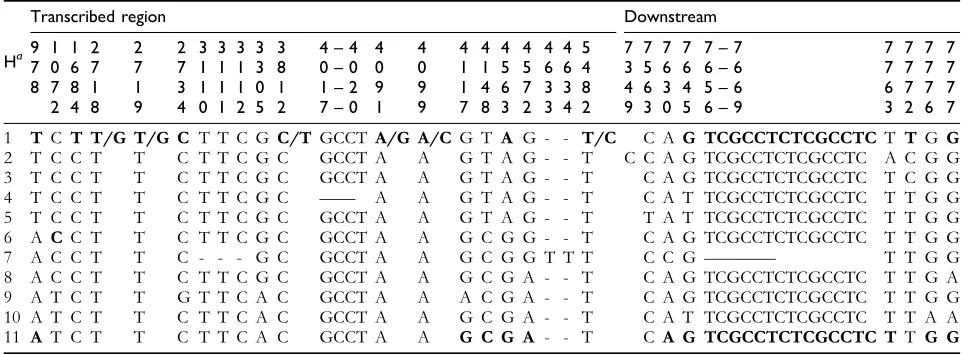
TheRSUS3nucleotide variations in the 43 analyzed rice varieties and accessions identified 11 different haplotypes, however, of the total haplotype number, 6 were represented Table 7 SNP and indel positions in the transcribed region dan downstream region ofRSUS3gene.
Ha
SNPs relative to the most common sequence are indicated in boldface. A horizontal dash indicates the absence of the indicated base, insertion, or deletion from the sequence for that haplotype. A slash between SNPs indicates the alternate base exists in that haplotype, the boldface and regular letters denote the most common and inferior alleles, respectively. H: haplotype.
a
Varieties corresponding to each haplotype are: 1. Koshihikari, Gopum, Samnam, Palkong, Dongjin, Chucheong, Hwacheong, Hwaseong, Samgwang, Ilpum, Tetep, Sinkemo, Dobong, Morobereken, Sindongjin, Gyehwa1, Suwon365, Heukjinju, andOryza rufipogon155 and 105; 2. Nipponbare; 3.O. rufipogon
111; 4.O. rufipogon144; 5. Pat and Lemont; 6.O. rufipogon121 and 142; 7.O. rufipogon158; 8. IR21015; 9. IR64 andO. rufipogon108; 10. New Sabramati; and 11. Dasan, Nongan, Peta, Teqing, IR36, Han-gangchal, IR72, Tadukan, Chinsurah Boro II, ARC10239, and Milyang23.
at Seoul National University on December 13, 2011
http://jhered.oxfordjournals.org/
by only 1 variety and 3 encompassed only 2 varieties. The presence of few haplotypes shared by multiple individuals indicated that no random assortment of SNPs occurred from one locus to another (Gupta et al. 2005; Bao et al. 2006b). This can be explained by the fact that the rice strains tested in this study were limited to 2 major cultivar groups, namelyindicaandjaponicarice and the wild rice (O. rufipogon). Accordingly, some haplotypes, such as those of the wild rice accessions, were nearly identical, whereas highly divergent RSUS3 haplotypes were found between indica and japonica varieties. This might be associated with genetic differences between the 2 evident from phenotypic characteristics, such as starch properties. In addition, there was a low mean evolutionary distance between either japonica or indica varieties and wild rice, as shown in H9 and between H4 and H5. This suggests that those varieties might belong to the same molecular evolutionary lineage. The phenomenon that all the wild Nepalese O. rufipogon accessions were homozygous atRSUS3might be due to inbreeding followed by geographical isolation. As reported by Niroula et al. (2005)that some populations ofO. rufipogon in Nepal were scattered and completely isolated away from others, accessions used in this study might undergo the similar process toward homozygosity.
The identification of nucleotide variations that exert functional effects, such as changes in the gene expression level or amino acid composition, is the primary focus of association mapping. In this study, the majority of the base substitutions in the coding region of RSUS3 were nonsynonymous substitutions. Consequently, alleles of the RSUS3gene provide a means for testing association with specific phenotypic traits by association mapping analysis. In comparison, a previous study in rice found that specific SNPs in the exon ofSSIIawere identified in some of the haplotypes, but 2 starch properties de-termined by SSIIa, were not unique to the haplotypes (Umemoto et al. 2004). Thus, the genetic diversity of RSUS3 in this study would be very useful in identifying alleles able to act as the framework for genetic association analysis, especially with regard to further increasing rice grain quality. Using a diverse selection of alleles, association genetics can identify polymorphisms that confer particular phenotypes.
Nucleotide variation is a major source of heritable phenotypic change; this high variation in theRSUS3would allow for more effective markers development and can be prospective for breeding program. Most indels and SNPs existed in noncoding region ofRSUS3and did not correspond to amino acid alteration. However, the polymorphism variation given by these markers might be prospective and useful as marker assisted selection. It was proven that one of developed marker based on the identified SNPs/indels in RSUS3was inclusive in the marker set for evaluation of eating quality of cooked japonica rice (Lestari et al. 2009). Other studies also reported marker development on the basis of nucleotide variation of starch-synthesizing genes (Bao et al. 2006a,2006b;He et al. 2006) andsucrose synthase 2(SUS2) in sugarcane (Lingle and Dyer 2004). Alleles ofSUS2were used
as a marker to dissect the contribution of SUS2to sucrose accumulation (Lingle and Dyer 2004), an ArabidopsisSusA geneAtSUS3(sucrose synthase 3) was utilized as a marker for stress defense detection (Baud et al. 2004), and the othersucrose synthase markers showed association with sugar content (da Silva and Bressiani 2005). Thus, once the relation between the alleles of specific gene/locus and phenotypic traits found, the allele polymorphisms can be easily used in rice breeding program for improved specific traits, including RSUS3. To investigate the capability of specific loci to have a major impact on specific traits, both ancient and modern plant sequences should be analyzed.
This is the first report of haplotype diversity of the RSUS3 gene from a germplasm that includes rice varieties fromindicaandjaponicatoO. rufipogon. The analysis reported here provides insight into the genetic relationship and evolutionary history of cultivated rice. From the 11 haplotypes identified in this study, the history of
re-combination at the RSUS3 locus was revealed. Of 11
recombination events, 3 occurred in the promoter region, contributing to the increase in diversity. In comparison, the recombination events undergone in the promoter of a gene that encodes alcohol dehydrogenase, Adh1, can result in a reduction in diversity (Wang et al. 1999). Therefore, the level of haplotype diversity resulting from the
recombina-tion events in the RSUS3 gene might be due to natural
selection for sequences that provide an advantage in the processes of starch filling and the seed defense (Bundock and Henry 2004).
Funding
This work was supported by a grant (No. 609001-5) from the Agricultural Research and Development Promotion Center for Agriculture and Forestry, Ministry of Agriculture and Forestry, Republic of Korea.
References
Bao JS, Corke H, Sun M. 2006a. Microsatellites, single nucleotide polymorphisms and a sequence tagged site in starch-synthesizing genes in relation to starch physicochemical properties in non-waxy rice (Oryza sativaL.). Theor Appl Genet. 113:1185–1196.
Bao JS, Corke H, Sun M. 2006b. Nucleotide diversity instarch synthase IIa
and validation of single nucleotide polymorphisms in relation to starch gelatinization temperature and other physicochemical properties in rice (Oryza sativaL.). Theor Appl Genet. 113:1171–1183.
Baud S, Vaultier MN, Rochat C. 2004. Structure and expression profile of
sucrose synthasemultigene family in Arabidopsis. J Exp Bot. 55:396–409.
Baumlein H, Nagy I, Villarroel R, Inze D, Wobus U. 1992. Cis analysis of a seed protein gene promoter: the conservative RY repeat CATGCATG within the legumin gene. Plant J. 2:233–239.
Bundock PC, Henry RJ. 2004. Single nucleotide polymorphism, haplotype diversity and recombination in theIsagene of barley. Theor Appl Genet. 109:543–551.
Ching A, Caldwell KS, Jung M, Dolan M, Smith OS, Tingey S, Morgante M, Rafalski A. 2002. SNP frequency, haplotype structure and linkage disequilibrium in elite maize inbred lines. BMC Genet. 3:1–14.
at Seoul National University on December 13, 2011
http://jhered.oxfordjournals.org/
Chopra S, Del-Favero J, Dolferus R, Jacobs M. 1992.Sucrose synthase of Arabidopsis: genomic cloning and sequence characterization. Plant Mol Biol. 18:131–134.
da Silva JA, Bressiani JA. 2005.Sucrose synthasemolecular marker associated with sugar content in elite sugarcane progeny. Genet Mol Biol. 28:294–298.
Fu YX, Li WH. 1993. Statistical test of neutrality of mutation. Genetics. 133:693–709.
Gupta PK, Rustgi S, Kulwal PL. 2005. Linkage disequilibrium and association studies in higher plants: present status and future prospects. Plant Mol Biol. 57:461–485.
He Y, Han Y, Jiang L, Xu C, Lu J, Xu M. 2006. Functional analysis of starch-synthesis genes in determining rice eating and cooking qualities. Mol Breed. 18:277–290.
Hedrick PW. 2007. Balancing selection. Curr Biol. 17:230.
Heim U, Weber H, Baumlein H, Wobus U. 1993. Asucrose synthasegene of
Vicia fabaL.: expression pattern in developing seeds in relation to starch synthesis and metabolic regulation. Plants. 191:394–401.
Hirose T, Scofield GN, Terao T. 2008. An expression analysis profile for the entiresucrose synthasegene family in rice. Plant Sci. 174:534–543.
Horst I, Welham T, Kelly S, Kanoko T, Sato S, Tabata S, Parniske M, Wang TL. 2007. TILLING mutants of Lotus japonicus reveal that nitrogen assimilation and fixation can occur in the absence of nodule-enhanced
sucrose synthase. Plant Physiol. 144:806–820.
Huang JW, Chen JT, Yu WP, Shyur LF, Wang AY, Sung HY, Lee PD, Su JC. 1996. Complete structure of three ricesucrose synthaseisogenes and differential regulation of their expressions. Biosci Biotechnol Biochem. 60:233–239.
Hudson RR, Kaplan NL. 1985. Statistical properties of the number of recombination events in the history of a sample of DNA sequences. Genetics. 111:147–164.
Kishimoto N, Akagi H, Satozawa T, Sakamoto M, Fujimura T, Higo K, Shimada H. 2001. Loci of ricesucrose synthase. In: Rice Genetics Newsletter. Kurata N, Bennett J (Eds.). Vol 18. Available from: http://www.shigen.nig.ac.jp/rice/rgn/ vol18/c16.html
Komatsu A, Moriguchi T, Koyama K, Omura M, Akihama T. 2002. Analysis of sucrose synthase gene in citrus suggests different roles and phylogenetic relationship. J Exp Bot. 53:61–71.
Kreitman ME, Hudson RR. 1991. Inferring the evolutionary histories of the
Adh and Adh-dup loci in Drosophila melanogaster from patterns of poly-morphism and divergence. Genetics. 127:565–582.
Lestari P, Ham TH, Lee HH, Woo MO, Jiang W, Chu SH, Kwon SW, Ma KH, Lee JH, Cho YC, et al. 2009. PCR marker-based evaluation of the eating quality ofjaponicarice (Oryza sativaL.). J Agric Food Chem. 57:2754–2762.
Lin JZ, Morrell PL, Clegg MT. 2002. The influence of linkage and inbreeding on patterns of nucleotide sequence diversity at duplicate alcohol dehydrogenase loci in wild barley (Hordeum vulgaresub-speciesspontaneum). Genetics. 162:2007–2015.
Lingle SE, Dyer DM. 2004. Polymorphism in the promoter region of the
sucrose synthase-2gene ofSaccharumgenotypes. J Am Soc Sugar Cane Technol. 24:241–249.
Morrell PL, Toleno DM, Lundy KE, Clegg MT. 2005. Low. levels of linkage disequilibrium in wild barley (Hordeum vulgare ssp. Spontaneum) despite high rate of self-fertilization. Proc Natl Acad Sci U S A. 102: 2442–2447.
Murray MG, Thompson WF. 1980. Rapid isolation of high molecular weight DNA. Nucleic Acids Res. 8:4321–4325.
Nei M. 1987. Molecular evolutionary genetics. New York: Columbia University Press.
Niroula RJ, Subedi LP, Sharma RC, Upadhyaya M. 2005. Ploidy level and phenotypic dissection of Nepalese wild species or rice. Sci World. 3:78–84.
Olsen KM, Purugganan MD. 2002. Molecular evidence on the origin and evolution of glutinous rice. Genetics. 162:941–950.
Rasmussen TB, Donaldson IA. 2006. Investigation of the endosperm-specificsucrose synthase promoter from rice using transient expression of reporter genes in guar seed tissue. Plant Cell Rep. 25:1035–1042.
Rozas J, Rozas R. 1997. DNASP version 2.0: a novel software package for extensive molecular population genetic analysis. Comput Appl Biosci. 13:307–311.
Rozen S, Skaletsky HJ. 2000. Primer3 on the WWW for general users and for biologist programmers. Methods Mol Biol. 132:365–386.
Sambrook J, Russell DW. 2001. Molecular cloning: a laboratory manual. New York: Cold Spring Harbor Laboratory Press.
Simpson GG, Filipowics W. 1996. Splicing of precursors to mRNA in higher plants: mechanism, regulation and sub-nuclear organization of the spliceosomal machinery. Plant Mol Biol. 32:2–41.
Syvanen AC. 2001. Accessing genetic variation: genotyping single nucleotide polymorphisms. Nat Rev Genet. 2:930–942.
Tajima F. 1989. Statistical method for testing the neutral mutation hypothesis by DNA polymorphism. Genetics. 123:585–595.
Tamura K, Dudley J, Nei M, Kumar S. 2007. MEGA4: Molecular Evolutionary Genetics Analysis (MEGA) software version 4.0. Mol Biol Evol. 24:1596–1599.
Umemoto T, Aoki N, Lin HX, Nakamura Y, Inouchi N, Sato Y, Yano M, Hirabayashi H, Maruyama S. 2004. Natural variation in ricestarch synthase IIa
affects enzymes and starch properties. Funct Plant Biol. 31:671–684.
Wall JD, Hudson RR. 2001. Coalescent simulation and statistical test of neutrality. Mol Biol Evol. 18:1132–1135.
Wang AY, Kao MH, Yang WH, Sayion Y, Liu LF, Lee PD, Su JC. 1999. Differentially and developmentally regulated expression of three ricesucrose synthasegenes. Plant Cell Phyisol. 40:800–807.
Wang AY, Yu WP, Juang RH, Huang JW, Sung HY, Su JC. 1992. Presence of three ricesucrose synthasegenes as revealed by cloning and sequencing of cDNA. Plant Mol Biol. 18:1191–1194.
Received December 23, 2010; Revised August 3, 2011; Accepted August 8, 2011
Corresponding Editor: Perry Gustafson
at Seoul National University on December 13, 2011
http://jhered.oxfordjournals.org/