THE JOURNAL OF TROPICAL LIFE SCIENCE OPEN ACCESS Freely available online
VOL. 6, NO. 3, pp. 219 - 226, September, 2016 Submitted October 2015; Revised February 2016; Accepted July 2016
The Effect of Artemisin Combined with Moringa oleifera Leaf Extract on CD4+ and CD8+
Percentage of Mice Infected with Plasmodium berghei
Melda Fio Flora BR. Sijabat1
, Tinny Endang Hernowati2, 3
*, Loeki Enggar Fitri4
1
Biomedical Science Magister Program, the Faculty of Medicine, Brawijaya University, Malang, Indonesia 2
Departement of Clinical Pathology, dr. Saiful Anwar Public Hospital, Malang, Indonesia 3
Departement of Clinical Pathology, Faculty of Medicine, Brawijaya University, Malang, Indonesia 4Departement of Parasitology, Faculty of Medicine, Brawijaya University, Malang, Indonesia
ABSTRACT
The study aims to determine the effect of Artimisin and Moringa oliefera leaf extract combination on CD4+ and CD8+ T cells percentage of mice infected with Plasmodium berghei. Both of which have a role in the elimination of intracellular Plasmodium parasites that cause malaria. Artemisin, the effective anti-malaria, kills the Plasmodium parasite through its free radicals. However, free radicals can damage immune cells such as CD4+ and CD8+ T cells, and as the M. oleifera leaves contain the bioactive flavanoids quercetin and kaempferol, both being strong anti-oxidant and anti-inflamatory agents, it is hoped that they will reduce these negative effects. A post test group experimental design was employed on 6 groups of mice, 4 groups of mice infected with P. berghei, and then each administered 0.004mg/gBW Artemisin (A), a combination of Artemisin 0.004 mg/gmBW in 0.125 mg/gBW (DK1), 0.250 mg/gBW (DK2) and 0.500 mg/gBW (DK3) of M. oleifera leaf extract, and 2 control groups of mice, one group of normal mice and another untreated group infected with P. berghei. Blood samples were collected randomly from each group on days 3 and 7, parasitemia levels were then calculated microscopically at 1000 × and the percentage of CD4+ and CD8+ T cells were obtained through flowcytometry. The results indicated that the combination of Artemisin and M. oleifera leaf extract over 7 days increased the percentage of CD4+ T cells for the DK2 group by p = 0.001 and the DK3 group by p = 0.000 and reduced parasitemia levels by p = 0.000 in DK1, DK2 and DK3 respectively, whereas, levels of CD8+ T cells did not rise. And the combination did have an effect on parasitemia levels in the treated groups (p = 0.000) and the percentage of CD4+ T cells (p = 0.000) but not on that for CD8+ T cells.
Keywords: Parasitemia, CD4+ and CD8+ T cells, Moringa oleifera
Malaria is a deadly intracellular disease caused by the parasite Plasmodium [1]. The five strains of plas-modium that most frequently infect humans are Plas-modium falciparum, PlasPlas-modium vivax, PlasPlas-modium ovale, Plasmodium malaria and Plasmodium knowlesi and all these strains are carried by the Anopheles mos-quito females who then bite and infect humans [2].
The main actors in the human immune response to malaria are CD4+ and CD8+ T cells. CD4+ T cells act to eliminate intraerythrocytes parasites, to regulate
cel-lular and humoral immune activity and to induct CD8+ T cells through interferon and it these cells who play the major part in attacking these intrahepatic par-asite [2,3]. P. falciparum and P. vivax infections induce significant falls in absolute T CD4+ T CD8+ cell and lymphocytes levels [3,4].
The standard anti malarial drug Artemisin works by killing malarial parasites through the free radicals it contains formed by the molecular interaction of its en-doperoxide and Fe2+
Departement of Clinical Pathology, Faculty of Medicine, Brawijaya University
Jalan Veteran, Malang 65145, Indonesia E-mail address: [email protected]
How to cite:
fected with P.berghei in order to observe the pathogen-esis of malaria in these animals that mimics that in hu-mans.
Research design
A post test control groups design was employed in this research.
Sample collection and treatment
This study used healthy and active male Balb/c mice of between 6 and 8 weeks old weighing from 20 – 40 gms obtained from Vetenaria Farma, Surabaya. Prior to the commencement of the experiments, ap-proval was received from Ethics Committee of Faculty of Medicine, Brawijaya University.
There were 36 subjects mice which were divided into 6 groups : (1) A negative control group of normal untreated mice (KN), (2) A positive (infected) control group but untreated (KP), and 4 groups infected with P.berghei and treated with: a) Artemisin only 0.004 mg/gBW (A), and combination doses of Artemisin 0.004 mg/gBW with 0.125 mg/gBW Moringa oleifera leaf extract (DK1), 0.250 mg/gBW leaf extract (DK2) and 0.0500 mg/gBW leaf extract (DK3). On days 3 and 7 of treatment, 3 mice were selected randomly from each group and had their parasitemia levels determined microscopically at 1000×, their CD4+ and CD8+ T cell percentage were calculated by using flowcytometry
The inoculation with Plasmodium berghei
The P. berghei for inoculate was obtained from Biomedical Laboratory of Faculty of Medicine, Brawi-jaya University. 0.2 mL of mice blood containing ery-throcytes infected with 1 × 10⁶
P. berghei parasites were inoculated intraperitoneally [5]. The parasitemia levels per 1000 erythrocytes in infected mice were counted using a binocular microscope and a Giemsa dye [1, 5].
The Moringa oleifera extraction process
Leaves from Nusa Tenggara Timur variety of M.
First 1 mL of blood was taken from the heart of each mice and their mononuclear cells were extracted. Then, the mononuclear cells were cleaned in a Phos-phate Buffered Saline Solution (PBSS) and dyed with CD4 and CD8 antibodies for 3 minutes at 4°C, after that the mononuclear cells (106 cells/mL) were incu-bated with specific mouse CD4 and CD8 monoclonal antibodies. Analysis was done by flowcytometer em-ploying a BD FACS caliber 3 colour flowcytometer per 10,000 leukocytes (4).
Data analysis
Statistical analysis on the data for parasitemia lev-els, CD4+ and CD8+ T cells percentage were done by employing a SPSS 17 programme for Windows soft-ware. In order to analyze different in parasitemia levels, CD4+ and CD8+ T cells percentage in each group be-tween days 3 and 7, paired t- tests were used, whereas, to determine the differences between groups a one-way ANOVA test was utilized. The relationship between the various combinations of Artemisin and the Moringa oleifera leaf extract to parasitemia levels, CD4+ and CD8+ T cells percentage were obtained through a Pearson correlation test. The results were considered significant if they reached p < 0.05.
The differences of parasitemia levels
An analysis of the results from the differing in par-asitemia levels between the samples taken on Day 3 and those taken on Day 7 from each group (except for the negative control group) indicated a significant rise in the KP group (p = 0.031), and a significant in the Artemisin only group of p = 0.21, in the DK2 group the drop was p = 0.004 and for DK3 p = 0.000. The dif-ferences in the findings for parasitemia levels between Day-3 and Day-7 are shown in Figure 1.
The results of the Kruskal Wallis tests on the differ-ence in parasitemia levels between groups on Day-3 used a post hoc Mann Whitney test indicated that there was a difference in parasitemi a levels between
groups, namely, that the level for the Artemisin only group was lower than that for positive control group (no treatment) with p= 0.049, however, it was higher than that of the groups treated with an Artemisin and M. oleifera leaf extract where for DK1, DK2 and DK3 p= 0.049 respectively. The results the One Way ANOVA Test on the differences in parasitemia levels between groups on Day-7 employed a post hoc Tukey analysis, which revealed that there was indeed a
differ-ence in parasitemia levels between groups, that the lev-els in the Artemisin only group where p= 0.000, al-though it was still higher than those respectively. The differences in parasitemia levels groups on Day-3 and Day-7 are laid out in Figure 2.
The results of this study demonstrate that the ad-ministration of Artemisin in doses of 0.004 mL/gBW/day for 7 days was able to reduce parasitemia levels [5, 14] with an inhibition concentration (IC50)
JTLS | J. Trop. Life. Science 220 Volume 6 | Number 3 | September | 2016
Figure 1. Differences in parasitemia levels between day-3 and day-7. In the positive control group (untreated infected mice) there was a significant increase in parasitemia levels (p = 0.031), whereas the group receiving Artemisin only recorded a significant decreased (p = 0.021), and this was also true for the DK2 (p= 0.004) and the DK3 groups (p = 0.000). However, in the DK1 group there was no significant difference (p = 0.050). A value of p < 0.05 was considered to be significant. The differences between the positive control group, the Artemisin only group and for the DK2 and DK3 groups were calculated via an unpaired t-test and the DK1 group a differential Mann Whitney test. All resuts were mean standard deviations.
Figure 2. The difference in parasitemia levels between the groups on day-3 and day-7. The differences in the reading obtained on these days indicated a significant variation in each group’s readings (a significance value of p < 0.05), whereas, readings of the same value demonstrated that there was no significant difference (p > 0.05) on day-3. Also the parasitemia levels of the Artemisin only group were lower than those of the Positive control group (p= 0.049) but higher than those of the DK1 (p = 0.049), DK2 (p = 0.049), and DK3 (p = 0.049) groups. Furthermore, on day-7, the parasitemia levels of Artemisin only group were lower than those of the Positive control group (p= 0.000), yet they were higher than those of the DK1 (p = 0.000), DK2 (p = 0.000), and DK3 (p = 0.000) combination groups. The lowest parasitemia levels on day-7 were found in the DK3 group (Artemisin 0.004 mg/gBW and 0.500 mg/gBW M. oleifera leaf extract).
in the Artemisin only group than those in the groups receiving the combination therapy. This study also confirmed that there was a relationship between Artemisin with the M. oleifera extract combination and parasitemia levels. The Pearson correlation test results for the samples collected on Day-3 showed that there was a negative correlation with coefficient correlation value of –0.834 (p= 0.002), in addition, a Spearman correlation test result on Day-7 found a negative corre-lation with coefficient correcorre-lation value of -0.968 (p = 0.000). This negative correlation indicates that the higher the combination dose, the lower the parasitemia levels and visa versa. Furthermore, this research discov-ered that the lowest parasitemia level was obtained in the group that was administered the highest doses of the Artemisin and M. oleifera leaf extract combination, i.e., DK3, with doses of 0.004 mL/gBW Artemisin and 0.500 mg/gBW/day M. oleifera leaf extract.
The differences of CD4+ T cells percentage
Analysis of the differences in CD4+ T cells percent-age between day-3 and day-7 indicated a significant de-crease in the KP (p= 0.017), but a significant inde-crease in the Artemisin only group (p= 0.032) as well as in the DK1 (p= 0.032), and DK2 (p= 0.011) groups, whereas, in the DK3 there was no significant difference (p= 0.051). The differences CD4+ T cells percentage between day-3 and day-7 are shown in Figure 3.
The results of a one-way ANOVA test on CD4+ T cells percentage on day-3 showed that there was a sig-nificant difference between groups. The results of an analysis from a post hoc Tukey tests showed that the CD4+ T cells percentage from the Artemisin only group were not significantly different from those from the KP (p = 0.268) but lower compared to those from DK1 (p = 0.007), DK2 (p = 0.000), and DK3 (p = 0.000) groups. On day 7, CD4+ T cells percentage in the Artemisin only group were higher than those in the KP group (p= 0.002), whereas, they were still lower than those found in the DK2 (p = 0.001) and DK3 (p = 0.000) groups, yet, there was no significant difference
such as monocytes/ macrophages which went on to in-terfere with phagocyte function. In addition, hemozoin also inhibits cell immune response to IFN-γ and thus in CD4+ T cells activity. Furthermore, Dogruman et. al (2009) discovered that CD4+ T lymphocyte count in malaria infected mice were also lower [5].
with p=0.000 and in day 3 it was 0.961 and p=0.000) on day 7. This correlation indicates that the higher the doses of Artemisin-M. oleifera leaf extract combination, the higher the CD4+ T cells percentage and visa versa. In this research, the highest CD4+ T cells percentage were found in the group receiving the highest doses of the M. oleifera combination, namely, DK3 (Artemisin 0.004 mg/gBW and 0.500 mg/g/gBW/day M. oleifera leaf extract).
The differences of CD8+ T cells percentage
Analyses of the differences in CD8+ T cell levels between those for Day-3 and Day-7 between each group indicate that there was a significant drop in the Artemisin only group (p = 0.022) and for the DK1 combination it was p = 0.047, whereas for the others (DK2 and DK3) there was no significant difference where p = 0.067, p = 0.746 and p = 0.807 respectively, as laid out in Figure 5.
JTLS | J. Trop. Life. Science 220 Volume 6 | Number 3 | September | 2016
Figure 3. The differences in CD4+ T cells percentage between day-3 and day-7. In the Positive control group there was a significant fall in CD4+ T cells percentage (p= 0.017), whereas, in the Artemisin only group there was a significant rise (p= 0.032) as well as in the DK1 (p= 0.032) and DK2 (p= 0.011) groups. However, for the DK3 group there was no significant difference (p= 0.052). The significance value was p<0.05. All group results were analyzed by paired T-tests. The results were mean + standard deviation.
Figure 4. The differences in CD4+ T cells percentage between groups for days 3 and 7. The variations in the figures for the above days indicates there were significant differences in these cell percentages (p < 0.05 being a significant value), on the other hand, results with the same figures for individual counts show there were no significant differences (p > 0.05). On day-3, the CD4+ T cells levels in the Artemisin only group were not significantly different from those in the positive control group (p = 0.268), but they were lower than those of DK1 (p = 0.007), DK2 (p = 0.000) and DK3 (p = 0.000) groups. On day-7, CD4+ T cells percentage rise in the Artemisin only group and became higher than those from the positive control group (p= 0.002), yet they were lower than those from the DK2 (p= 0.001 and DK3 groups (p = 0.000). The highest CD4+ T cells percentage were from day-7 in the DK3 group, the group that received the highest doses of Artemisin and M. oleifera leaf extract combination.
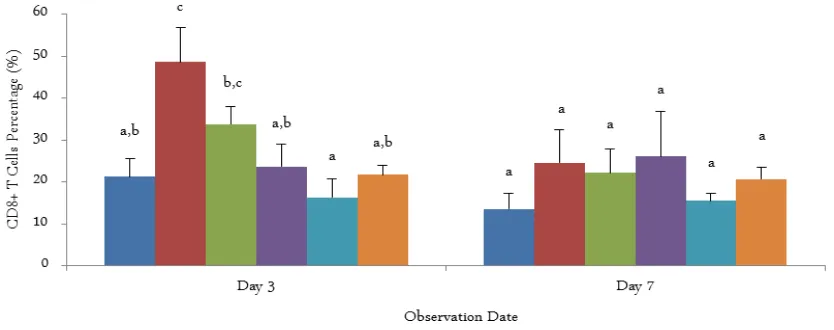
The results of the One-Way ANOVA test for CD8+ T cell percentage on Day-3 show that there was a sig-nificant difference in levels between groups. The results of the post hoc Tukey test revealed that the CD8+ T cell percentage for the Artemisin only group were higher than those of the positive control group (p = 0.001) and for DK2 it was p = 0.002, DK3 p = 0.000 and for the Negative control group p= 0.100. The re-sults of the One-Way ANOVA test for CD8+ T cell percentage differences between groups on Day-7 showed that a significant difference of p = 0.147. Those differences are shown in Figure 6.
The Pearson correlation test analysis between the Artemisin with the M. oleifera leaf extract combination and CD8+ T cells percentage on Day-3 found a nega-tive correlation with a correlation coefficient value of -0.920 (p = 0.000). This negative correlation indicates that the higher the doses of the Artemisin and Moringa oleifera leaf extract combination, the lower the percent-age of CD8+ T cells and visa versa, whereas, the results of the Spearman correlation test on Day-7 showed that there was a significant relationship (p = 0.082). How-ever, the highest percentage of CD8+ T cells on Day-3 were found in the Artemisin only group which is possi-bly due to CD8+ T cell immune activity in the early Figure 5. The differences in CD4+ T cells percentage between day-3 and day-7. In the Positive control group there was a significant fall in CD4+ T cells percentage (p = 0.017), whereas, in the Artemisin only group there was a significant rise (p = 0.032) as well as in the DK1 (p = 0.032) and DK2 (p = 0.011) groups. However, for the DK3 group there was no significant difference (p = 0.052). The significance value was p<0.05. All group results were analyzed by paired T-tests. The results were mean + standard deviation.
stages on the Plasmodium infection, while parasitemia levels were still high [17, 21]. The high percentage of CD8+ T cells on Day-3 in the Artemisin only group compared to the that of the combination treatment groups could have been caused by a disturbance in the IFN-γ response when activating the CD8+ T cells to function as intrahepatocyte phagositosis [13, 16]. In addition, CD8+ T cells percentage in the Positive con-trol group were the lowest of all the groups. This demonstrates that while the Plasmodium infection lasted, there was a drop in CD8+ T cell percentage [4], and where parasitemia levels from the Positive control group (infected no treatment).
Based on the above data, it is clear that the combi-nation Artemisin with M. oleifera leaf extract by day-7 had produced lower levels of parasitemia and higher percentage of CD4+ T cells than those from the Artemisin only group. Furthermore, there was a nega-tive correlation between the Artemisin with the M. oleifera leaf extract combination and parasitemia levels. A positive correlation between the Artemisin with the M. oleifera leaf extract combination on CD4+ T cells percentage. Whereas, for the CD8+ T cell percentage there was no significant difference between the Artemisin only group and the Artemisin and M. oleifera leaf extract combination groups.
This research found that the combination of Artemisin and M. oleifera leaf extract over 7 days in-creased the percentage of CD4+ T cells for the DK2 group by p=0.001 and the DK3 group by p=0.000 and reduced parasitemia levels by p=0.000 in DK1, DK2 and DK3 respectively, whereas, levels of CD8+ T cells did not rise. And the combination did have an effect on parasitemia levels in the treated groups (p=0.000) and the percentage of CD4+ T cells (p=0.000) but not on that for CD8+ T cells.
The writer wishes to convey her thanks to Mrs. Diana Wicaksono for her excellent assistance with statistics, the Parasitology, Biomedical, Pharmacology, and Physiology Laboratories as well dr. Saiful Anwar Central Laboratory for all their help for this study.
1. WHO. World Malaria Report 2011.
2. Erdman LK (2011) Host Inflammatory Pathways in Malaria Infection: Potential Therapeutic Targets and Biomarkers of Disease Severity. Doctor of Philosophy,
University of Toronto 236-306.
3. Kassa D, Petros B, Mesele T et al (2006) Characterization of Peripheral Blood Lymphocyte Subsets in Patients with Acute Plasmodium falciparum and P. vivax Malaria Plasmodium berghei. New Microbiologica. 32: 285-291. 5. Roihatul M (2010) Aktivitas Antimalaria ekstrak Batang
Talikuning (Anamirta cocculus) dan Kombinasinya dengan Artemisin pada Mencit yang diinfeksi Plasmodium berghei. Pascasarjana, Universitas Brawijaya Malang.
6. Hadzic T (2005) Malaria and Reactive Oxgygen Species: The Dance of Death. Departement of Pathology. Iowa Medicinal Values of Moringa oleifera Leaves from Sub-Saharan Africa : Ghana, Rwanda, Senegal and Zambia. Master of Science, The State University of New Jersey. 9. Kasolo JN, Bomenya GS, Ojok L, Ochieng J,
Ogwal-Okeng JW (2010) Phytochemicals and uses of Moringa oleifera leaves in Ugandan rural communities. Journal of Medicinal Plants Research 4 (9): 753-755.
10. Goyal BR, Agrawal BG, Goyal RK, Metha AA (2007) Phyto-pharmacology of Moringa oleifera lam. Natural Product Radiance 6: 347-353.
11. Siddhuraju P, Becker K (2003) Antioxidant properties of various extracts of total phenolic constituens from three different agriclimatic origins of drumstick tree (Moringa oleifera lam.) leaves. J. Agric. Food Chem. 51: 2144-2155. 12. Schmidt (2011) Induction of pro-inflammatory mediators
in Plasmodium berghei infected BALB/c mice breaks blood-brain-barrier and leads to cerebral malaria in an IL-12 dependent manner. Microbes and Infection 13 (10): 828-36.
13. White NJ, Breman JG (2008) Malaria and Babeosis: Diseases Caused by Red Blood Cell Parasites. In: Kasper, D. L., Fauci, A. S., Dan L. Longo, M., Braunwald, E., Hauser, S. L. & Jameson, J. L. (eds.) Harrison's Principal of Internal Medicine. 16th ed. New York, Chicago: McGraw-Hill..
14. Sudha, Asdaq SMB, Sunil D, Chandrakala GK (2007) Immunomodulatory Activity Of Methanolic Leaf Extract of Moringa Oleifera Animals. Indian J Physiol Pharmacol.
JTLS | J. Trop. Life. Science 220 Volume 6 | Number 3 | September | 2016
ACKNOWLEDGMENT
REFERENCES CONCLUSION
oleirefa Leaves: Immunomodulation in Winstar Albino Rats. International Journal of Pharmaceutical Sciences 3 (5): 426-430.
18. Jung JH, Kang JI, Kim HS (2012) Effect of Quercetin on impaired function in mice exposed to irradiation. Nutrition Research and Practice 6 (4): 301-307.
Parasites In Rats. Parasite Journal 10: 1051-1053. 22. Banji OJF, Banji D, Kavitha R (2012) Immunomodulatory