Performance Evaluation of Tuntang Watershed based on Quantity
and Quality of Water
Ugro Hari Murtiono* and Paimin
Research Institute for Forestry Technology on Watershed Management (BPTKP DAS Solo) -O-HQG$<DQL3DEHODQ6XUDNDUWD7HOS
*) Corresponding author (e-mail: [email protected])
Abstract.7KHREMHFWLYHRIWKHVWXG\ZDVWRHYDOXDWHWKHSHUIRUPDQFHRI7XQWDQJ&DWFKPHQW
EDVHGRQZDWHUTXDQWLW\DQGTXDOLW\DUHDUDQJLQJIURPLWVXSVWUHDPWRGRZQVWUHDP7KHPHWKRG XVHGWRGHWHUPLQHWKHZDWHUTXDQWLW\ZDVE\FDUU\LQJRXWJURXQGVWXG\RQZDWHUGLVFKDUJH LQWKHGU\VHDVRQ-XQHLQWKHUHVHDUFKVLWHZKLOHWKHZDWHUTXDOLW\ZDVGHWHUPLQHGE\ FRQGXFWLQJDODERUDWRU\DQDO\VLVRQWKHVDPSOHVREWDLQHGIURPWKHVLWHVLQERWKWKHUDLQ\DQG GU\VHDVRQ-DQXDU\DQG-XQH7KHUHVXOWVLQGLFDWHGWKDWWKHTXDQWLW\RIZDWHUGLVFKDUJH LQ 7XQWDQJ 5LYHU ZDV FDWHJRUL]HG ´JRRGµ DOWKRXJK LW ZDV XWLOL]HG IRU PDQ\ XVHV VXFK DV LUULJDWLRQK\GURSRZHUDQGGULQNLQJZDWHU0RVWRIZDWHUGLVFKDUJHVZHUHPDLQO\VXSSOLHG IURPWKHXSVWUHDPRI5DZD3HQLQJ/DNH7KHZDWHUTXDOLW\GHWHUPLQHGIURPWKHSDUDPHWHUVRI WRWDOGLVVROYHGVROLGVFRQGXFWLYLW\S+SKRVSKDWHDQGQLWUDWHFRXOGEHFODVVLÀHGDV´JRRGµ PHDQZKLOHWKHWXUELGLW\DQGGLVVROYHGR[\JHQZHUHFODVVLÀHGDV´SRRUµ
Keywords:ZDWHUTXDQWLW\ZDWHUTXDOLW\VSHFLÀFPLQLPXPGLVFKDUJH
Abstrak. 7XMXDQ SHQHOLWLDQ XQWXN PHQJHYDOXDVL SHUIRUPD '$6 7XQWDQJ GLXNXU GDUL
kuantitas GDQNXDOLWDVDLUVXQJDLEDLNGLEDJLDQKXOXPDXSXQKLOLU0HWRGH\DQJGLJXQDNDQ XQWXNPHQJHWDKXLNXDQWLWDVDLUGHQJDQSHQJXNXUDQDOLUDQDLUVXQJDLSDGDPXVLPNHPDUDX -XQLSDGDORNDVL\DQJGLSLOLKVHGDQJNDQNXDOLWDVDLUGLODNXNDQGHQJDQFDUDSHQJDPELODQ FRQWRKDLUSDGDVXQJDLVXQJDL\DQJPDVXNNHGDQDXUDZDSHQLQJSDGDZDNWXPXVLPKXMDQ GDQ NHPDUDX -DQXDUL GDQ -XQL NHPXGLDQ GLDQDOLVD GL ODERUDWRULXP +DVLO SHQHOLWLDQ GLLQGLNDVLNDQEDKZDNXDQWLWDVGHELWDLUGLVXQJDL7XQWDQJEHUDGDSDGDNDWHJRUL¶EDLNµZDODXSXQ DLU\DQJNHOXDUGDULGDQDXUDZDSHQLQJWHODKGLPDQIDDWNDQXQWXNEHUEDJDLNHSHQWLQJDQVHSHUWL LULJDVLKLGURHOHFWULNGDQDLUPLQXP6HEDJLDQEHVDUGHELWDLUWHUXWDPDGLVXSSRUWGDULKXOX '$65DZD3HQLQJ3DUDPHWHUNXDOLWDVDLUVHSHUWLWRWDOSDGDWDQWHUODUXW7'6GD\DKDQWDU OLVWULN'+/S+SKRVSKDWGDQQLWUDWGLNDWDJRULNDQ´EDLNµVHEDOLNQ\DNHNHUXKDQGDQRNVLJHQ WHUODUXW'2GLNODVVLÀNDVLNDQ´MHOHNµ
Kata Kunci : .XDQWLWDVNXDOLWDVDLUVXQJDLGHELWPLQLPXPVSHVLÀN
1. Introduction
:DWHU LV D EDVLF UHTXLUHPHQW IRU WKH
survival of living beings, including human, animal, and vegetation. However, the water resource availability is increasingly limited within time and space. In Indonesia, the diversity of water resources availability is high based on the area. Java, for instance, is monsoon region with obvious di erence between rainy and dry season, the region adjacent to the equator has indistinct di erences, and while in Nusa Tenggara is semi arid regions with low rainfall. Although Indonesia has abundant water resources, yet the scarcity of water and water resources become a
The discharge of a watershed in the dry
VHDVRQ FDQ EH DQ LQGLFDWRU RI WKH TXDQWLW\
and continuity level of a watershed’s water
VXSSO\ 0HDQZKLOH WKH ZDWHU TXDOLW\ LQ
the rainy and dry season can be an indicator
RIZDWHUTXDOLW\RIDZDWHUVKHGRUDFDWFKPHQW
area.
In fact, watershed is a crucial reserve and water supply for many usages such as irrigation, agricultural, industrial, and household consumption. Additionally, watershed captures rainwater to control
GDPDJLQJ ÁRRGV GURXJKW VRLO HURVLRQ DQG VHGLPHQWDWLRQ$UWLÀFLDOVXUIDFHZDWHUVWRUDJH
such as dams and natural storage such as lakes will be able to provide a continuous water supply in the dry season. One of the lakes in the watershed is Lake Rawa Pening in Tuntang watershed. This lake is absolutely a natural means for further various uses of watershed. Rawa Pening Lake is located in the upstream of Tuntang watershed and has a primary role. This study aimed to evaluate the performance
RI 7XQWDQJ ZDWHUVKHG EDVHG RQ WKH TXDQWLW\ DQGTXDOLW\RIZDWHUDQGSRWHQWLDOLPSOLFDWLRQ
to Rawa Pening Lake sustainability.
2. Research Method a. Materials and Tools
Materials and tools used in this study were basic maps (topography, soil, geology, and land-cover/use), Rupa Bumi Indonesia (RBI) maps, Currentmeter, suspendedloadsampler USDH48, sample bottles, measurement blank
forms, sediment, stationeries and computer
VRIWZDUHDQGÀHOGVWXG\HTXLSPHQWV
b. Location
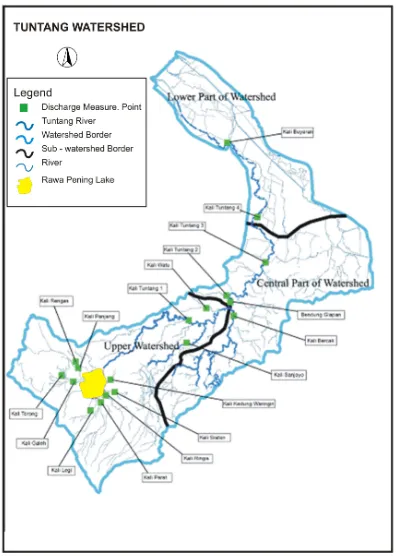
Research was carried out in Tuntang watershed, Central Java, which was divided into three sub-watersheds, namely, Tuntang Hulu watershed, Tuntang Tengah sub-watershed, Tuntang Hilir sub-watershed (Figure 1). Lake Rawa Pening is a part of the downstream of Tuntang Hulu sub-watershed. With total area of 2,300 hectares, Lake Rawa Pening which is located in the upstream of Tuntang sub-watershed, Semarang Regency, is vital with its central function as the water source for household and industrial (local government-owned water companies), irrigation
IRU KD RI SDGG\ÀHOGV ÀVKHU\ ZLWK
production of 1,535.9 ton/year, tourism, livestock, peat mining, and hydropower in Jelok and Timo which generate 222.504 million Kwh (%DSSHGD Provensi Jawa Tengah, 2005).
Catchment area of Tuntang Hulu is affected by the volcanic characteristics of Mount Merbabu (East and Southeast), Mount Telomoyo (South), and Mount Ungaran (West). The west part of Tuntang Tengah sub-watershed is affected by Volcano Ungaran while the east part is affected by mixed limestone sedimentary rocks. In addition, Tuntang Hilir
VXEZDWHUVKHGLVDVXVFHSWLEOHPXGÁDWDUHD
c. Measurement of Water Discharge
Quantitative measurement of water discharge in Tuntang watershed was carried out in the dry season, while sampling for
ZDWHU TXDOLW\ TXDOLWDWLYHO\ ZDV GRQH LQ WKH
rainy and dry season. Measurements were performed in several points as illustrated
LQ )LJXUH LQ -XQH 7KH TXDOLWDWLYH
discharge measurement in Tuntang Hulu
sub-ZDWHUVKHG ZDV FDUULHG RXW LQ HDFK LQÁRZ WR
Lake Rawa Pening including 9 (nine) rivers: (1) Kedungwringin River, (2) Ringis River, (3) Sraten River, (4) Parat River, (5) Legi River,
*DOHK5LYHU7RURQJ5LYHU3DQMDQJ
River, and (9) Rengas River. In addition, in Tuntang Hulu sub-watershed, measurement was conducted at the downstream of Lake Rawa Pening namely, Tuntang Main River (Tuntang 1), Sanjoyo River, Watu River, and Bercak River. In Tuntang Tengah sub-watershed, measurement was carried out in Tuntang Main River (Tuntang 2 and Tuntang 3) and Glapan Dam (West and East outlet). In Tuntang Hilir sub-watershed, measurement was carried out in Tuntang 4 (adjacent to Grobogan district and Demak district) and Buyaran River.
Discharge measurement involved the measurement of discharge rate and the cross-section area. The cross-cross-section area is divided into six sections. Discharge rate or velocity was measured by currentmeter on each section (in the middle of the section) and the dimension (depth and width) of each section was measured to obtain the discharge cross-section area. In examining the discharge velocity, currentmeter was planted in a depth of 0.6 from the surface of the water for the discharge of <
cm water depth; in a depth of 0.2 and 0.8 for the discharge of 60 100 cm water depth; and in a
depth of 0.2, 0.6, and 0.8 for the discharge of >100 cm water depth. The produce of discharge rate and cross section area was the discharge of the section. Total discharge of all sections was the observed water discharge. The value of water discharge (m3/sec) was converted into a unit of speci c water discharge (m3/s/km2).
2EVHUYDWLRQ RQ ZDWHU TXDOLW\ ZDV FRQGXFWHG LQ WKH ULYHUVLQÁRZV RI /DNH
Rawa Pening, Tuntang Hulu sub-watershed, and measurement point in the downstream (Buyaran River), Tuntang Hilir sub-watershed.
6DPSOHZDVREWDLQHGIRUZDWHUTXDOLW\DQDO\VLV
was withdrawn in the rainy season (January 2011) and the dry season (June 2011).
d. Data Analysis
The value of water discharge is stated
LQ VSHFLÀF GLVFKDUJH XQLW P3/sec/km2) by dividing the water discharge with its catchment area (km2 %DVHG RQ .RUL
VSHFLÀF GLVFKDUJH P3/sec/km2 LV FODVVLÀHG as: 1). <0.015 = poor; 2). 0.015 – 0.21 = good; 3). >0.21 = very good. From the measurement of the GLVFKDUJH WKH TXDQWLWDWLYHhydrological condition of an area could be determined based on the classi cation.
:DWHU TXDOLW\ LV WKHquality of water that meets the standards for a particular purpose. Terms are de ned as a variety of quality standards in accordance to the intended purpose. Directorate General of Land Rehabilitation and ocial Forestry, Ministry of Forestry, 2009, published the category and value for the assessment on the indicators of pollutant content level including the physical, chemical, and biological pollutant as presented in Table 1. These indicators were used as the analytical basis.
Table1.
No Parameter of Water Quality Value Category
A. Physical
1. Total Dissolved Solids(mg/lt)
< 1000 1001 – 2000 >2000
Good Moderate Poor
2. Turbidity (NTU)
< 5 5 - 25 >25
Good Moderate Poor
B. Chemical
1. Electrical Conductivity(mhos/cm)
< 500 500 – 2000 >2000
No Parameter of Water Quality Value Category
2. Acidity (pH)
²
²RU²
<5.5 or >8.5
Good Moderate Poor
3. Phosphate (mg/lt)
< 1 1 - 5 >5
Good Moderate Poor
4. Nitrate (NO3)
< 10 11 - 20 >20
Good Moderate Poor
C. Biology
1. Dissolved Oxygen (mg/lt)
>
< 3
Good Moderate Poor
S : DirectorateGeneral of Land Rehabilitationand ocial Forestry, Ministry of Forestry 2009)
Total Dissolved Solids(TDS) are the solids content in a given volume of water as the result of inorganic compound in the form of suspension or solution. Dissolved solids are total amount of dissolved materials. Turbidity is expressed in a unit of turbidity, also referred to 1 mg/ lt SiO2. Turbidity is measured by a method of Nephelometric and is expressed in a unit of Nephelometric Turbidity Unit (NTU) (Sawyer and McCarty, 1978).
Electrical conductivity is the measure of water’s ability to accommodate the transport of an electric charge whose value is based on the amount of salt dissolved in water, the type of dissolved ions, and water temperature. Conductivity can be used as an instant indicator to determine the levels of ions in the water. The higher is the value, the higher is the ion levels of the water.
The acidity or alkalinity level of water discharge was measured by pH which is a scale with similar proportion to the concentration of hydrogen ions contained in the water. The pH scale is valued from 0 to 14 (pH of 7: neutral, pH <7: acid, and pH >7: alkaline). The pH value of 6.5–8.2 is optimum conditions for living beings, on the contrary, too acidic or too alkaline pH level will be dangerous for them. The acidity level of water environment is a ected by several factors, among others, the photosynthesis and biological processes and various types of cations and anions. The increased pH is in uenced by free mineral acid and carbonic acid, while an increased pH is a ected by the amount of carbonates, hydroxides and bicarbonates.
Phosphate is the phosphorus element in the water which can be utilized by plants (Dugan, 1972). Phosphate is derived from the residue of laundry detergent, animal waste, dissolved
fertilizer, and other materials. It also functions
DVQXWULHQWVIRUDTXDWLFSODQWVDQGLWFDQOHDG
to eutrophication processes. The characteristics of phosphorus can be distinguished from other major chemical elements of the biosphere’s constituent elements because it is not contained in the atmosphere. In the earth’s crust, the amount of phosphorus is relatively small and easily precipitated. Phosphorus is also an essential element for higher plants and algae as well as for the marine productivity level.
Nitrate (NO3) is a form of nitrogen contained in the water derived from soluble fertilizers and animal waste that serves as a
QXWULHQW RU IHUWLOL]HU IRU DTXDWLF SODQWV +LJK
level of nitrate in the water will increase
WKH JURZWK DQG DFWLYLW\ RI DTXDWLF SODQWV LQ FRQVHTXHQFH WKHUH ZLOO EH WKH GHSOHWLRQ RI
oxygen in the water, which may cause death to
DTXDWLFDQLPDOV,WLVFDOOHGWKHHXWURSKLFDWLRQ
3. Result and Discussion a. Water Quantity
Result of observations on water discharge (m3/sec) in Tuntang watershed in the dry
VHDVRQ ZDV FRQYHUWHG LQWR D XQLW RI VSHFLÀF
discharge (m3/sec/km2) as presented in Table 2.
%DVHG RQ WKH FODVVLÀFDWLRQ RI VSHFLÀF PLQLPXPGLVFKDUJHWKHLQÁRZRI/DNH5DZD 3HQLQJ LQ WKH GU\ VHDVRQ ZDV FODVVLÀHG DV ´JRRGµDQG´YHU\JRRGµ.RULH[FHSWIRU 5HQJDV 5LYHU 7KH KLJKHVW VSHFLÀF PLQLPXP
discharge was derived from, respectively,
6UDWHQ FDWFKPHQW DUHD P3/sec/km2)
DQG .HGXQJULQJLQ 5LYHU P3/sec/ km2). Water is temporary stored in the lake as water surplus in the surcharge storage before being released outside the dam. Total water discharge of 8.0309 m3/sec, in the downstream furthermore was utilized for hydropower, drinking water and irrigation. Although it
KDVEHHQXVHGDORQJLWVÁRZWKHGLVFKDUJHRI
Tuntang River (observation of Tuntang River 1) was still in the category of “good” with a
VSHFLÀFPLQLPXPGLVFKDUJHRIPVHF
km2.
Table2. 20
No Points of Measurement
Discharge (m3/ sec)
Area (km2)
6SHFLÀFGLVFKDUJH
(m3/sec/km2)
Vulnerability level
I. Tuntang Hulu Sub-watershed
A. Lake Rawa Pening Catchment Area
1. Kedungwringin River 1.8384 9.18 Very good
2. Ringis River 0.1110 3.47 0.0320 Good
3. Sraten River 1.5240 2.35 Very good
4. Parat River 0.0711 37.44 Good
5. Legi River 9.32 0.0284 Good
Galeh River 1.5450 0.0252 Good
7. Torong River 1.3248 0.0493 Good
8. Panjang River 0.2730 48.93 Poor
9. Rengas River 17.51 Good
B. Sanjoyo River 2.524 51.277 0.049 Good
C. Tuntang River 1 5.348 Good
D. Watu River 0.009 12.947 0.001 Poor
E. Bercak River 135.31 0.003 Poor
II. Tuntang Tengah Sub-watershed
A. Tuntang River 2 7.122 34.088 0.209 Good
B.
Glapan Dam: a. East outlet b. West outlet
1.000 3.034
91.488
0.0110.077
Poor Poor
C. Tuntang River 3 0.011 Poor
III. Tuntang Hilir Sub-watershed
A. Tuntang River 4 173.78 0,038 Good
B. Buyaran River 5.281 130.13 0,041 Good
7KH LQÁRZV LQWR 7XQWDQJ +XOX VXE
watershed consisted of Tuntang River (5.348 m3/sec), Sanjaya River (2.524 m3/sec), Watu River (0.009 m3VHFDQG%HUFDN5LYHUP3/
VHF 'HVSLWH RI WKH ´SRRUµ VSHFLÀF PLQLPXP
discharge of Watu River and Bercak River, the overall discharge of Tuntang River could be considered as “good” as demonstrated in
observation result of Tuntang River 2. Sanjaya River which could be categorized as “good” had relatively high water supply to Tuntang Hulu sub-watershed.
$GHTXDWH ZDWHU GLVFKDUJH LV XWLOL]HG
b. Water Quality
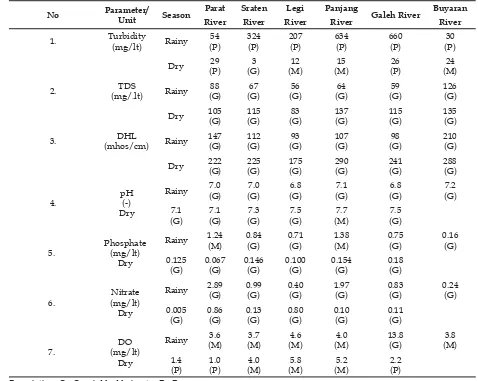
7KHSDUDPHWHUVRIZDWHUTXDOLW\REVHUYHG
in this study included 7 (seven) parameters of: 1). Turbidity, 2). Total Dissolved SolidsTDS); 3). Conductivity (Electrical conductivity); 4).
$FLGLW\S+3KRVSKDWH1LWUDWH(NO3); and 7). Dissolved Oxygen (DO). Results on
ZDWHUTXDOLW\H[DPLQDWLRQLQWKHUDLQ\DQGGU\
season in each observation point are presented in Table 3. Generally, the condition of waster
TXDOLW\ RI 7XQWDQJ ZDWHUVKHG ZDV ´JRRGµ
except for the parameters of turbidity and dissolved oxygen (DO).
as demonstrated in the observation result of Kali Tuntang 3, becomes very small and in “poor” condition. Nevertheless, the discharge of Tuntang River into Tuntang Hilir sub-watershed could be categorized as “good”, as shown in the observation result of Tuntang River 4 and Buyaran River. It indicated the water supply from the streams of Tuntang River was relatively high. In accordance to the analysis of water discharge in the dry season, the potential of Tuntang River supplied by Rawa Pening Lake to the downstream was fairly stable.
Table 3. S
No Parameter/
Unit Season
River Galeh River
Buyaran River
1. Turbidity
(mg/lt) Rainy
54
(mhos/cm) Rainy
147
(mg/lt)Nitrate
Dry
%DVHG RQ REVHUYDWLRQ RI ZDWHU TXDOLW\
in Tuntang River as presented in Table 3 indicated that the value of water turbidity along the Tuntang River in the rainy season was categorized as “poor”. The lowest value was obtained by Buyaran River of 30 NTU and
WKH KLJKHVW ZDV 3DQMDQJ 5LYHU RI 178
Meanwhile in the dry season, the lowest value
by organic and inorganic matters that were suspended and dissolved such as mud and silt, as well as inorganic and organic matters such as plankton and other microorganisms (APHA,
'DYLVDQG&RUQZHOO
On the contrary to the principle, it is expected that the high turbidity value in the rainy season was due to soil erosion resulted
IURP VXIÀFLHQW FDWFKPHQW DUHD 0DWHULDOV RI
erosion from the catchment area of Lake Rawa Pening consisted of soil particles, in addition to organic matters due to its extensive Andosol characteristic. Although some of the material deposited in the inundation area, yet the turbidity level at the downstream (Buyaran River) was
FODVVLÀHGDV´SRRUµdespite its low nominal value. According to Lloyd (1985) in Hefni Effendi, 2003, the increased value of turbidity at the clear and shallow waters of 25 NTU could reduce 1 50 % of primary productivity. The increased turbidity of 5 NTU in the lake and rivers could reduce primary productivity, respectively by 75% and 1 %. Meanwhile, in the dry season the water turbidity values decreased, except in Parat River and Galeh
5LYHUZKLFKZHUHFODVVLÀHGDV´SRRUµ,WZDV
possible that this condition was caused by stream bank erosion since the ow of the river was sourced mainly from the fountains.
$QRWKHUORZZDWHUTXDOLW\LQGLFDWRUZDV
DissolvedOxygen (DO). Based on the analysis,
WKHYDOXHRI'2LQWKHUDLQ\VHDVRQZDV² DQG FODVVLÀHG DV ´PRGHUDWHµ H[FHSW LQ
Galeh River which was considered as “good”. While in the dry season, the value of dissolved oxygen was “poor” for Parat River and Sraten River, as well as Tuntang Hilir River (Buyaran River). The condition in the rainy season was better compared to the condition in the dry season. In the rainy season, the discharge velocity is greater than in the dry season, thus the content of dissolved oxygen is greater too.
:DWHUTXDOLW\DVVHVVHGIURPWKHYDOXHRI
total dissolved solids, electrical conductivity, pH, phosphate (P), and nitrate (NO3) showed
´JRRGµTXDOLW\,QDFFRUGDQFHWRWKHDQDO\VLV 7'6 LQ WKH UDLQ\ VHDVRQ UDQJHG EHWZHHQ PJOW DQG DOO ULYHUV FRXOG EH FODVVLÀHG
as “good”, while in the dry season ranged between 83–135 mg/lt, therefore all river could
EHLGHQWLÀHGDV´JRRGµ7KHYDOXHRIHOHFWULFDO
conductivity in Tuntang Catchment Area was
PKRVFPLQZKLFKWKHORZHVWYDOXH
was obtained from Legi River of 175 mg/lt and the highest was obtained from Watu River of
mhos/cm. Based on those distribution,
most TDS of Tuntang River had electrical
FRQGXFWLYLW\YDOXHDERYHPKRVFP
Based on the result, the value of electrical conductivity in the rainy season ranged
EHWZHHQ PKRVFP DQG DOO ULYHUV FRXOG EH LGHQWLÀHG DV µJRRGµ PHDQZKLOH
in the dry season the value ranged between 175–288 PKRVFPand all rivers could be
FODVVLÀHGDVJRRG7KHYDOXHRIS+LQWKHUDLQ\ VHDVRQ UDQJHG EHWZHHQ ² DQG DOO ULYHUV FRXOGEHFODVVLÀHGDVJRRG,QWKHGU\VHDVRQ
the value ranged between 7.1–7.7 (good),
H[FHSWIRU*DOHK5LYHUZKLFKZDVFODVVLÀHGDV
“moderate”. N accordance to those results, the value of P in the rainy season ranged between
² DQG DOO ULYHU FRXOG EH LGHQWLÀHG DV
“good”, except for Parat River and Panjang
5LYHUZKLFKZHUHFODVVLÀHGDV´PRGHUDWHµ,Q
addition, in the dry season, the value ranged
EHWZHHQ ² DQG DOO ULYHUV FRXOG EH FODVVLÀHGDV´JRRGµ%DVHGRQWKRVHUHVXOWWKH
value of NO3 in the dry season ranged between
²DQGDOOULYHUVFRXOGEHLGHQWLÀHGDV
good, except for Parat River and Panjang River
FRXOGEHFODVVLÀHGDVPRGHUDWH$GGLWLRQDOO\
in the dry season the values ranged between
²DQGDOOULYHUVFRXOGEHLGHQWLÀHGDV
good.
4. Conclusions
In the upstream of Tuntang sub-watershed,
WKHLQÁRZVLQWR5DZD3HQLQJ/DNHLQWKHGU\ VHDVRQFRXOGEHFODVVLÀHGDV´JRRGµDQG´YHU\ JRRGµH[FHSWIRUWKHLQÁRZIURP.DOL5HQJDV ZKLFK ZDV FODVVLÀHG DV ´SRRUµ (YHQ WKRXJK WKHRXWÁRZVRI/DNH5DZD3HQLQJKDYHEHHQ
utilized for a variety of uses, yet the water discharge of Tuntang Hulu sub-watershed
FRXOGEHFODVVLÀHGDV´JRRGµVLQFHLWLVVXSSOLHG
from Kali Tuntang (5.348 m3/sec) in addition to from Kali Sanjaya (2.524 m3/sec), Kali Watu (0.009 m3VHFDQG.DOL%HUFDNP3/sec).
The potential of Tuntang River in the dry season provided by Rawa Pening Lake to the
GRZQVWUHDPZDVVXIÀFLHQWO\VWDELOHGHVSLWHWKH
discharge of Tuntang River had been widely
XWLOL]HGWKURXJKRXWLWVÁRZ
,Q JHQHUDO WKH ZDWHU TXDOLW\ RI 7XQWDQJ ZDWHUVKHG ZDV FODVVLÀHG DV ´JRRGµ H[FHSW
for the parameters of turbidity and dissolved
R[\JHQ,QDGGLWLRQWKHZDWHUTXDOLW\DVVHVVHG
The value of water discharge turbidity along the Tuntang River in the rainy season
FRXOG EH FODVVLÀHG DV ´SRRUµ 7KH YDOXH
indicated the erosion rate of the catchment area was relatively high. In the dry season, the turbidity level declined except in Kali Parat
and Kali Galeh which were in “poor” state. It was possible due to the occurrence of stream bankerosion the discharge was merely derived from the water resources. It can be potentially contribute to the degradation of Rawa Pening Lake.
5. References
$PHULFDQ3XEOLF+HDOWK$VVRFLDWLRQ$3+$6WDQGDUG0HWKRGVIRUWKH([DPLQDWLRQRI:DWHU DQG:DVWHZDWHU 4th edition. American Public Health Association, Washington DC.
Badan Perencanaan Pembangunan Provensi Jawa Tengah (Bappeda Jateng). 2005.Rencana Strategis Pemerintah Provensi Jawa Tengah. Bappeda Provinsi Jawa Tengah.
%URWRVXVLOR$8WDUL'6DWULD$$6XVWDLQDELOLW\RI:DWHU5HVRXUFHVLQWKH8SVWUHDP
Watershed-Based Community Engagement and Multistakeholder Cooperation, in: IOP Conference Series: Earth and Environmental Science. IOP Publishing, p. 012018.
%URZQ$/)UHVKZDWHU(FRORJ\+HLQHPDQQ(GXYDWLRQDO%RRNV/RQGRQS
Davis, M.L. and Cornwell, D.A., 1991. ,QWURGXFWLRQWR(QYLURQPHQWDO(QJLQHHULQJSecond edition. McGraw-Hill, Inc., New York.
Directorate General of Land Rehabilitation and Social Forestry, Ministry of Forestry, 2009.
3HGRPDQ0RQLWRULQJGDQ(YDOXDVL'DHUDK$OLUDQ6XQJDL.
'XDQ:+H%1RYHU'<DQJ*&KHQ:0HQJ+=RX6/LX&:DWHU4XDOLW\ $VVHVVPHQWDQG3ROOXWLRQ6RXUFH,GHQWLÀFDWLRQRIWKH(DVWHUQ3R\DQJ/DNH%DVLQ8VLQJ
Multivariate Statistical Methods. Sustainability 8, 133.
Dugan, P.R.1972. %LRFKHPLFDO(FRORJ\RI:DWHU3ROOXWLRQ. Plenum Press. New York.
Hefni Effendi, 2003. 7HODDK NXDOLWDV $LU %DJL 3HQJHORODDQ 6XPEHU 'D\D GDQ /LQJNXQJDQ 3HUDLUDQ. Penerbit Kanisius, Yogyakarta.
.DJH\DPD<,]XPL$1LVKLGD0<RNR\DPD+$SSOLFDWLRQRIIX]]\&PHDQVIRU XQGHUVWDQGLQJZDWHUTXDOLW\LQ/DNH+DFKLURNR-DSDQ,((-7UDQV(OHF(OHFWURQ(QJ
835–837. doi:10.1002/tee.22312
.RUL.0DQDJLQJ)RUHVWIRU:DWHU6XSSOLHVDQG5HVRXUFH&RQVHUYDWLRQ&RQVHUYDWLRQ
Division. Forest Agency. Tokyo. Japan. In. Kunkle, S.H., and J.L Thames. Hydrological
7HFKQLTXHVIRU8SVWUHDP&RQVHUYDWLRQ)$2&RQVHUYDWLRQ*XLGH)$2815RPH 0F0LOODQ066SDWLDODQGWHPSRUDODQDO\VLVRIODQGFRYHUFOLPDWHDQGODNHZDWHUTXDOLW\
in the Matanuska-Susitna, Valley, Alaska. ALASKA PACIFIC UNIVERSITY.
3DO-3DO05R\3.0D]XPGDU$4XDQWLWDWLYH$VVHVVPHQWRI:DWHURI5XGUDVDJDU
Lake, Tripura, India. European Journal of Advances in Engineering and Technology 3, 45– 48.
Pawitan, H. 2002. 0HQJDQWLVLSDVL.ULVLV$LUGL,QGRQHVLD0HPDVXNL$EDG In Nugroho, S.P., S.Adi, B.Setadi.ed. 3HOXDQJ GDQ 7DQWDQJDQ 3HQJHORODDQ 6XPEHU 'D\D $LU GL ,QGRQHVLD. P3-TPSLK BPPT. Jakarta.
Sawyer, C.N. and McCarty, P.L. 1978. &KHPLVWU\ IRU (QYLURQPHQWDO (QJLQHHULQJ. Third edition. McGraw-Hill Book Company, Tokyo.
Supangat, A.B., Paimin, P., 2007. Kajian Peran Waduk Sebagai Pengendali Kualitas Air Secara
$ODPL)RUXP*HRJUDÀ
:DQJ+<DR-/L<$Q$QDO\VLVRI:DWHU(QYLURQPHQW)DFWRUVDQGDQ(YDOXDWLRQRI