Mamminasata BRT User Trip Characteristics for
the Design of Demand Modelling Method
for a New BRT Line
Hitapriya Suprayitno
1and Verdy Ananda Upa
1AbstractIndonesia started to develope largely the MRT line, especially the BRT. A new BRT Corridor implementation need a Passenger Demand Prediction. Thus, a Special BRT Passenger Demand Modelling Method for a New BRT Line need to be developed. This attempt needs a sufficient knowledges on the Existing BRT User Trip Characteristics. Mamminasata BRT User Trip Characteristics Survey were executed on Corridor 2 and Corridor 3, during morning peak hour. The result indicates that the BRTs are used mainly for schooling (50%) and working (50%) trips, the BRT passengers are the previous public transport (76%) and motorcycle (24%) users. The trip origin zone is extended 3 km to the left and to the right of the BRT corridor, while the trip destination zone is extended 1.5 km to the left and to the right of the BRT corridor. The embarking connecting trip modes are dominated by motorcycle (51%), public transport (19%) and becak (18%), while the alighting connecting trip modes are dominated by walking trip (71%).
Keywordsbus rapid transit, trip characteristics, previous mode, influence area, connecting trip characteristics.
AbstrakIndonesia telah mulai membangun Angkutan Masal Cepat dengan luas, terutama BRT. Implementasi Koridor BRT Baru membutuhkan suatu Prediksi Permintaan Penumpang. Dengan demikian, suatu Metoda Pemodelan Permintaan Penumpang Khusus bagi BRT Koridor Baru perlu untuk dibangun. Upaya ini membutuhkan pengetahuan yang cukup tentang Karakteristik Perjalanan Pengguna BRT Yang Ada. Survei Karakteristik Perjalanan Penumpang BRT Mamminasata telah dilakukan untuk BRT Mamminasata Koridor 2 dan Koridor 3, pada Jam Puncak Pagi. Hasil Survei tersebut menunjukkan bahwa BRT pada Jam Puncak Pagi terutama digunakan untuk Perjalanan Kerja (50%) dan Perjalanan Sekolah (50%). Para Penumpang BRT tersebut sebelumnya adalah Pengguna Angkutan Umum (76%) dan Pengguna Sepeda Motor (24%). Zona Asal pengguna BRT merupakan daerah 3 km disebelah kiri dan kanan Koridor BRT, sedangkan Zona Tujuan pengguna BRT merupakan daerah 1,5 km dikiri dan dikanan Koridor BRT. Moda Penghubung yang digunakan sebelum menaiki BRT didominasi oleh moda sepeda motor (51%), angkutan umum (19%) dan becak (18%). Sedangkan Moda Penghubung setelah turun dari BRT didominasi oleh moda jalan kaki (71%).
Kata Kuncibus rapid transit, karakteristik perjalanan, moda sebelumnya, daerah pengaruh, karakteristik perjalanan penghubung.
I.INTRODUCTION1
ass Rapid Transit (MRT) started to be largely developed in Indonesia. For first MRT implementation, the most popular and might be the most appropriate mode for Indonesia are the Commuter Train operating on the Existing Railway Network and the Bus Rapid Transit (BRT). The BRT has implemented, among others, in Jakarta as Trans Jakarta – 12 corridors, in Yogyakarta as Trans Jogja – 8 corridors, in Semarang as Trans Semarang – 4 corridors, in Bandung as Trans Metro Bandung – 5 corridors, in Denpasar as Trans Sarbagita – 2 corridors, in Makassar as Trans Mamminasata – 3 corridors [2], [4], [8]-[13]. The BRT implementation are normally started by developing a BRT Master Plan consists of several BRT Corridors, which is then implemented step by step, one by one. Thus, BRT Passenger Demand Prediction is very important.
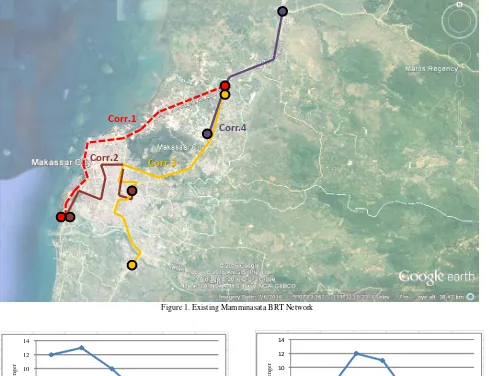
Under Presidential Decree 55/2011, Mamminasata is designated as a Metropolitan City covering Makassar, Maros, Sungguminasa, and Takalar. Makassar City, together with the surrounding area, has developed a BRT Master Plan, the Trans Mamminasata, consists of 11 Corridors. Among those 11 corridors, at present 3 BRT
1Hitapriya Suprayitno and Verdy Ananda Upa are with Department of
Civil Engineering, Faculty of Civil engineering and Planning, Institut Teknologi Sepuluh Nopember, Surabaya, 60111, Indonesia. E-mail: [email protected]; [email protected]
Corridors are in operation : Corridor 2 : Mall Panakkukang – Mall GTC, Corridor 3 : Airport Junction
– Palangga Terminal, and Corridor 4 : Daya Terminal – Maros Terminal. The next implementation is the Corridor 1: Airport Junction – Mall GTC. Thus Passenger Demand Prediction is needed.
A BRT Line operate only on a certain corridor. The go itinerary and the go-back itinerary not necesserally always the same. Thus, the the modelling area cover only A Strip Area along the Corridor. The method developed by Ministry of Transport is not very appropriate [14]. Special Passenger Demand Modelling Method for the New BRT Line need to be developed. It generate two basic important questions. How large is the BRT Influence Area ? Who are the user of the BRT ? Wether the present BRT user are only the previous public transport user ? Or the Public Transport User and the Motorcycle user ? Or maybe included the other mode user. Thus, identifying the BRT User Trip Characteritics related to those Main Questions is vital.
This paper present the research result on identifying the Existing BRT Users Trip Characteristics needed for the Design of BRT Passenger Demand Modelling Method for a New BRT Line.
II.LITERATURE REVIEW
Transport Modelling basically consist of 4 steps : 1. trip generation (trip production and trip attraction) - well known as TG, 2. modal split - well known as MS, 3. trip
distribution – well known as TD and 4. trip assignment – well known as TA [3], [5], [6], [7]. Due to the variety of problem faced, practicality reason and the modelling technic development, nowadays we know three basic different modelling types : direct model, conventional model, unconventional model. Each modelling type has its own disadvantage and advantage [5], [6], [7]. Concerning the 4 Steps Modelling Sequence, in general we know 4 sequence types. Type 1 : TG/MS – TD – TA. Type 2 : TG – MS – TD – TA. Type 3 : TG – TD/MS – TA. Type 4 : TG – TD – MS – TA [7].
These two different types of Transport Modelling, combined each other, can give the most appropriate Modelling Method for a certain case. Different case need different combinaison [1], [5], [6], [7].
Special method to predict Public Transport Passenger Demand has been formalized by Directorate General of Land Transport. The Passenger Demand is a function of potential population to do trip, number of vehicle posession and private vehicle occupancy. The passenger demand is calculated for each bus stop. The influence area cover a strip of 800m width along the bus line corrridor [14].
III.METHOD AND DATA COLLECTION
Main questions on the Demand Modelling Method Design for a New BRT Line are related to the modelling type (direct model, conventional model or unconventional model), the modelling step sequence (type 1, type 2, type 3 or type 4), the traffic zone point from the embarking BRT shelter and how far is the destination points from the alighting BRT shelter), the mode used before embarking and after alighting the BRT. More than that, certain Trip Characteristics were also noted, i.e the distribution of embarking passenger and alighting passenger along the BRT Shelters, together with the on-board passenger distribution by segment along the BRT Corridor.
This research is a prerequisite work to calculate BRT Passenger Demand Prediction for BRT Mamminasata Corridor 1 : Airport Junction – Mall GTC. At present there are 3 Mamminasata BRTs in operation : the Corridor 2 : Mall Panakukang – Mall GTC, Corridor 3 : Airport Junction – Palangga Terminal, Corridor 4 : Daya Terminal – Maros Terminal. BRT Corridor 2 and Corridor 3 were taken a samples for identifying the BRT User Trip Characteristics, since these two corridors pass through the city center area. The Corridor 3 is started from the Airport Junction; the same as the Corridor 1. While the Corridor 2 is ended in Mall GTC; the same as the Corridor 1. The Existing Mamminasata BRT Network is presented in Figure 1 below.
Survey were executed during morning peak hour in July 2016. A sample of 20 passengers were taken for each direction. It means, in total, a sample of 80 passengers have been gotten. The survey has been done in four days. The BRT Users Trip Characteristics collected are : the trip purpose; the previous modes used before the BRT in operation; the connecting trip
characteritics before embarking – the embarking shelter, the origin point, the origin point distance, the mode used; and the connceting trip characteristics after alighting – the alighting shelter, the destination points, the destination point distance, the mode used.
IV.ANALYSIS
Survey has been finished, the data collected were analyzed to produced several keypoints characteristics needed for developing the BRT Passenger Demand Modelling Method. The keypoints characteristics are the trip purpose, the previous modesbefore the existence of the BRT, the connecting trips – distance and modes used. Two other characteristics were added, i.e. embarking alighting distribution and the on-board passenger distribution along the BRT corridor. Those keypoints characteristics are presented as follow. morning peak hour ridership can be stated as stable. The survey data are presented in Table 1.
Previous Mode Used before the BRT Operation B.
Concerning the Previous Mode Used before the BRT Operation, the survey data indicate that 76% of the sample used other public transports and 24% of the sample used motorcycle. This fact shows that the BRT is capable to shift the Motorcycle Mode to the BRT Mode. This will influence the Demand Modelling Method. The Demand Modelling survey can not be concentrated Characteristics, either the Embarking Connecting Trip and Alighting Connecting Trip. The Embarking Connecting Trip Distance will influence the extend of Trip Production Area for the BRT Passenger. The Alighting Connecting Trip Distance will influence the extend of the Trip Attraction Area for the BRT Passenger. The Connecting Modes is also important to be noted.
1) Connecting Trip Characteristics – Before Embarking
Area. This Strip Area of 4 km wide, along the corridor, is the Main Trip Production Area for the Existing BRT Corridor 2 and Corridor 3. The survey result data are presented in Table 3 and Table 4 below.
2) Connecting Trip Characteristics – After Alighting Survey on the After Alighting Connecting Trip Characteristics indicate that Distance between Point of Destinantion to the Alighting BRT Shelter vary from 0 – 1.5 km. Most the trips, 70% of total sample, have strip along the corridor, with 2 km wide strip as the main influence area. This Strip Area of 2 km wide, along the corridor, is the Main Trip Attraction Area for the Existing BRT Corridor 2 and Corridor 3. The survey result data are presented in Table 5 and Table 6.
Sample Embarking and Alighting Distribution. D.
Sample data on embarking and alighting points indicate the following characteristics of embarking and alighting distribution. The embarking points for the two corridors in two directions are dominated by shelters which are located closed to residential area. The embarking points practically always located on shelters located not far from the BRT departure point. On the other hand, the alighting points practically distributed on shelters which are closed to or even next to the office, school and university area. The alighting points practically always located on shelters a bit far from the BRT departing point or closed to the BRT end point.
On-Board Sample Passenger Distribution along E.
Corridor Segments
On-Board Sample Passenger Distribution along the Corridor Segments is also important to be noted. These characteristics can be used as a comparaison data to the Passenger Demand Modelling Result. Characteristics presented are based on Sample Passenger, which is 20 passenger for each Direction of each Corridor. The On-Board Passenger Distribution along segment are presented for each Corridor.
1) On-Board Sample Passenger Distribution along Segments – Corridor 2
Passenger Distributions along Segments in Corridor 2 are similar for both directions. The distribution is heavy in the first segments and is light in the last segments. The biggests number of passenger happen between Shelter SMA 1 – Shelter Mall Ratu Indah for the First Direction (Mall Panakkukang – Mall GTC) and between Shelter Losari – Shelter Karebosi for the Second Direction (Mall GTC – Mall Panakkukang). Those two strips are located in Makassar CBD Area. The Passenger Distribution are presented in Figure 2 and Figure 3.
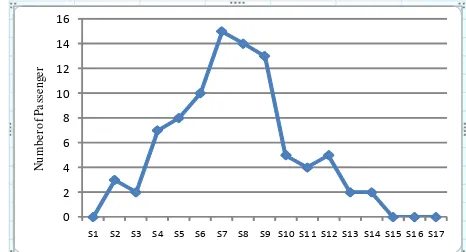
2) On-Board Sample Passenger Distribution along Segments – Corridor 3
Passenger Distributions along Segments in Corridor 3 are similar for both directions. The distribution is heavy in the middle segments. The biggests number of passenger happen between Shelter Daya – Shelter Pendidikan for the First Direction (Airport Junction – Palangga Terminal) and between Shelter UMI – Shelter STIMIK Dipanegara for the Second Direction (Palangga
Terminal – Airport Junction). Those two strips are located in Makassar CBD Area. The Passenger Distribution are presented in Figure 4 and Figure 5.
V. CONCLUSION
The research objective has been fullfilled. Several key conclusions, concerning the Mamminasata BRT Corridor 2 and Corridor 3 User Trip Characteritics, can be presented as below :
1. The BRT is largely used by school trip and working trip in the morning peak hour. The morning peak hour passengers practically are all regular passenger.
2. The BRT Passenger are approximately consists of 76% of previous public transport users and 24% of previous motorcycle users.
3. The Trip Production Zone is a Strip of 6 km wide along the Corridor Line, with 84% of Production originated from a Strip of 4 km wide.
4. The Trip Attraction Zone is a Strip of 3 km wide along the Corridor Line, with 92% of trips have destinations on a Strip of 2 km wide.
5. The main Connecting Mode for Embarking are motorcycle at 51%. While the share of other modes are public transport at 19%, becak at 18%, walking at 9% and car at 4%.
6. The main Connecting Mode for Alighting is mainly walking at 71%. Becak and public transport are used by 18% and 11% respectively.
7. The embarkation is ditributed among the BRT shelters closed to the residential area.
8. The alightment is distributed among the BRT shelters closed to the destination points, such as : schools, campusses and offices.
These Mamminasata BRT User Trip Characteristics data have been largely sufficient to develop the
[1] R. Cervero, J. Murakami and M. Miller, "Direct Ridership Model of Bus Rapid Transit in Los Angeles County. Working Paper UCB-ITS-VWP-2009-3.," Institute of Transportation Studies. University of California, Berkeley, 2009.
[2] C. Nugroho, "Aksesibilitas Halte dan Kualitas Pelayanan Trans Jogja dengan Keputusan Pengguna," Fakultas Ilmu Sosial. Universitas Negeri Yogyakarta, Yogyakarta, 2013.
[3] J. D. Ortuzar and L. G. Willumsen, Modelling Transport. Second Edition, New York: John Wiley & Sons, 1994.
[4] J. v. Steijn, "Creating Feeder Bus Lines for Trans Jakarta BRT," Civil Engineering. University of Twente, Twente, 2014. [5] H. Suprayitno, "Metoda Pemodelan Angkutan Barang Perkotaan
– Kasus Kotamadya Surabaya," in Seminar II FTSPT II, Surabaya, 1999.
[7] O. Z. Tamin, Perencanaan dan Pemodelan Transportasi. Edisi Kedua, Bandung: ITB, 2000
[8] Direktur Jenderal Perhubungan Darat, "Direktorat Jenderal Perhubungan Darat, Kementrian Perhubungan Republik Indonesia," 16 August 2002. [Online]. Available: http://hubdat.dephub.go.id/keputusan-dirjen/tahun-2002/423-sk-dirjen-no-687aj. [Accessed 25 July 2016].
[9] (2016, July) Wikipedia-Trans Semarang. [Online]. https://id.wikipedia.org/wiki/TransSemarang.
[10] (2016, July) Wikipedia-Trans Metro Bandung. [Online]. https://id.wikipedia.org/wiki/TMB.
[11] (2016, July) Wikipedia-Trans Sarbagita. [Online]. https://id.wikipedia.org/wiki/Trans_Sarbagita.
[12] (2016, July) Wikipedia-Trans Mamminasata. [Online]. https://id.wikipedia.org/wiki/Trans_Mamminasata.
[13] (2016, July) Wikipedia-Trans Jakarta. [Online]. https://id.wikipedia.org/wiki/Transjakarta.
[14] (2016, July) Wikipedia-Trans Jogja. [Online]. https://id.wikipedia.org/wiki/Trans_Jogja.
Figure 1. Existing Mamminasata BRT Network
1 Seg 1 12 2 Seg 2 13 3 Seg 3 10 4 Seg 4 6 5 Seg 5 4 6 Seg 6 3
0 2 4 6 8 10 12 14
Seg 1 Seg 2 Seg 3 Seg 4 Seg 5 Seg 6
N
u
m
b
er
o
f
P
a
ss
en
ge
r
Figure 2. On-Board Sample Passenger Distribution - Corr 2 : Mall Panakkukang - Mall GTC
1 Seg 1 6 2 Seg 2 7 3 Seg 3 12 4 Seg 4 11 5 Seg 5 6 6 Seg 6 4 Seg 7 1
0 2 4 6 8 10 12 14
Seg 1 Seg 2 Seg 3 Seg 4 Seg 5 Seg 6 Seg 7
N
u
m
b
er
o
f
P
a
ss
en
ge
r
Figure 3. On-Board Sample Passenger Distribution - Corr 2 : Mall GTC - Mall Panakkukang
Corr.1
Corr.4
1 S1 0
2 S2 4
3 S3 8
4 S4 10
5 S5 14
6 S6 15
S7 20
S8 20
S9 19
S10 15
S11 12
S12 9
S13 7
S14 6
0 5 10 15 20 25
S1 S2 S3 S4 S5 S6 S7 S8 S9 S10 S11 S12 S13 S14 S15 S16 S17 S18
N
u
m
b
er
o
f
P
a
ss
en
g
er
Figure 4. On-Board Sample Passenger Distribution - Corr 3 : Airport Junction – Palangga Terminal
1 S1 0
2 S2 3
3 S3 2
4 S4 7
5 S5 8
6 S6 10
S7 15
S8 14
S9 13
S10 5
S11 4
S12 5
S13 2
S14 2
0 2 4 6 8 10 12 14 16
S1 S2 S3 S4 S5 S6 S7 S8 S9 S10 S11 S12 S13 S14 S15 S16 S17
N
u
m
b
er
o
f
P
a
ss
en
ge
r
Figure 5. On-Board Sample Passenger Distribution - Corr 3 : Palangga Terminal – Airport Junction
TABLE 1. TRIP PURPOSE
No Trip Purpose Corridor 2 Corridor 3 Total Percentage
1 Schooling 17 23 40 50% 2 Working 23 17 40 50%
Total 40 40 80 100%
TABLE 2.
PREVIOUS MODES USED BEFORE THE BRTOPERATION
No Modes Corridor 2 Corridor 3 Total Percentage
1 Public Transport 29 32 61 76% 2 Motorcycle 11 8 19 24% 3 Car 0 0 0 0%
Total 40 40 80 100% TABLE 3.
DISTANCES BETWEEN THE ORIGIN POINT TO THE EMBARKING BRTSHELTER
No Distance Corridor 2 Corridor 3 Total Percentage
1 0.0 - 1.0 km 12 17 29 36% 2 1.0 - 2.0 km 20 18 38 48% 3 2.0 - 3.0 km 8 5 13 16% Total 40 40 80 100%
TABLE 4.
MODES USED BEFORE EMBARKING THE BRT
No Modes Corridor 2 Corridor 3 Total Percentage
1 Walking 3 4 7 9% 2 Becak 1 13 14 18% 3 Public Transport 12 3 15 19% 4 Motorcycle 21 20 41 51% 5 Car 3 0 3 4%
Total 40 40 80 100% TABLE 5.
DISTANCES BETWEEN THE DESTINATION POINT TO THE ALIGHTING BRTSHELTER
No Distance Corridor 2 Corridor 3 Total Percentage
1 0.0 - 0.5 km 29 28 57 71% 2 0.5 - 1.0 km 11 6 17 21% 3 1.0 - 1.5 km 0 6 6 8%
TABLE 6.
MODES USED AFTER ALIGHTING THE BRT
No Mode Corridor 2 Corridor 3 Total Percentage
1 Walking 29 28 57 71% 2 Becak 11 3 14 18% 3 Public Transport 0 9 9 11% Total 40 40 80 100%
TABLE 7.
SAMPLE PASSENGER EMBARKING AND ALIGHTING DISTRIBUTION FOR CORRIDOR 2
No BRT Shelter Mall P - Mall GTC BRT Shelter Mall GTC - Mall P
Embark Alight Embark Alight
1 Mall Panakukang 12 - Mall GTC 6 - 2 SMA 1 5 4 Trans Studio 1 - 3 RS Pelamonia 3 6 Pantai Losari 7 2 4 Mall Ratu Indah - 4 Fort Rotterdam - 1 5 Rajawali - 2 Karebosi 5 10 6 Trans Studio - 1 Masjid Raya 1 3 7 Mall GTC - 3 Masjid Al-Markaz - 3 8 Mall Panakukang - 1
Total 20 20 Total 20 20
TABLE 8.
SAMPLE PASSENGER EMBARKING AND ALIGHTING DISTRIBUTION FOR CORRIDOR 3
No BRT Shelter Airport - Palangga BRT Shelter Palangga - Airport
Embark Alight Embark Alight
1 Airport - - Palangga - - 2 Bumi Permata 4 - UnMuh 3 - 3 Citra Sudiang 4 - Arsip - 1 4 KLH 2 - UIN 5 - 5 Bulurokeng 4 - LPMP 1 - 6 Perhubungan 1 - Mall Panakukang 3 1 7 Daya 5 - UMI 6 1 8 STIMIK Tamalanrea - - Gubernur - 1 9 Cokroaminoto - 1 UIM - - 10 Pendidikan - 4 STIMIK Dipanegara - 1 11 STIMIK Dipanegara - 3 Pendidikan - 8 12 UMI - 3 RS Hasanuddin - 1 13 Bosowa - 2 DAMRI 2 1 14 Mall Panakukang - 1 Perhubungan - 3 15 UNM - 1 KLH - - 16 UIN - 4 Citra Sudiang - 2 17 UnMuh - 1 Bumi Permata - - 18 SMA 1 Gowa - - Airport - - 19 Pallangga - -