* Partly presented at the 126th JSAM Kansai Branch Annual Meeting at Wakayama Japan in September 2011 and at ASABE Annual International Meeting at Louisville Kentucky USA in August 7-11, 2011.
*1 JSAM Member, Corresponding author, Graduate School of Agriculture, Kyoto University, Sakyo ku, Kyoto 606-8502, Japan ; [email protected].
*2 JSAM Member, Graduate School of Agriculture, Kyoto University, Sakyo ku, Kyoto 606-8502, Japan
I Introduction
L-ascorbic acid (L-AA), also known as vitamin C, is a water-soluble vitamin. It can be found widely in many plant materials, such as fruit and vegetables. Recently, many food products, such as juices and sports drinks, are fortified with L-AA. This is because L-AA is an essential nutrient and antioxidant, and thus plays an important role in health. Hence, there is increasing demand for vitamin C in both fresh and processed foods and drinks. Of the L-AA that is found in fresh food, such as fruits and vegetables, is however subject to degradation such process as heating, etc (Lee & Kader, 2000). For this reason, it is highly desirable to be able to quantify L-AA in foods, especially in juices or sports drinks, for quality control purposes.
Many papers have established non-spectroscopic methods for L-AA determination. These conventional methods include titrimetry, chemiluminescence, fluorometric, chromatographic and electrochemical methods (Arya et al., 1998; Arya et al., 2000). Each method though has its limitations. For example, while the titrimetry method using dichlorophenolidophenol as the titrant is rapid, the titrant itself is unstable and must be standardized before use. In the case of the chromatographic method, while it is accurate, it is expensive and time consuming.
Of the spectroscopic methods, Blanco et al., (1993) reports using near infrared (NIR) spectroscopy coupled with
step-wise multiple linear regression (SMLR) and partial least squares (PLS) regression to determine L-AA in pharmaceutical products at concentrations of 16.67%, 22.88% and 40% . In this analysis relative standard error (RSE) was used to assess the quality of the calibration and validation model, both for the SMLR and PLS regression. The RSE for the SML regression was 0.59-1.82% (calibration), and 0.72-2.34% (validation); and 0.69-2.46% (calibration), 0.89-2.85% (validation) for PLS regression. Spectroscopic methods using NIR, Mid Infrared (MIR) and Raman spectroscopy for determination of L-AA in powder and liquid samples has been reported by Yang & Irudayaraj (2002). In these measurements, coefficients of determination (R2) for L-AA were 0.966-0.999, 0.973-0.980, and 0.941 for MIR, NIR and Raman spectroscopy, respectively. In the same report, determination of L-AA concentrations in the mid infrared region was conducted using Fourier transform infrared attenuated total reflectance (FTIR-ATR) spectroscopy in aqueous solutions. It was also demonstrated that using FTIR- ATR in the mid infrared region provided the best prediction of L-AA concentration, with R2 = 0.999 and the lowest standard error of cross-validation (SECV) =0.23%. In the far infrared region, an investigation of vibrational spectra of L-AA at low frequencies (below 100 cm-1) using terahertz time domain spectroscopy (THz-TDS) was reported by Binghua et al., (2008). However, determination of L-AA concentrations
L-Ascorbic Acid Prediction in Aqueous Solution Based on FTIR-ATR
Terahertz Spectroscopy*
Diding SUHANDY
*1, Meinilwita YULIA
*2, Yuichi OGAWA
*2, Naoshi KONDO
*2Abstract
The feasibility of using attenuated total reflectance-terahertz (ATR-THz) spectroscopy for quantification of L-ascorbic acid (L-AA) in aqueous solutions was investigated. The spectra of 55 samples of L-AA solution ranging in concentration from 0-21% were acquired using Terahertz-based Fourier transform infrared (THz-FTIR) spectrometer. Spectral absorbance in the range 20 to 400 cm-1 was used in this analysis. Full spectrum partial least squares (FS-PLS) regression was used to develop and validate the calibration model for determination of L-AA. The result showed that using the pre-processing of Savitzky-Golay first derivative spectra, prediction resulted in the lowest root mean square error of prediction (RMSEP) = 2.791%. A ratio of standard deviation to prediction error (RPD) value of 4.48 was obtained.
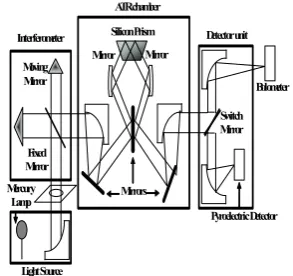
Fig. 1 FARIS-1S spectrometer used for THz spectral acquisition (JASCO Corp., Japan)
Mercury Lamp
Interferometer Detector unit
Pyroelectric Detector
using FTIR-ATR in the far infrared region including low and high frequency has not been reported yet. The use of this region for spectroscopic analysis, which is now known as the terahertz (THz) region, has to date been little explored due to the lack of appropriate generating and detecting devices.
Recent developments in both emitting and more readily detecting methods of THz radiation have enabled terahertz spectroscopy to be undertaken. THz spectroscopy utilizes electromagnetic waves ranging from 0.1 to 10 THz. One THz corresponds to 33.33 cm-1, 4.14 meV, and has a wavelength of 300 μm (Beard et al., 2002; Pickwell and Wallace, 2006; Baxter and Guglietta, 2011; Ferguson and Zhang, 2002). This region, especially in the low frequencies (0.3–6.0 THz, or about 10–200 cm-1) is rich in information about intra-molecular and inter-molecular vibrational modes in biological molecules (Laman et al., 2008). While NIR and mid infrared spectroscopy utilize electromagnetic radiation which correspond to stretching or bending motions of individual bonds in the molecule, in the far infrared or THz region electromagnetic radiation corresponding to motions of the entire structure is utilized (Laman et al., 2008). THz radiation has low photon energies (1 THz = 4.14 meV), one million times weaker than x-rays, and will not cause harmful photo ionization in biological tissues. This has advantages both for imaging biological materials, and in food analysis. In addition to being considered safe for most applications, THz radiation can penetrate through many commonly used non-polar dielectric materials such as paper, cloth, cardboard, textiles, plastics, wood, leather and ceramics with moderate attenuation. This allows THz spectroscopy to be used in non-invasive and non-destructive inspection systems. The range of potential applications for THz spectroscopy is expanding with the increased availability of many absorption spectra discovered recently in the THz region (e.g., fingerprint spectra). Those spectra are peculiar to specific chemicals, including vitamins, sugars, pharmaceuticals, and agricultural chemicals (Kawase et al., 2003). One study successfully applied a THz imaging technique for non-invasive detection of illicit drugs inside an envelope (Kawase et al., 2003). Other studies successfully acquired low vibrational spectra (below 200 cm-1 of wavenumber) of riboflavin (vitamin B2) and related compounds, and spectral absorbance of several fatty acids and their analogues (Takahashi et al., 2005; Jiang et al., 2011).
Water, a strongly polar liquid, is highly absorptive in the THz region (Ogawa et al., 2009; Querry et al., 1991). Therefore, it has not been recommended for use with the transmittance method of THz spectral probing in aqueous solutions. To overcome this limitation, the attenuated total reflectance (ATR) method is widely used for aqueous samples
in the THz region, instead of using the transmittance method. There has however been no significant report on the application of FTIR-ATR-THz spectroscopy coupled with chemometric method for determination of L-AA in aqueous solutions. Therefore, the objective of this study was to demonstrate the potential use of FTIR-ATR-THz spectroscopy for quantification of L-AA in aqueous solutions. Specifically, a calibration model for L-AA using full spectrum partial least squares (FS-PLS) regression is developed. This calibration model can be used to predict the concentration of L-AA in aqueous solutions.
II Materials and Methods
1. Spectrometer for THz spectral acquisition
Table 1 Characteristic of calibration and cross-validation and prediction sample sets
Items Calibration and cross-validation sample set
Standard deviation* 6.69 6.81
*Units % %
2. L-Ascorbic Acid (L-AA) Solutions
L-ascorbic acid (L-AA) powder (Wako Pure Chemical Industries, Ltd., Japan) was used to prepare L-AA solutions, by dissolving the powder in distilled water. The solutions were stirred well with a mixer (Tube Mixer TRIO HM-, AS ONE, Japan). In this study, 55 samples of L-AA solution were prepared. The concentration range of the L-AA solutions was 0-21% (mass/mass (w/w)). For FTIR-ATR-THz measurement, a 300μL sample of the L-AA solution was pipetted quickly onto the silicon prism surface using a micro pipette.
The samples were divided into two sample sets. A calibration and cross-validation sample set, consisting of 35 samples. This set was used for developing the calibration model and performing the cross-validation test. And a prediction sample set, consisting of 20 samples, was used for prediction purposes. Table 1 shows the two sample sets in detail, and the range of L-AA concentrations in the calibration and cross-validation set, which covers the range in the prediction set.
3. ATR THz spectra acquisition
FTIR-ATR-THz spectra of the L-AA solutions were acquired in the range 20-450 cm-1, using a 16 cm-1 of resolution. Each spectrum contains on average 200 scanning spectra. The reference for air was measured every 5 samples. The spectra intensity of samples and reference were obtained in single beam (SB) unit. During THz spectral measurement, the laboratory temperature and relative humidity were maintained at around 25°C and 70% respectively. The absorbance value of the sample was calculated using equation 1.
R is intensity of air reference at wavenumber
ν
The calculated absorbance value was corrected using the ATR correction function provided in the software (JASCO Spectral Manager, JASCO Corp., Tokyo, Japan). The corrected values were used for further analysis.
4. Calibration model using full spectrum PLS (FS-PLS) regression
To extract the relationship between THz spectra and the concentration of L-AA, a number of calibration models were developed using FS-PLS regression with different pre-processed spectra, including smoothing (moving average, median filter, Gaussian filter and Savitzky-Golay smoothing), and derivation (Savitzky-Golay first and second derivative). The internal validation method, known as full cross-validation, was conducted for each calibration model. FS-PLS regression is a very powerful and useful technique for quantitative studies in analytical science, including spectroscopy. In this method, FS-PLS regression utilized both information from all wavenumbers of the THz spectra and the L-AA concentration data, and new variables called latent variables (PLS factors). In the development of all the calibration models, 20 PLS factors were set up as a maximum. Pre-processing of the spectra and the development of a calibration model using FS-PLS regression was performed by using the commercial multivariate analysis software The UnscramblerⓇ version 9.8 (CAMO, Oslo, Norway).
5. Evaluation of the calibration model and prediction
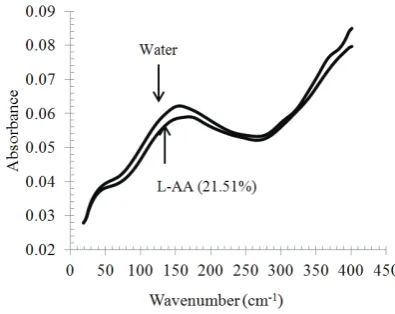
Fig. 2 Typical spectra of water and L-AA solution in terahertz region (20-400 cm-1)
Table 2 C a l i b r a t i o n a n d v a l i d a t i o n r e s u l t f o r L - A A
Savitzky-Golay smoothing with number of segments:3, polynomial order: 2 e
Savitzky-Golay first derivative with number of segments:11, polynomial order: 2 f
Savitzky-Golay second derivative with number of segments:13, polynomial order: 2
higher (Williams & Sobering, 1996; Conzen, 2006). Another important parameter is the number of PLS factors used to explain the model. This number also indicates the complexity of the model and is based on the minimum RMSECV. The performance of the final model was evaluated according to the root mean square error of prediction (RMSEP) and the coefficient determination (R2) in the prediction set.
III Results and Discussion
1. Typical spectra of L-AA solution in THz region
Figure 2 shows the typical spectra of L-AA in solution and water in the THz region (20-400 cm-1). Spectra data above 401 cm-1 was not used because high noise was identified in the wavenumber range of 401-450 cm-1. Both spectra are very similar in shape. Water is the main component in our L-AA solution. The absorbance peak of water spectrum in the THz region observed in this study is consistent with a previous report (Ogawa et al., 2009). The peak was located at 154.3 cm-1 of wavenumber or at 4.6 THz. The spectrum of water is higher than that of L-AA in solution which indicates the influence of the L-AA molecule. The Terahertz region is rich in information about intra-molecular and inter-molecular stretching, and vibration of organic compounds (Laman et al., 2008). The presence of the L-AA molecules in water results in intra-molecular and inter-molecular stretching vibration mode associated with organic bonding between L-AA and water molecules (L-AA
–
water, water–
water and L-AA–
L-AA) and results in a weaker absorbance of a L-AA solution compared to that of pure water (Figure 2).2. Calibration and cross-validation result of L-AA concentration determination
Using the FS-PLS regression method, calibration and cross-validation were performed on the original and several pre-processed spectra (Table 2). The
developed calibration model was further validated by full cross-validation using the ‘‘leave one out’’ technique. In this technique, one of the calibration samples is removed. Subsequently, the removed sample was predicted with the revised model using the residual samples, and the procedure was repeated until each sample was excluded once from the model (Gurdeniz et al., 2007). Seen in Table 2, all of the calibration models had a very high R2 = 0.981-0.996. The RMSEC values of L-AA varied from 0.396% to 0.909% (w/w). The RMSECV values varied from 1.430% to 2.598% (w/w). These values were very similar compared to a previous result of L-AA determination in powder and liquid samples. Yang & Irudayaraj (2002) obtained SECV values 0.23%, 1.35% and 2.47% for FTIR-ATR mid infrared spectroscopy, NIR spectroscopy and Raman spectroscopy, respectively. This result shows that FTIR-ATR-THz spectroscopy has the potential for quantification of L-AA in aqueous solution. RPD and RER values were also satisfactory. Most of the developed calibration models had an RPD of more than 3 and an RER of more than 10, except for the Savitzky-Golay second derivative spectra.
3. Prediction of L-AA concentration
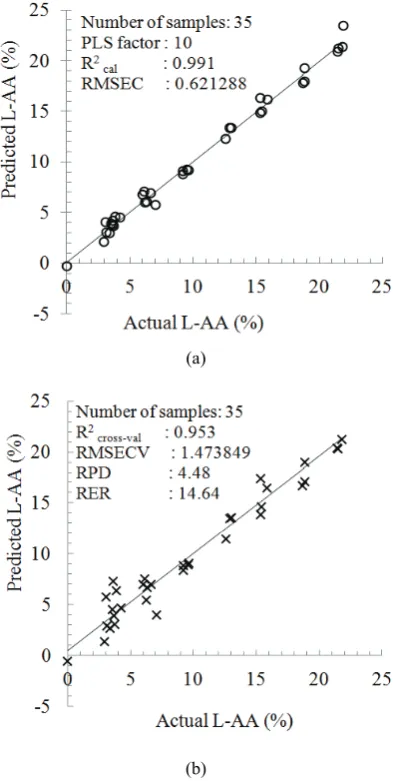
(a)
(b)
Fig. 3 (a) Plot of actual vs. predicted values from the calibration model for L-AA determination and (b) plot of actual vs. predicted values for validation results for L-AA determination using Savitzky-Golay first derivative spectra in the range 20-400 cm-1
spectra resulted in the lowest RMSEP (RMSEP = 2.791%) and with the highest coefficient of determination (R2pred = 0.916). Hence, this calibration model was selected as the best calibration model for predicting L-AA concentration in aqueous solutions. A scatter plot between actual and predicted values for calibration and validation using Savitzky-Golay first derivative spectra is depicted in Fig. 3.
Figure 4 shows the scatter plot of the prediction result. By a
95% confidence paired t-test, there were no significant differences between the actual L-AA concentrations measured using the reference method and that predicted by FTIR-ATR-THz spectroscopy. This result shows that a calibration model for spectroscopy-based determination of L-AA concentration using FTIR-ATR-THz spectroscopy is possible. Prediction results show that FTIR-ATR-THz
spectroscopy successfully predicted the concentration of L-AA in solution and has the potential for L-AA determination in complex systems, such as fruit juices and other aqueous systems.
Fig. 4 Scatter plot of actual vs. predicted of L-AA for prediction step (The predicted values were calculated by using the calibration model developed by Savitzky-Golay first derivative spectra.)
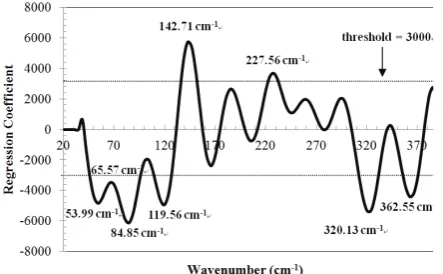
4. Evaluating the structure of the calibration model
Fig. 5 Regression coefficient plot calculated for L-AA determination (Calculations were conducted by using Savitzky-Golay first derivative spectra of wavenumber 20-400 cm-1 using FS-PLS regression.)
wavenumber (RIKEN Terahertz Database). However, since L-AA in solid and liquid samples forms different spectra in the THz region, further investigation is needed to clarify this finding.
IV Summary and Conclusions
In summary, quantitative measurement of L-AA concentration in aqueous solutions using FTIR-ATR in terahertz (THz) region is possible. Our calibration and validation model results show a high correlation between terahertz spectra of L-AA solution and L-AA concentration. The calibration model using the calculated Savitzky-Golay first derivative was found to give the best prediction of L-AA concentrations in aqueous solutions. A prediction error of 2.791% was obtained and it seemed to be applicable for accurate determination of L-AA concentrations in aqueous solutions. The overall results indicate that the concentration of L-AA in aqueous solutions can be accurately determined by FTIR-ATR-THz spectroscopy coupled with a FS-PLS regression calibration model. Further research will focus on realizing the potential of using FTIR-ATR-THz spectroscopy for the determination of L-AA concentrations in complex systems, such as fruit juices and other aqueous systems.
Acknowledgement
This work was supported in part by KAKENHI (Grant-in-Aid for challenging Exploratory Research No. 23658209). We also are grateful to many of our academic colleagues for many discussions in this field.
References
Arya, S., P. M. Mahajan, and P. Jain. 1998. Photometric methods for the determination of Vitamin C. Analytical Science, 14: 889–895.
Arya, S., P. M. Mahajan, and P. Jain. 2000. Non-spectrophotometric methods for the determination of Vitamin C. Analytica Chimica Acta, 417:1–14.
Baxter, J.B. and G.W. Guglietta. 2011. Terahertz spectroscopy. Analytical Chemistry, 83: 4342–4368.
Beard, M.C., G.M. Turner, and C.A. Schmuttenmaer. 2002. Terahertz spectroscopy. The Journal of Physical Chemistry B, 106: 7146–7159.
Binghua, C., Z. Guangxin, and Z. Zekui. 2008. Far-infrared vibrational spectra of L-ascorbic acid investigated by terahertz time domain spectroscopy. Proceedings of the Second International Conference on Bioinformatics and Biomedical Engineering. Shanghai.p. 47–49.
Blanco, M., J. Coello, H. Iturriaga, S. Maspoch, and C. Pezuela. 1993. Determination of ascorbic-acid in pharmaceutical preparations by near-infrared reflectance spectroscopy. Talanta, 40: 1671–1676.
Camps, C. and D. Christen. 2009. On-tree follow-up of apricot fruit development using a hand-held NIR instrument. Journal of Food Agriculture and Environment, 7(2):394–400.
Carles Collell, C., P. Gou, P. Picouet, J. Arnau, and J. Comaposada. 2010. Feasibility of near-infrared spectroscopy to predict aw and moisture and NaCl contents of fermented pork sausages. Meat Science, 85(2): 325–330.
Conzen, J. P. 2006. Multivariate calibration. A practical guide for developing methods in the quantitative analytical chemistry. Ettlingen: Bruker Optik GmbH.
Ferguson, B. and X.C. Zhang. 2002. Materials for terahertz science and technology. Nature Materials, 1: 26–33.
Gurdeniz, G., F. Tokatli, and B. Ozen. 2007. Differentiation of mixtures of monovarietal olive oils by mid-infrared spectroscopy and chemometrics. European Journal of Lipid Science and Technology, 109:1194–1202.
Hangyo, M., T. Nagashima, and S. Nashima. 2002. Spectroscopy by pulsed terahertz radiation. Measurement Science and Technology, 13: 1727–1738.
Jiang, F.L., I. Ikeda, Y. Ogawa, and Y. Endo. 2011. Terahertz absorption spectra of fatty acids and their analogues. Journal of Oleo Science, 60(7): 339–343.
Kawase, K., Y. Ogawa, and Y. Watanabe. 2003. Non-destructive terahertz imaging of illicit drugs using spectral fingerprints. Optics Express, 11(20):2549–2554.
Laman, N., S.S. Harsha, D. Grischkowsky, and J.S. Melinger. 2008. High-resolution waveguide THz spectroscopy of biological molecules. Biophysical Journal, 94:1010–1020.
Lee, S.K. and A.A. Kader. 2000. Preharvest and postharvest factors influencing vitamin C content of horticultural crops. Postharvest Biology and Technology, 20: 207–220.
IEICE Electronic Express, 6(2): 117–121.
Pickwell, E. and V.P. Wallace. 2006. Biomedical applications of terahertz technology. Journal of Physics D: Applied Physics, 39: R301–R309.
Querry, M. R., D.M. Wieliczka and D.J. Segelstein. 1991. Water (H2O). In Handbook of Optical Constants of Solids II, ed. E.D. Palik, 1059-1077. San Diego, California: Academic Press. RIKEN Terahertz Database: http://thzdb.org
Takahashi, M., Y. Ishikawa, J. Nishizawa and H. Ito. 2005. Low-frequency vibrational modes of riboflavin and related compounds. Chemical Physics Letters, 401: 475–482.
Williams, P.C. and D.C. Sobering. 1996. How do we do it: a brief summary of the methods we use in developing near infrared calibrations. In Proc. 7th International Conference on Near Infrared Spectroscopy, eds. A.M.C. Davies and P. Williams, 185–188. Montreal: NIR Publications.
Yang, H., and J. Irudayaraj. 2002. Rapid determination of vitamin C by NIR, MIR and FT Raman techniques. Journal of Pharmacy and Pharmacology, 54: 1247–1255.