Chapter 17
Smart Monitoring Data Centre base on Mini Single Board Computer BCM 2835
Dikpride Despa1,a, Mardiana1,b, Gigih Forda Nama1,c
1
Department of Electrical Engineering, University of Lampung Jl. Prof. Sumantri Brojonegoro No. 1 Bandar Lampung 35145
a
[email protected],[email protected],[email protected]
Abstract. Folded plate structures should be redefined as form-resistant structures in which the folded-plate action is a combination of transverse and longitudinal beam action[1] p.296. The early generation of folded plate structure is marked with true folded plate structures. As the number and the variety of building form increases, classification based on form took place and being developed. This leads to confusion. The confusion is shown from building examples. Roofing with either steel or pre-stressed concrete trusses were classified as folded structures. Origami could lead to another confusion, because it could be applied as either a building structure or as a non-structural member, such as ceilings. Based on the case of Sydney Opera House, and on other misleading folded structure building examples, a conclusion to stop the usage of the term “folded structures” has been recommended. Another recommendation is to separate building form categories from building structure classification.
Keywords: Architecture, Building Structure, Construction, Folded Plate Structure, Form-resistant Structures.
I.
Introduction
University of Lampung (Unila) has 31.000 students, 1300 lecturers and 645 academic staff that used the internet daily. UPT TIK should provide internet services. It has Network Operation Centre (NOC), consists of several servers and network devices. The entire network infrastructure is managed by Divisi Infrastruktur with only 4 administrators. Unila is also facing on electricity problem. Located in the Southern of Sumatera Island
Indonesia, some times the blackouts happens. Data center manager’s must be able to provide excellent services to customers in electricity and internet connection. Electrical and internet problems must be maintained
properly, and its quality must be monitored any time in order to carry out preventive and corrective measures in the event of disruption or unconditional incident.
This study makes an online system to monitor electrical quantities, temperature and bandwidth in data centers building, so the manager is able to take desicion against these conditions.
Mini single board computer Broadcom BCM2835 SoC, ARM11767JZF-S 700 MHz processor (Raspberry Pi model B) is a major component used in this study. Raspberry Pi serves as an interface to get the data of electrical quantities, temperature and bandwidth as well as save data.
II.
Procedure
2.1. Smart Monitoring System
The next-generation monitoring should give the information required by users, information must be compact with SMART concept specific, measurable, achievable, relevant, time-bound [17].
2.2. Electrical Quantities
Electrical Voltage is the amount of work required to move an electrical charge from one point to another, while the electric current is defined as the amount of charge that flows due to the flow of electrons per unit time. Electrical Power is the amount of electric power that flows per unit time, calculated in units of joules /second or watts by using the following equation [6]:
=
where : P = Power (Watt or W) V = Voltage (Volt or V) I = Current (Ampere or A)
The theory above is for power systems of direct current, whereas the electric power system of alternating current, the power can be divided into three types, namely: the real power that the electric power used load or electrical equipment to do the work, this power is the product of voltage, current and power factor (cos ¢), apparent power is the product of voltage and current, while the reactive power is the power that is used to generate mechanical power and heat, this power is the product of voltage, current and power factor ( sin ¢). Phasa angle ¢ greatly influenced by the type of load is attached, if the load is resistive then the current will same phase with voltage (¢ = 0), if the load is inductive phase currents will be left behind (lagging) of the phase voltage of 90° (¢ = 90°), while if the load is capacitive current phase will go ahead (leading) of the phase voltage of 90° (¢ = 90°). However, generally load is a combination of all three types of load, so that the current and voltage have a phase angle difference of ¢, so the power factor is cos ¢.
2.3. Room Temperature
Data centers building has servers that should be online for 24 hours potentially produces a heat temperature in the room. If the heat is excessive, it can causes the server to damage. Therefore the rooms must always be kept in accordance with the allowed standard conditions. According to the Cisco standardization temperature, the ideal temperature in data center room is at least 18oC and 27oC maximum [2].
2.4. Bandwidth
Bandwidth is often used as a synonym for data transfer rate, which is the amount of data that can be taken from a point to another within a certain period (generally within seconds). Bandwidth is usually measured in bps (bits per second). In general, the connection with large bandwidth/high capacity will be capable to deliver of large information. There are several terms associated with a bandwidth that is:
A. Bandwidth Monitoring System
Simple Network Management Protocol (SNMP) is a protocol with basic methods for controlling the TCP/IP network or network device. SNMP is designed to provide network management services, so that users can maintain and systematically monitor the computer network remotely.
B. Internet Control Message Protocol (ICMP)
C. Packet Internet Groper (PING)
PING is a utility that can verify the TCP / IP installed, connecting to the NIC, configuration checking, and communication with the network. It is often used in TCP / IP configuration or there is something wrong with network connectivity.
2.5. Raspberry Pi
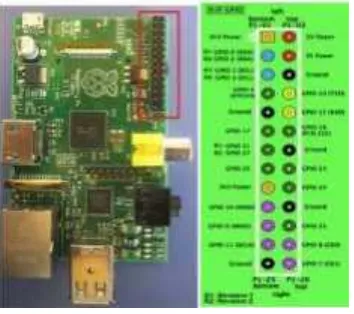
Raspberry Pi is an embedded computer that was developed by the Raspberry Pi Foundation, which has a function similar to the PC (Personal Computer) in general. Mini Computer model has two types, namely type A and type B. The difference among them is in memory, the number of USB ports, and network adapter. Raspberry Pi comes with the General Purpose Input/output (GPIO) pins that each of its can be set as an input or output. Through GPIO, Raspberry can accept various inputs to do the programming. Input can be a wide variety of sensors such as a temperature sensor, light sensor, voltage sensor, etc.
Fig 1. Raspberry Pi GPIO
2.6. Related Works
The earlier study used as reference is on [6]. This study has made a prototype device that can monitor the amount of electrical. Uunfortunately, the current measurement captured process must cut off the power of the panel and if there is any abnormal event, the risk of damage can be occur on prototype. Therefore this research is developed further by using a sensor that can perform measurements without having to cut off the power from the distribution panel so that in case of an abnormal situation, it will not damage the equipment. Furthermore, previous research on temperature monitoring and termination of the electrical connection has also been done in [7]. This study makes a prototype system that can be monitor the temperature scale in the data center and monitor power conditions. The study on [4][5][18], explains how the online monitoring of the power system by using sample data that is recorded on the PMU are placed at various locations with the same frequency. The studies contributed to monitoring the stability of the voltage and frequency of the power system. Preliminary research on the design of a monitoring system using a Single Board Computer BCM2835 is on [8]. While [1] discuss about a prototype of power flow breaker household scale. This tool is able to cut, connect, and send status is active or not active flow of electric power to the connected load of up to 2.2 Kw. Study on [3] and [13] discuss the monitoring of voltage, current and power by using a microcontroller Atmega 16 as a control system.
using SMS (Short Message Services). Another of important previous study is related to the presentation of information and the manufacturing quality and interactive web services as an interface to the results of monitoring can be displayed properly, complete and accurate. The studies related on this were on [11] and [12]. Based on the studies that have been done previously on-line monitoring system for a variety of purposes, using a variety of methods and tools, it is expected to be a valuable experience both in the analysis, design and implementation in the field.
III.
Research Methodology
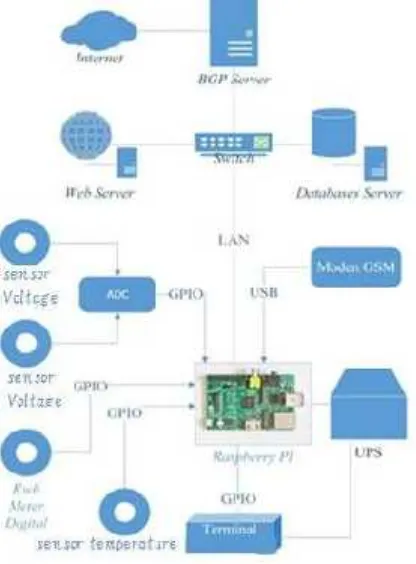
Fig. 2. show the hardware design architecture of system monitoring, from the diagram show the system used 4 type of sensor that is temperature sensor, voltage sensor, current sensor, and KwH meter that those will connected to main control device BCM 2835 (Raspberry Pi) through the GPIO pin. The current, voltage, power, and temperature data will be saved on to database server in real time, MySQL used as data base server engine.
The gathered data will be proceed by the system and shown as a web page and displayed as a historical chart statistic that can be access by users using web browser.
IV.
Results and Dsicussions
4.1. Development and Implementation
Based on observations and interviews to UPT TIK Manager, the system monitoring should be able to show a real time report and can be accessed through website, system also automatically generates report. Web-based live monitoring created using Python Programming Language, javascript, and html. Data charts graphic should be in realtime and updated every 3 seconds.
(a) Life Web Base Report for Electric Quantities (b) Life Web Base Report for electricity, temperature, network utilization
Fig 3. (a)(b) Application Report
Fig. 3. shows the application report on real time condition, data capture is every 3 second and the system generates the graphics on web application.
4.2. Monitoring of Electrical Quantities
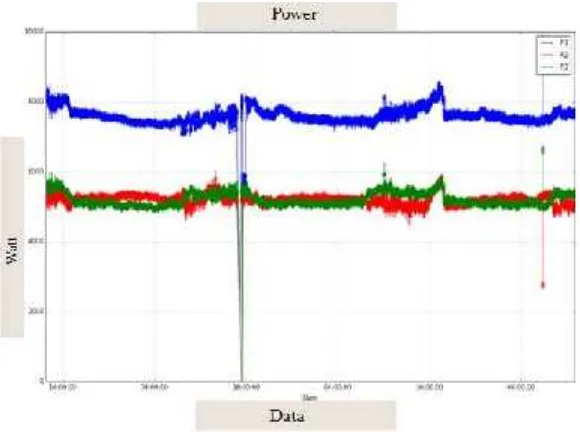
The monitoring of Electrical Quantities implementations are displayed in graphical form below. Monitoring charts for each quantities is shown in Fig. 4, Fig. 5, and Fig. 6.
The graph of power monitoring shows that on Phase 1 that is highly loaded with average 8.000 Watt, phase 2 and phase 3 energy consumption was lower than Phase 1.
Fig 5. Voltage Monitoring Implementation
On Fig. 5. shows that phase voltage tends to be stable in range between 200 V to 230 V.
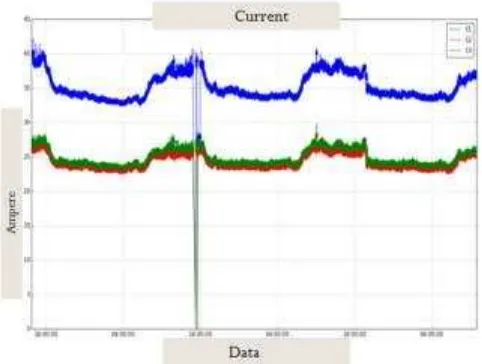
Fig 6. Current Monitoring Report
Fig. 6. shows report of current value, it shows that current on Phase 1 was the highest current as compared with other current on Phase 2 or Phase 3. This data is in line with power consumption report on Fig. 4.
4.3. Bandwidth Monitoring
Fig 7. Daily Bandwidth Usage Statistic
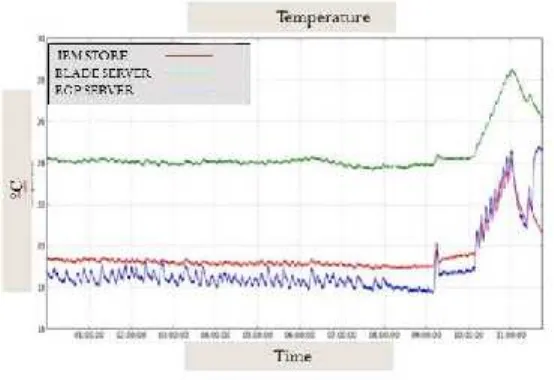
4.4. Temperature Monitoring Implementation
Dallas sensor DS18B20 is used to get temperature data, consist of 3 units placed on different place on Data Centre room , maximum temperature above 28.13oC , the lowest temperature of 16.8oC. High temperature happened because all of Air Conditioner (AC) on Data Centre room didn’t work. as well.
Fig 8. Temperature Report
V.
Conclusions
References
[1]. Besma, D Despa, Noer. S,“Rancang Bangun Alat Pemutus Aliran Daya Listrik Melalui Fasilitas S MS Berbasis Mikrokontroler”, JITET, 2013.
[2]. Cisco, "Data Center Power And Cooling," White Paper, p. 3, 2011.
[3]. D. A. Rusti, A. R. Nansur and M. Safrodin, "Monitoring Pemakaian Energi Listrik Berbasis Mikrokontroler Secara Wireless," EEPIS Repository, 2011.
[4]. Dikpride Despa, Yasunori Mitani, Masayuki Watanabe, Yaser Soleman Qudaih, Taro Fujita, Qing Liu, Michael Bernard, “PMU Based Monitoring and Estimation Power System Dynamic Stability Developed on 50-Hz Power System”, Proceeding of Power and Energy Systems (AsiaPES 2012), 2012. [5]. Dikpride Despa, Yasunori Mitani, Masayuki Watanabe, Changsong Li, “PMU Based Monitoring and
Estimation of Inter-area Power Oscillation for Singapore-Malaysia Interconnection Power System”, Journal of Energy and Power Engineering ISSN 1934-8975, USA, Vol.6, Number 3, Pp.463-468, March 2012
[6]. Dikpride Despa, Ady Kurniawan, M. Komarudin, Mardiana, Gigih F N, “Smart Monitoring of Electrical Quantities Based on Single Board Computer BCM2835”, Procedings ICITACEE 2015, The 2nd International Conference on Information Technology, Computer dan Electrical Engineering, Semarang, 2015.
[7]. Gigih Forda Nama, Hery Dian Septama, Lukmanul Hakim, dan Muhamad Komarudin “Rancang Bangun Sistem Monitoring Sambungan Internet Universitas Lampung Berbasis Mini Single B oard Computer Bcm2835”, Prosiding Seminar Nasional Sains & Teknologi V, 2013.
[8]. Gigih F N, M Komarudin, Hanang P, Mardiana, and Hery D S, "Electricity, Temperature, and Network Utilization Monitoring at Lampung University Data Centre Using Low Cost Low Pow er Single Board Mini Computer", International conference RC-CIE, Yogyakarta Indonesia, 2014. Pp 184-189, 2014.
[9]. Kortuem, G., Kawsar, F., Fitton., D., Sundramoorthy, V.,“Smart objects as building blocks for the internet of things. Internet Computing”, IEEE, vol. 14, no.1, 44-51 (2010)
[10]. Mardiana, Wahyu Eko S, et.al,“Sistem Monitoring Server Berbasis SMS (Studi Kasus : Server Siakad Unila)”, Electrician, Jurnal Rekayasa dan Teknologi FT Unila Vol.2.No.3, 2008.
[11]. Wahyu Eko S, Mardiana, Nasrul Fatoni, “Web Service Sebagai Penyedia Layanan Pada Sistem Informasi Manajemen Jurusan”, Electrician, Jurnal Rekayasa dan Teknologi FT Unila, Vol.3.No.3 , 2009.
[12]. Mardiana, Araki, K., Omori, Y., “ MDA and SOA approach to development of web application interface“, Proceeding of International Conference on TENCON 2011, IEEE, 2011
[13]. Muhammad Arif, Dikpride Despa, et.al, “Rancang Bangun Pengatur Suhu ruangan Tanaman Jamur Tiram Menggunakan Mikrokontroller Atmega16”, Jurnal Ilmiah Teknik Pertanian (TekTan), Vol 4, 2012
[14]. Reza Pradikta, Achmad Affandi, Eko Setijadi,”Rancang Bangun Aplikasi Monitoring Jaringan dengan Menggunakan Simple Network Management Protocol”, TEKNIK POMITS, vol. 2, no. 1, pp. A 154 - A 158, 2013.
[15]. Riyanto and R. O. Wayagi, "Sistem Monitoring Suhu Ruang Server Berbasis Web dengan Menggunakan EZ430," Jurnal Ilmiah, vol. 2, no. 1, pp. 50-54, 2011.
[16]. Rusfita Rahayu, Idris Winarno, ”Aplikasi Management Bandwidth Berbasis Web Menggunakan Pengalamatan IPv6, Jurnal Ilmiah, vol. 2, no. 1, 2011.
[17]. Pei Zhang, Fangxing Li, and Navin Bhatt,“Next-Generation Monitoring, Analysis, and Control for the Future Smart Control Center”IEEE.