Shirkah
Journal of Economics and Business
Shirkah
Journal of Economics and Business
Vol. 1, No. 2, May-August 2016 ISSN: 2503-4235 (p); 2503-4243 (e)
Editor in Chief Sri Walyoto
Editorial Boards
Abu Umar Faruq Ahmad, UBD School of Business and Economics, Brunei Darussalam
Amelia Fauzia, Asia Research Institute, National University of Singapore, Singapore
Cedomir Nestorovic, ESSEC Business School Asia Pacific, Singapore
Dwi Condro Triono, Faculty of Islamic Economics and Business, IAIN Surakarta, Indonesia
Fahmy Radhi, Faculty of Economics and Business Universitas Gadjah Mada, Yogyakarta, Indonesia
Hasan Basri, Syiah Kuala University, Aceh, Indonesia
Jaka Sriyana, Faculty of Economics, Universitas Islam Indonesia, Yogyakarta, Indonesia
Johan Fischer, Department of Social Sciences and Business Roskilde University, Denmark
Masudul Alam Choudhury, Postgraduate Program in Islamic Economics and Finance, Trisakti University, Jakarta, Indonesia and the College of Economics and Political Science (CEPS) in Sultan Qaboos University (SQU), Oman
M. Falik Isbah, School of Humanities and Social Science, University of New South Wales, Australia
M. Ishaq Bhatti, La Trobe Business School Department of Economics and Finance La Trobe University, Australia
Nunung Nurul Hidayah, Aston Business School, Aston University, Birmingham, United Kingdom
Najib Kailani, Pascasarjana, Universitas Islam Negeri (UIN) Sunan Kalijaga, Yogyakarta, Indonesia
iii
Managing Editors M. Endy Saputro M. Zainal Anwar
Assistant to Editor Supriyanto
Shirkah Journal of Economics and Business is a peer-reviewed journal published three times a year (January-April, May-August and September-December) by Faculty of Islamic Economics and Business, Institut Agama Islam Negeri (IAIN/ State Institute for Islamic Studies) Surakarta Central Java, Indonesia. The main objective of Shirkah is to offer an academic space of exchange ideas and initiate the increase number of qualified article produced by postgraduate students, practitioners and academicians.
Editorial Office
Ruang Jurnal Shirkah
Lantai Dasar, Sayap Barat, Fakultas Ekonomi dan Bisnis Islam, IAIN Surakarta
Jln. Pandawa No. 1, Kartasura, Sukoharjo, Jawa Tengah Kode Pos. 57168 Phone (+62271) 781516 Fax: (+62271)782336
v
Shirkah
Journal of Economics and Business
Vol. 1, No. 2, May-August 2016 ISSN: 2503-4235 (p); 2503-4243 (e)
Table of Contents
Articles
Tajus Subqi 133
The Jakarta Islamic Index-LQ 45: Rate Financial Performance, Beta Stocks and Stock Price on the Indonesian Stock Exchange
Reskino 161
Zakat and Islamic Corporate Social Responsibility: Do These Effect the Performance of Sharia Banks?
Hafiez Sofyani 185
Mahartika Retno Febri Anggraini Sabrina Ayunani
Islamic Education Mentoring Program and the Religiosity of Prospective Accountants
Ika Dewi Hartutik 207
Kartika Hendra Endang Masitoh
How does Student Interest Effect Participation in Pursuing Education for the Accounting Profession (PPAk)?
Roikhan MA 223
BAZIS Scholarship Funds and Student Achievement
Abel Gandhy 241
BAZIS Scholarship Funds and Student Achievement
Roikhan MA Faculty of Economics and Business,
Universitas Islam Negeri (UIN) Syarif Hidayatullah Jakarta
Abstract
This research aims to analyze the effect of the distribution of BAZIS (Council for Zakat Administration) scholarship funds on student achievement in East Jakarta. Data has been gathered from BAZIS scholarship recipients in the period 2014 to 2015, with the sample selected by means of random sampling. Validity, reliability, classic assumption, different and multiple regression tests are employed to analyze the data. The results statistically show that the variables of achievement can be explained by distribution variable, usage pattern, controlling and gender in the amount of 96,6% and the remaining 3,4% is influenced by other variables. This research argues that independent variables have significant effect on student learning achievement.
Keywords :learning achievement, BAZIS, zakat
After more than half a century of independence Indonesia as a nation has not been able to rise to the status of a developed country with a prosperous population. With a population of more than 200 million inhabitants, and average economic growth of 5.8 % per year, the welfare of the population is not yet guaranteed. Many people are still living under the poverty line. Based on data from Badan Pusat Statistik (BPS) “Central Statistics Agency”, the number of poor in September 2014 was 27727.78 million or 10.96 % of the population. This illustrates that government programs for poverty reduction are still not reaching those most in need.
Shirkah
Journal of Economics and Business
ISSN: 2503-4235 (p); 2503-4243 (e)
224 Roikhan MA
Vol. 1 No. 2, May - August 2016 Article 34 paragraph (1) of the Act of 1945 states that, “The poor and abandoned children be reared by the state”. In reality, however, the number of people living in poverty in Indonesia is evidence that state ideals to achieve social justice for all Indonesian people have yet to be realised. Jakarta, the nation’ capital, has a significant poor population. Poverty in DKI has increased from the previous year, while data from LPS until 31 December 2013 shows that the number of rich people in Indonesia has also increased.
Table 1. Poor Population and Percentage of Poor People Jakarta in September 2013 - March 2014 - September 2014
Month Number of Poor Percentage of Poor People
September 2013 371,70 3,72
March 2014 393,98 3,92
September 2014 412,79 4,09
Source: BPS Jakarta (processed)
If seen from the number of bank accounts with funds over Rp 5 billion, these have increased in number by almost three thousand per month. In November 2013, the number of accounts over Rp5 billion increased by 63.406 accounts. In December, the number of accounts with over Rp 5 billion jumped to 66 567 ones. In fact, the majority of wealthy Indonesians reside in Jakarta. The income gap is extraordinary, illustrating that the enormous economic growth Indonesia is experiencing is not equitable.
BAZIS Scholarship Funds and Student Achievement 225
Vol. 1 No. 2, May - August 2016
faced by Indonesians. Poverty alleviation requires cooperation from various parties, both government and society, because eradicating poverty is a shared responsibility and a form of social solidarity.
Relating to education, a high poverty rate does not support people to get an education. The progress of a nation is directly proportional to the quality of and access to education. There are still many people who do not have access to education in Indonesia. The proportion of state funding allocated to education has not yet reached its goal of 20% of the budget. There are still many children who drop out of school or who no longer go to school because of the high school fees. This is despite the fact that education is an investment in the future survival of the nation.
The current Minister of Research, Technology and Higher Education, M. Nasir (2014), in XII Congress of Indonesian Accountants Association in Jakarta, states that budget allocation for education in Indonesia is still inferior to that of Malaysia. In fact, the percentage of budget allocated to education (0.09 percent of GDP) in Indonesia has not yet reached one percent of the Gross Domestic Product (GDP). Malaysia allocates one percent, Thailand 0.25 percent, and Singapore has increased its funding from 2.14 to 2.16 percent. Sources of education funding are largely from within the business sector globally, providing up to 80 % of education funding, while in Indonesia 74% on the responsibility for education funding is with the government.
226 Roikhan MA
Vol. 1 No. 2, May - August 2016 that people do not have to fret over the cost of educating their children to high school (SMA) graduation level, most companies require a minimum Tier One (S1) or undergraduate level education.
Referring to the Central Statistics Agency (BPS) in 2012, of the 4.8 million Indonesian students aged 19-24 years, the participation rate reached 18.4 percent. Of the 4.8 million students about 6.5 percent are underprivileged students who drop out of college. To overcome this problem the Ministry of Education and Culture provided scholarships to 88 142 students in the 2012/2013 academic year. The program is expected to encourage Indonesian youth so that they can continue their education to complete an undergraduate degree without worrying about the cost of education.
In general, the cost of evaluating the existing education system and developing good learning outcomes requires infrastructure and is dependent on the number of existing funds. Achievement of good learning outcomes in education requires provision of appropriate learning facilities, conducive learning contexts, libraries, books, stationery and other learning facilities, so that the educational results obtained will be optimal. One way to reduce the constraints on students is through provision of scholarships. Recognizing the importance of education, many governmental institutions provide funds for education in the form of scholarships for children who excel. Examples of government agencies responsible for the administration of these are Infaq Amil Zakat and Sadaqah (BAZIS).
BAZIS Scholarship Funds and Student Achievement 227
Vol. 1 No. 2, May - August 2016
performed their tithe obligations for centuries, but less so more recently. Zakat, and the revenue received by amil zakat institutions in Indonesia is vastly different. This disparity between the two may have occurred because many people are not aware of the importance of tithe, despite the Islamic teachings on ZIS, and how we can improve the lives of the poor and the general welfare of the population. Tithe and donations are not solely for the purpose of vertically worshipping the Almighty, but horizontally can bring about positive changes in society.
In accordance with Law No. 38, 1999, on the management of zakat, the institutions given the mandate to manage zakat are Badan Amil Zakat (BAZ) “the Amil Zakat agency” and Lembaga Amil Zakat (LAZ) “the Amil Zakat Institution”. The Amil Zakat Agency is an institution of tithe (voluntary tax for religious/Muslims of up to 10% of income) management by the government. The Institute of Tithe presides over tithe management institutions established within Indonesian society (ZIS Management, 2006, p. ix). Bazis in Jakarta also has an educational program providing scholarships for high academic achievers from low socio-economic groups. These scholarships are expected to help children complete high school and go on to college. The majority of the money for the scholarship fund comes from tithe, infaq (monetary gift without reward) and alms (ZIS) given by people who are able (muzaki) to donate tithe amil and which are channeled back to people in need (mustahik).
228 Roikhan MA
Vol. 1 No. 2, May - August 2016 for the people of Jakarta. Bazis DKI has continually helped the Jakarta provide assistance to the people through community programs.
The decree of the Provincial Governor of Jakarta No. 121 of 2002 on the management pattern of ZIS BAZIS at the provincial level in Jakarta prioritized three objectives. Firstly, to improve services for people through regular tithe, donations, and alms in accordance with the guidance of religion. Second, to increase the function and role of religious institutions in an effort to improve the people’s welfare and support justice social. And third, to increase the effectiveness and efficiency of tithe, donations, and Sadaqah. Tithe can be an alternative to reaching economic equality if managed properly. It has great potential that has not yet been optimized. If all Muslims of reasonable income were to pay zakat, the funds could be used to build various facilities related to the economic improvement of the people.
A study conducted in 2012 by Yono Julianto discusses the influence of scholarships on the learning outcomes of students majoring in civil engineering of X university. Based on these results, it can be deduced that there are significant effects on the learning outcomes of students. The average GPA of students having received scholarships was higher than the average student before receiving a scholarship in 2012. The difference between this study and previous research is the location of research. This research was carried out in East Jakarta with the object of research being students receiving the Bazis scholarship fund.
Linking Variables
BAZIS Scholarship Funds and Student Achievement 229
Vol. 1 No. 2, May - August 2016
simple random sampling. According to Kartono (1990, p. 137), in random sampling each member of the population has the same possibility and opportunity to be selected as a member of the sample.
Data were collected using primary data through the distribution of questionnaires. For analysing data, technically, some test was carefully used in this research. Descriptive statistics, according to Jogiyanto (2007, p. 163), descriptive statistics is a statistical portrait of the phenomenon or the characteristics of the data. Characteristics of the data illustrate a characteristic distribution. Reliability and validity, a validity test is used to measure whether questionnaires are legitimate or valid or not. A questionnaire is said to be valid if the questions of the questionnaire were able to express something that is measured by the questionnaire. In other words, the validity test is used to measure whether the questions in the questionnaire we devised do in fact measure what we want to measure.
According to Ghozali (2011, p. 52), criteria for testing the validity of the test are as follows:
• If the count r> r table (test 2 sides to 0.05), the question items correlated significantly to the score or the total value (declared invalid).
• If the count r <r table (test 2 sides with 0.05), then the question items did not correlate significantly to the score or the total value (declared invalid).
Hahslm method is a genuine method of Islam as derived from the Quran Surah Al-Hijr (15): 87 that God provided Off-repeated (verses) which translates into factorization of the Hahslm 7-2-3-1-9 pattern.
Formula: H = ah (slm) Where:
230 Roikhan MA
Vol. 1 No. 2, May - August 2016 s = variable (test T)
l = absolute value (test R) m = weight of
The existing economy acknowledges material issues only. Conventional economics is not like that. Every economic activity is certainly going to impact a variety of other sectors. A two-dimensional map of general economic concepts is as follows:
Supply Demand Curve in Islamic Economics
Meanwhile, Islamic economics considers the issue more broadly. Economic problems must also be seen from the extra dimension of worship and other variables. Furthermore, the three-dimensional economic concept of Hahslm, supports that every economic activity be in accordance with the instructions of Allah and everything done should always be permitted by God.
BAZIS Scholarship Funds and Student Achievement 231
Vol. 1 No. 2, May - August 2016
Table 2. Variable of Religious Variable
H A H S L M
Result Significance + / - Variable, sub variable
A b s o l u t e
value Weight
Source: Data Proceed, 2015
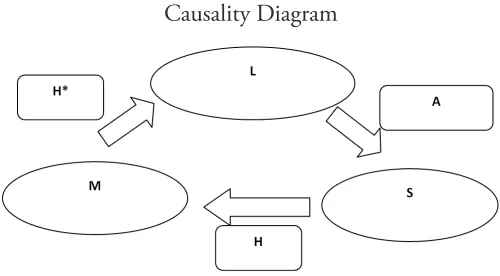
Causality test illustrates the relationship between the dependent variable and the independent variable. The diagram below shows the relationship between the dependent variable as a result of the independent variables that are part of the study.
Causality Diagram
232 Roikhan MA
Vol. 1 No. 2, May - August 2016 Green Test Green Test is undertaken to propose an operationalization design of variables. Classical assumptions test, according to Algifari (2013, p. 83), the regression model obtained from the method of ordinary least squares (Ordinary Least Squares/OLS) is a regression model that produces a best linear unbiased estimator (Best Linear Unbias Estimator/BLUE). A good regression model is a regression model that produces a linear estimation that is not biased (Best linear Unbias Estimator/ BLUE).
Normality test, normality test aims to test whether the residual value is normally distributed or not between the dependent variable and independent variables. A good regression model is to have a residual value that is normally distributed. Multicollinearity test is the condition of the linear relationship between the independent variables. Because it involves several independent variables, multicolinierity will not occur in a simple regression equation (which consists of one independent and one dependent variable) (Winarno, 2011, p. 51). Heteroscedasticity test aims to test whether the regression model showed inequality in variance of residuals from one observation to another (Ariefianto, 2012, p. 37).
BAZIS Scholarship Funds and Student Achievement 233
Vol. 1 No. 2, May - August 2016
whether these variables have a significant impact on the dependent variable or not (Suliyanto, 2011, p. 55). (2) Simultaneous test (F-test); F-test was used to evaluate the effect of all independent variables on the dependent variable (Widarjono, 2010, p. 22). Tests on the influence of independent variables jointly (simultaneously) to changes in the value of the dependent variable are done through tests on the magnitude of changes in the value of the dependent variable that can be explained by changes in the value of all the independent variables. (3) The coefficient of determination test (R2); coefficient of determination (R2) is used to measure how well the regression line fits the actual data (goodness of fit). The coefficient of determination measures the percentage of the total variation in the dependent variable Y that is explained by the independent variable in the regression line (Widarjono, 2010, p. 19).
Different test is used to compare the average value as well as the confidence interval specified (confidence interval) of two populations. The principle of the test two averages is in seeing differences in the two groups of data variation. In using t-test there are several requirements that must be met. The term/main assumption, as mentioned SPSS module of UIN Jakarta, that must be met is that the data should be normally distributed. To test the quality of primary data the researchers used validity and reliability. The data processing was done electronically using SPSS 20 to accelerate the results that could explain the variables to be studied. The discussion covers descriptive statistical, classic assumption test, test and different statistic tests.
Analyzing Learning Achievement
234 Roikhan MA
Vol. 1 No. 2, May - August 2016 Table 3. Descriptive Statistics
N Minimum Maximum Mean Std.
Deviation Learning
achivement
50 24 45 36.88 4.331
Distribution 50 23 45 38.10 4.875
Beneficial Pattern 50 29 45 37.18 3.735
Control 50 20 35 28.08 2.920
Gender 50 1 2 1.70 .463
Valid N (listwise) 50
Source: Primary data were processed in 2015
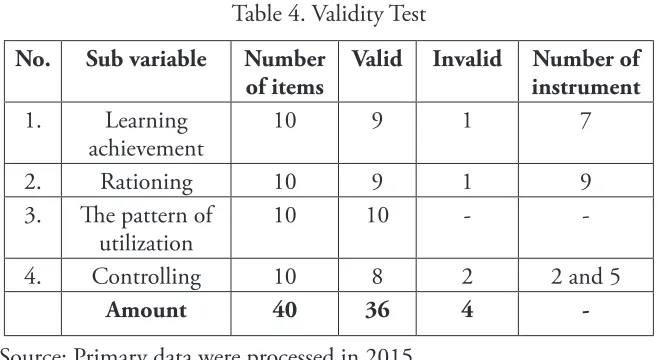
To test the quality of primary data, the researchers using
validity test and reliability. Validity test, by using a two tailed test with significance level 5% then the value of r tables in this study is 0,444. The items statement is considered valid if value of r calculate > than r
table.
Table 4. Validity Test
No. Sub variable Number of items
Valid Invalid Number of instrument
BAZIS Scholarship Funds and Student Achievement 235
Vol. 1 No. 2, May - August 2016
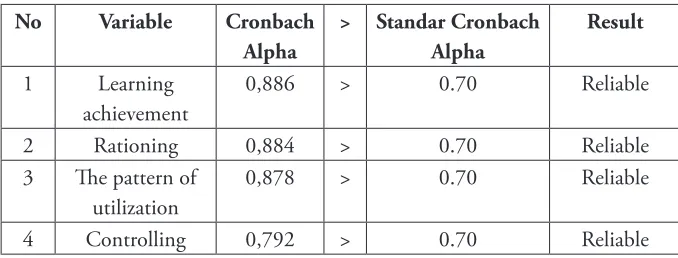
Reliability test results show that the value of Cronbach Alpha (α) from all the variables is greater than 0.70 and this result can be said to be reliable.
Table 5. The Reliability Test
No Variable Cronbach
2 Rationing 0,884 > 0.70 Reliable
3 The pattern of utilization
0,878 > 0.70 Reliable
4 Controlling 0,792 > 0.70 Reliable
Source: Primary data were processed in 2015
Classical assumption test; a model is said to be good as a prediction tool if it has the properties of not being biased. Regression analysis of correlation requires various assumptions so the model can be used as a good predictor. Thus, measures included in classical assumption are: Normality Test; this research uses the statistical test of the Kolmogorov-Smirnov test. Based on the table, it shows that the value of K-S in Asymp Sig. (2 tailed) is 0,634 which is greater than 0.05 as can be deduced from the calculation of normal distribution of data normality test. Based on residual normality test results, the graph for P-P Plot is normal in figure 4.1, as the dots are normally distributed spread around the diagonal line.
236 Roikhan MA
Vol. 1 No. 2, May - August 2016 Multiple linear regression test (OLS), based on the results of the regression analysis, a regression line as follows was obtained Y = -5,956 + 0,187+0,750+0,252+0,421 + e. Partial Test (Uji-t) is used to determine the effect of each independent variable on the dependent variable. To compare the value of significance with a significance level of 0.05 four variables have a significant influence on learning achievement (Y). T-table value for n 50 is equal to 2.009. The F test can be seen in the table ANOVA of the results of multiple linear regression. By using a sample of 50 and 95% confidence level the importance of the F table value is 2.30. Based on the results of the calculations of the simultaneous test (F-statistic), because F count > F table 349,130 > 2,30 with significance value 0,000 which means below 0.05 significance value. This means the independent variable distribution, utilization pattern, controlling and gender simultaneously (together) had an influence on learning achievement.
Determinant Coefficient Test (R2) essentially measured the ability
of the model to explain variations in the dependent variable (Ghozali, 2013, p. 97). The value of Adjusted R-squared (R2) shows that the influence
BAZIS Scholarship Funds and Student Achievement 237
Vol. 1 No. 2, May - August 2016 Conclusion
Based on the results of multiple linear regression (OLS), distribution, utilization pattern, controlling and gender on learning achievement carried, it come to conclude some results. First, based on partial test using t test of the factors: The distribution of variables related to the BAZIS scholarship significantly influence the achievement of those students in receipt of the scholarships, with a level of significance of 0,000.
a. Patterns of utilization variable of BAZIS scholarship bear significant influence on the achievement of scholarship recipients with significance level of 0,000.
b. Controlling of utilization variable of the BAZIS scholarship significantly influenced the achievement of scholarship recipients with significance level of 0,000.
c. Gender variable of the BAZIS scholarship recipients does not significantly affect learning achievement with a significance level of 0.099.
238 Roikhan MA
Vol. 1 No. 2, May - August 2016 References
Al-Ba’ly, Abdul Al-Hamid Mahmud. (2006). Ekonomi Zakat, Sebuah Kajian Moneter dan Keuangan Syari’ah. Jakarta: Raja Grafindo Persada. Algifari. (2013). Analisis Regresi; Teori, Kasus, dan Solusi. Yogyakarta: BPFE. Al-Zuhaili, Wahbah. (2005). Zakat Kajian Berbagai Mazhab. Bandung:
Remaja Rosda Karya.
Ali, Mohammmad Daud. (1988). Sistem Ekonomi Islam Zakat Dan Wakaf. Jakarta: UPRESS.
Ariefianto, Moch. Doddy. (2012). Ekonometrika Esensi dan Aplikasi dengan Menggunakan Eviews. Jakarta: PT.Gelora Aksara Pratama.
Badriadi, Lili. (2005). Zakat Dan Wirausaha. Jakarta: CV Pustaka Amri. BAZIS DKI Jakarta. (1999). Manajemen Zis Bazis Propinsi DKI Jakarta.
Jakarta: BAZIS DKI Jakarta.
BAZIS DKI Jakarta. (1999). Pengelolaan Zakat dan Infak/Sedekah di DKI Jakarta. Jakarta: BAZIS DKI Jakarta.
BAZIS DKI Jakarta. (2006). Manajemen ZIS BAZIS Provinsi DKI Jakarta. Jakarta: BAZIS DKI Jakarta.
Bungin, Burhan HM. (2010). Penelitian Kualitatif. Jakarta: Kencana Prenada Media Grup.
Depdikbud. (1988). Kamus Besar Bahasa Indonesia. Jakarta: Balai Pustaka. Direktorat Jenderal Bimbingan Masyarakat Islam- Direktorat
Pemberdayaan Zakat. (ND). Panduan Organisasi Pengelola Zakat. Jakarta: NP.
Ghozali, Imam. (2011). Aplikasi Analisis Multivariate dengan Program SPSS 19. Semarang: Universitas Diponogoro.
BAZIS Scholarship Funds and Student Achievement 239
Vol. 1 No. 2, May - August 2016
Hasan, Muhammad. (2011). Manajemen Zakat Model Pengelolaan yang Efektif. Yogyakarta: Idea Press.
Idrus, Muhammad. (2009). Metode Penelitian Ilmu Sosial. Yogyakarta: Erlangga.
Indrianti, Dhola Rosa. (2009). Pengaruh Beasiswa terhadap Motivasi dan Prestasi Belajar Mahasiswa Fakultas Ekonomi Universitas Negeri Malang, Skripsi. UIN Malang.
Jogiyanto. (2007). Metodologi Penelitian Bisinis: Salah Kaprah dan Pengalaman-Pengalaman. Yogyakarta: BPFE.
Julianto, Yono. (2014). “Pengaruh Pemanfaatan Beasiswa dengan Hasil Belajar Mahasiswa Jurusan Teknik Sipil FT-UNP,” Cived Journal of Civil Engineering and Vocational Education Vol 2, No. 2.
Kartini, Kartono. (1990). Pengantar Metodologi Riset Sosial. Bandung: Mandar Maju.
Kuncoro, Mudrajat. (2003). Metode Riset untuk Bisnis dan Ekonomi. Jakarta: Erlangga.
Mas’udi, Farid Masdar, dkk. (2004). Reinterpretasi Pendayagunaan ZIS: Menuju Efektivitas Pemanfaatan Zakat, Infaq, Sedekah. Jakarta: Pirac. Modul SPSS FEB UIN Jakarta.
Nachrowi, Nachrowi Djalal dan Hardius Usman. (2002). Penggunaan Teknik Ekonometri. Jakarta: Raja Grafindo Persada.
Nagari, Yudi Bakti. (2012). Analisis Kontribusi Pemberian Beasiswa Djarum terhadap Peningkatan Prestasi Akademik Mahasiswa Penerima Tahun Angkatan 2010/2011 Daerah Istimewa Yogyakarta. Skripsi. Universitas Negeri Yogyakarta
Ngalim Purwanto. (1990). Psikologi Pendidikan. Bandung: Remaja Rosdakarya.
240 Roikhan MA
Vol. 1 No. 2, May - August 2016 Riana, Rini. (2013). Pengaruh Kedisiplinan Belajar dan Jenis
Kelamin Terhadap Hasil Belajar Matematika Pada Siswa SMP Negeri 1 Pucakwangi Pati Tahun Ajaran 2012/2013, Universitas Muhammadiyah Surakarta 2013. Naskah Publikasi. Universitas Muhammadiyah Surakarta, accessed 21 March 2016.
Rosadi, Dedi. (2012). Ekonometrika dan Analisis Runtun Waktu Terapan dengan Eviews. Yogyakarta: Andi.
Slameto. (2010). Belajar dan Faktor-Faktor yang Mempengaruhinya. Jakarta: Rineka Cipta.
Sugiyono. (2010). Metode Penelitian Kuantitatif Kualitatif dan R&D. Bandung: Alfabeta.
Suliyanto. (2011). Ekonometrika Terapan: Teori dan Aplikasi dengan SPSS. Yogyakarta: ANDI.
Sudirman. (2007). Zakat dalam Pusaran Arus Modernitas. Malang: UIN-Malang Press.
Utomo, Pramudi. (2010). Analisis Kontribusi Pemberian Beasiswa Terhadap Peningkatan Prestasi Akademik Mahasiswa Fakultas Teknik Universitas Negeri Yogyakarta. Article, accessed from http://staff. uny.ac.id/sites/default/files/131576241/Artikel_jurnal_Analisis%20 Kontribusi%20Beasiswa_0.pdf on 05 April 2016
Widarjono. (2010). Analisis Statistika Multivariat Terapan. Yogyakarta: UPP STIM YPKN.
Winarno, Wing Wahyu. (2011). Analisis Ekonometrika dan Statistika dengan Eviews. Yogyakarta: UPP STIM YKPN.
Website