Strat. Mgmt. J.,36: 598–617 (2015) Published online EarlyView 5 February 2014 in Wiley Online Library (wileyonlinelibrary.com) DOI: 10.1002/smj.2226 Received 9 August 2011;Final revision received 15 November 2013
BEYOND INSTITUTIONAL VOIDS: BUSINESS
GROUPS, INCOMPLETE MARKETS,
AND ORGANIZATIONAL FORM
K. S. MANIKANDAN1* and J. RAMACHANDRAN2
1Corporate Strategy and Policy Area, Indian Institute of Management
Tiruchirappalli, Tiruchirappalli, India
2Corporate Strategy and Policy Area, Indian Institute of Management Bangalore,
Bangalore, India
We extend the “institutional voids” perspective on business groups by examining the value-adding potential of two of the characteristic features of business groups: their diverse portfolio and multi-entity organizational form. We maintain that portfolio diversity affords affiliates privileged access to opportunities hidden by incomplete strategic factor markets. We hypothesize that the multi-entity organizational form enables superior sensing and seizing of these growth opportunities by affiliate firms. We further suggest that, in the context of institutional reforms, these characteristics strengthen business group affiliates’ ability to capitalize on the expanded set of opportunities made available by the reform program. Empirical analyses on a sample of Indian firms over the period 1994–2010 support our hypotheses. Implications for theory and future directions are discussed. Copyright2013 John Wiley & Sons, Ltd.
INTRODUCTION
How do business groups add value? This question has been central to research on business groups, an organizational form that is widely prevalent in emerging economies (Carney et al., 2011; Chang and Hong, 2000; Khanna and Palepu, 1997, 2000a; Leff, 1978). Defined as a network of legally independent firms, operating in diverse industries, with a common dominant owner, and coordi-nated through multiple formal and informal ties, the dominant explanation currently is that busi-ness groups add value to member firms by filling the voids created by market and institutional fail-ures in emerging economies (Goto, 1982; Khanna and Palepu, 1997; Leff, 1978; Yiu et al., 2007).
Keywords: business groups; institutional voids; organiza-tional form; incomplete markets; India
*Correspondence to: K. S. Manikandan, Indian Institute of Management Tiruchirappalli, Thanjavur Main Road, Thuvakudi, Tiruchirappalli 620 015, India. E-mail: [email protected]
Copyright2013 John Wiley & Sons, Ltd.
However, the persistence of affiliation benefits and growth of business groups in these economies despite widespread improvements in the institu-tional environment (Carney, 2008; Colpan, Hikino, and Lincoln, 2010; Khanna and Palepu, 1999; Kim, Kim, and Hoskisson, 2010; Ramaswamy, Li, and Petitt, 2012; Siegel and Choudhury, 2012), coupled with the presence of business groups in some of the advanced economies of the world with well-developed markets and institutions (Carney et al., 2011; Granovetter, 1995), suggests the need to go beyond the institutional voids hypothesis.
Business Groups, Incomplete Markets, and Organizational Form 599
strategic opportunities hidden by incomplete mar-kets. Next, we build on Penrose’s (1959) observa-tion that the opportunity set of a firm is a funcobserva-tion of the set of possibilities that it can see and which it is willing and able to act on (cf. Ghoshal, Hahn, and Moran, 2000), and suggest that the organi-zational form of business group enables affiliate firms to both sense and seize these opportunities better than if the businesses were organized as divi-sions of a multibusiness firm under a single legal umbrella. We submit that the governance and man-agement structure of the business group—each affiliate firm is legally separate and is responsible to its “own governance bodies including share-holders, directors, and auditors” (Mahmood, Zhu, and Zajac, 2011: 823)—helps overcome some of the challenges associated with managing diver-sified businesses, such as those associated with design of incentive systems and resource alloca-tion. The mitigation of these challenges enables the affiliates to perceive, be motivated, and be able to capitalize on growth opportunities, including the privileged set of opportunities that the diversi-fied resource and knowledge base of the business group puts within their reach. Further, we predict that these twin characteristics— portfolio diversity and multi-entity structure—enable business group affiliates to better sense and seize the expanded set of opportunities in the external environment that typically accompany pro-market institutional reforms in an emerging economy. We test our pre-dictions on a panel of business group affiliate and nongroup firms from India for the time period 1994–2010.
This research study makes three important con-tributions to the business group literature. First, we draw attention to the two widely acknowledged yet underexplored characteristic features of busi-ness groups—their diverse portfolio and distinct organizational form—and examine their value-adding potential. Second, by focusing on the inher-ent incomplete nature of markets and the atten-dant strategic opportunities they afford, we further our current understanding of business groups that is largely anchored on underdeveloped markets and weak institutions. Third, we present business groups as an exciting research context for schol-ars interested in energizing the traditional debate around the linkage between strategy and structure. The remainder of this paper is organized as follows: in the following section, we provide our theoretical arguments and develop hypotheses. We
then describe the data, measures, and estimation methods. In the section that follows, we report our findings. We discuss our results and implications for theory in the penultimate section. The paper concludes by drawing attention to the limitations of the study and providing some directions for future research.
THEORY AND HYPOTHESES
In an early work on business groups, Leff describes them as “an institutional innova-tion for overcoming— and reaping the benefits from—imperfect markets in the less developed countries” (1978: 668, emphasis added). Khanna and Palepu (1997) extend the argument to include underdeveloped institutions, notably the regula-tory and judicial institutions, which characterize emerging economies. Khanna and Palepu (1997) maintain that business groups are able to add value to the affiliate firms by creating an internal capital market (which substitutes for absent venture capital firms in such economies), an internal managerial talent pool (which substitutes for business schools), building a credible umbrella brand and group reputation (which substitutes for certification agencies and guarantees contractual enforcement), and expertise in dealing with reg-ulatory bodies (which substitute for professional lobbyists) (Khanna and Palepu, 1997). The access to resources and capabilities of the collective enables affiliate firms to operate more efficiently, and to access and exploit opportunities that are not available to nongroup firms (Khanna and Palepu, 1997). The rare and inimitable ability of business groups to combine domestic and foreign resources in the presence of asymmetric trade policies enables them to “set up new business ventures across a variety of industries quickly and at low cost” (Guillen, 2000: 363). Further, it has been argued that the social ties that typify business groups enable affiliate firms to reduce uncertainty, enhance trust, and reduce transaction costs of accessing new business opportunities (Granovetter, 1995; Luo and Chung, 2005).
In sum, the extant literature highlights the value-adding potential of business groups in addressing new business opportunities in emerging economies characterized by institutional failures. However, benefits that accrue to member firms because of privileged access to “strategic opportunities” that
Copyright2013 John Wiley & Sons, Ltd. Strat. Mgmt. J.,36: 598–617 (2015)
arise due to the incomplete nature of markets (Denrell et al., 2003; Ng, 2007) have not been examined in extant literature.
Business groups and incomplete markets
Drawing on literature in economics on coordina-tion failures and the stream of work in strategic management on the link between resource valu-ation and competitive advantage (Barney, 1986; Dierickx and Cool, 1989), Denrell et al. (2003) maintain that the incomplete nature of strategic factor markets provides profitable opportunities for firms with preferential access to resources of other firms. The inability of strategic factor markets to value a resource in “all possible uses” (Denrell et al., 2003: 980, emphasis added ) affords prof-itable opportunities to firms that have preferential access to resources of other firms or those in a priv-ileged position to assess the value of resources of other firms in relation to their own resource port-folio. As Denrellet al.state: “Coordination failure caused by incomplete markets means that opportu-nity can inhere in novel combinations of existing resources, even if all the pieces remain familiar in the new relationship to each other. It is this fact that makes the image of an ‘arbitrage opportu-nity’ valuable in the strategy context—sometimes the opportunity remains available not because the arbitrage is complex per se or because of a lack of inventive genius, but because its feasibility was simply hidden by market incompleteness” (2003: 981). The identification of such strategic opportu-nities does not call for heroic efforts: “If a firm has preferential access to the missing piece of the puzzle, identifying the opportunity might be easy” (Denrell et al., 2003: 985).
Membership in a business group provides affil-iate firms with preferential access to the “missing piece of the puzzle.” Membership affords privi-leges of unique access to idiosyncratic information, resources, and capabilities of other group mem-bers. It provides a distinctive vantage point to view and assess the resources of all the other mem-ber firms of the group and thereby enables find-ing of new uses for existfind-ing resources or creates entirely new resources by accessing resources of other members of the group. The ability to scan and explore both the “local” and the “distant” knowledge (Levinthal and March, 1993; Teece, 2007) of group-wide resources augments the cre-ative process of bisociation— the deliberate act
of connecting hitherto unrelated information and knowledge—and facilitates “perceiving or craft-ing new opportunities that others have not noticed, imagined, or enacted” (Foss et al., 2008: 81). The connectedness among member firms fostered by a host of formal and informal ties such as director interlocks, group management cadre, and group-wide platforms, etc., improves the effectiveness of information and resource transfer across affili-ate firms (Reagans and McEvily, 2003; Szulanski, 1996) that is needed for novel recombination of resources to take place.
Internal director interlocks— or interlocks within business groups— occur when executives from group headquarters or other affiliate firms are deputed to represent the group in the boards of multiple affiliate firms (Maman, 1999). These internal interlocks act as bridging ties (McEvily and Zaheer, 1999) that serve to connect the affiliates operating in diverse businesses (Keis-ter, 1998). An additional set of bridging ties is provided by the group management cadre, recruited and trained centrally and rotated across different affiliate firms over a period of time (Khanna and Palepu, 1997). These managers play a vital role in the generation and enhancement of group-specific, affiliate firm-specific, and team-specific associational experiences, which shape the opportunity set of the business group and influence its growth (Foss et al., 2008; Kor, Mahoney, and Michael, 2007). Job rotation across affiliate firms develops “knowledge of who knows what, who can help with what problem, or who can exploit new information” (Cohen and Levinthal, 1990: 45, emphasis added) that can be tapped into towards exploiting an opportunity. Such expe-riential and associational knowledge comes in handy in making timely entrepreneurial decisions, accelerating knowledge transfer, decision making, and execution (Kor et al., 2007). The presence of group-wide platforms and processes, including cross-company teams and interfaces, further enables exchange of information and expertise among member firms.
Business Groups, Incomplete Markets, and Organizational Form 601
Smangs, 2006) provides a context that is low on opportunism and one that is based on trust and cooperation. Such a context facilitates easy transfer and assimilation of knowledge among group firms (Jansen, Van den Bosch, Volberda, 2005; Reagans and McEvily, 2003; Uzzi, 1997) resulting in access to greater opportunities, especially those that require transfer of tacit knowledge (Grant, 1996; Kogut and Zander, 1996).
In sum, business group affiliation provides member firms with distinctive vantage points and, as Denrell et al. note: “the more distinctive the view, the more likely that such a view can encompass valuable opportunities not similarly visible to other firms” (2003: 988). Therefore, business group affiliates are advantageously placed in accessing profitable opportunities hidden by incomplete markets. This logic leads us to our first hypothesis:
Hypothesis 1: Firms affiliated to business groups have greater growth opportunities than nongroup firms.
Business groups exhibit considerable hetero-geneity (Khanna and Yafeh, 2007). Consequently, affiliate firms of different business groups will be differently privileged. Firms affiliated to business groups with a widely diversified portfolio will have access to a greaternumberandvarietyof resources than affiliates of business groups with a less diver-sified portfolio. As the access to resources grows in number and variety, the number of possibilities for growth expands at a combinatorial rate (Ghoshal et al., 2000; Weitzman, 1996). Hence, we hypoth-esize:
Hypothesis 2: The greater the access to diversity through the business group, the greater the growth opportunities for the affiliate firms.
Organizational form and growth opportunities
Arguably, divisions of a multibusiness firm would have access to opportunities akin to firms affil-iated to a business group, if the multibusiness firm had similar diversity in its portfolio. How-ever, the ability of divisions in a multibusiness firm to sense and seize opportunities would be differ-ent since they are organized differdiffer-ently. A critical factor that affects a firm’s motivation and ability
to pursue growth opportunities is its organiza-tional and governance framework (Chandler, 1962; Penrose, 1959; Sautet, 2000). As Denrell et al. point out, recognizing and seizing opportunities demands an “energetic quest”—“a quest in which lucky discoveries of unanticipated kind can be recognized through alertness and then flexibly exploited” (2003: 989). The quest is energized both by access to relevant resources and the presence of a robust incentive system. As Kuratko, Montagno, and Hornsby (1990) show, “resource and reward availability” is a key driver of entrepreneurial behavior within firms. Penrose makes a similar observation, noting that a firm’s growth oppor-tunities (or a division’s as the case may be) are restricted to the extent it “isunwilling to act upon them, or is unable to respond to them” (1959: 32, emphasis added). We submit that the distinc-tive organizational arrangement of business groups enables their affiliates to sense and seize opportu-nities, both internally and in the external environ-ment, better than nongroup diversified firms with equivalent diversity in the portfolio.
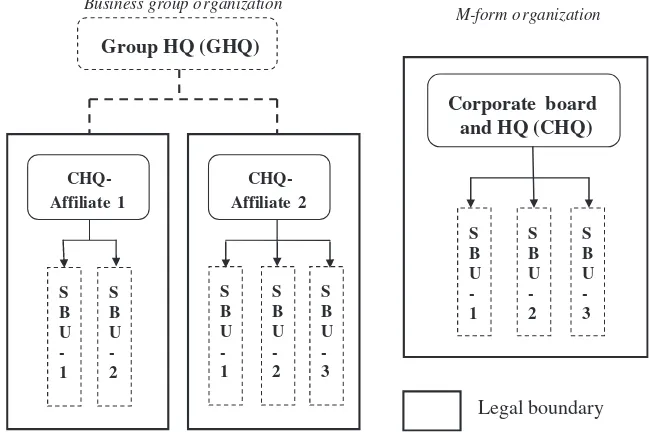
The multiple businesses in a firm’s portfolio could be organized under a single legal entity, as is the case with the multidivisional (M-form) firm, or as separate legal entities, as is typical of business groups (see Figure 1). The legal inde-pendent status of the affiliate firms endows them with “individual privilege (e.g., limited liability) and obligation (e.g., fiduciary obligation) under company laws” (Chung, 2001: 721). Each affili-ate firm has a full-fledged top management team that is governed by its own board of directors and importantly publishes a separate annual financial statement of accounts. In sharp contrast, divisional managements in an M-form organization report to a firm-wide top management team (the firm’s cor-porate headquarters), which in turn is governed by the firm’s board of directors. The M-form firm publishes a single financial statement that discloses information on the performance of the diversified firm as a whole. The independent legal standing and reporting requirements affords managements of affiliate firms considerably greater “autonomy” than the divisional managements of businesses in a diversified M-form firm. These structural and governance characteristics enable affiliate firms to potentially avoid several of the motivational and resource allocation challenges that are typical of diversified M-form organizations identified in the research literature.
Copyright2013 John Wiley & Sons, Ltd. Strat. Mgmt. J.,36: 598–617 (2015)
M-form o rganization Business group o rganization
Group HQ (GHQ)
Figure 1. Business group and M-form organization
In a multidivisional firm, the corporate head-quarters retains the ultimate decision rights to intervene in the affairs of the divisional units. The decision rights, where given, are only “loaned to” and “not owned by” the divisional management (Baker, Gibbons, and Murphy, 1999). The vest-ing of the overridvest-ing authority with the corporate headquarters has been found to strain the motiva-tion of frontline managers in multidivisional firms (Campbell, Goold, and Alexander, 1995; Day and Wendler, 1998), since, as Williamson observes, the right to intervene “can be exercised both for good cause (to support expected net gains) and for bad (to support the sub-goals of intervenor)” (Williamson, 1996, q.v. Foss, 2003: 341). The sup-port for “bad causes” is likely to be relatively high in the M-form organization because of the manipu-lation of the centralized resource allocation process by divisional managers and the vulnerability of the decision makers to the logic of the dominant business, thereby resulting in deserving opportuni-ties being overlooked (Prahalad and Bettis, 1986; Rajan, Servaes, and Zingales, 2000; Scharfstein and Stein, 2000).
While not immune from the influences of the common dominant owner or the group headquar-ters, the presence of an external governance mech-anism in the form of a separate board with a fiduciary responsibility to the affiliate firm (Lan and Heracleous, 2010) will potentially afford
managements of affiliate firms in a business group a greater sense of “control” over resources. While intra-group cash transfers are common (Bertrand, Mehta, and Mullainathan, 2002; Chang and Hong, 2000; George and Kabir, 2008), the presence of outside directors in the independent legal enti-ties and the oversight of regulatory and market forces gives affiliate firm managements an impor-tant and additional powerful check against oppor-tunistic interventions, while still accommodating beneficial interventions (Foss, Foss, and Vazquez, 2006). The statutory reporting requirements of affiliate firms make the task of “diverting” surplus resources from one business to another, especially for “bad causes,” harder and costlier (Almeida and Wolfenzon, 2006; Belenzon and Berkovitz, 2010). The consequent enhanced credibility of delegation (Foss et al., 2006) enables the affiliate manage-ment to proactively pursue new opportunities for growth.
Business Groups, Incomplete Markets, and Organizational Form 603
The market valuation of a division’s business can-not be discerned independent of that of the other businesses in the M-form organization. On the other hand, the (possibility of) separate listing of individual affiliates in the business group organi-zation offer stock options as a powerful market-based incentive for affiliate firms, in turn foster-ing entrepreneurialism. The motivation to pursue growth opportunities is further strengthened by the sense of empowerment that the affiliate manage-ment derives from being responsible to their own set of employees and accountable to their own set of shareholders (Conger and Kanungo, 1988).
In sum, the organization of businesses as sep-arate legal entities, with a sepsep-arate governance structure for each affiliate firm, mitigates the inter-nal governance problems associated with incentive alignment and resource allocation in multidivi-sional firms. Consequently, the higher the number of legal entities a business group has,for a given level of diversification, the greater the ability of its affiliate firm to sense and seize opportunities. This logic leads us to hypothesize:
Hypothesis 3: The greater the multi-entity char-acter of the business group, the greater the growth opportunities for the affiliate firms.
The set of opportunities available to a firm is also shaped by the external environment in which it is embedded (Ghoshalet al., 2000; Pen-rose, 1959; Teece, 2007). As Denrell et al. note, “in a changing environment, there is a contin-uing renewal of each firm’s view of opportu-nities” (2003: 978). To the extent the external environment is characterized by rich opportunity, the opportunity set of firms embedded in it would be greater. In the next section, we focus on the role of external environment and specifically examine the impact of the institutional reforms.
Growth opportunities and institutional reforms
Emerging economies around the world are charac-terized by wide-ranging market-oriented reforms that reduce government intervention in an econ-omy and improve the functioning of product and factor markets through changes in laws and regulations (Chari and David, 2012; Cuervo-Cazurra and Dau, 2009a). The unfolding of pro-market reforms in emerging economies is
accompanied by a burst of growth opportuni-ties in the external environment (Cuervo-Cazurra and Dau, 2009a; Hoskisson et al., 2004). The dismantling of state controls—deregulation and privatization— removes constraints on entry into product markets and opens up opportunities that were hitherto not available (Haveman, Russo, and Meyer, 2001; Ramamurti, 2000). The deepening of domestic capital markets, liberalization of laws enabling access to foreign capital, and the strength-ening of the regulatory framework that safeguards the rights of capital providers enhance easy access to capital to pursue greater opportunities.
While there is an increase in growth oppor-tunities in general, it has been acknowledged in the research literature that all firms do not benefit equally from the reform process (Cuervo-Cazurra and Dau, 2009a, b; Ramamurti, 2000). The privileged access to group-wide resources highlighted earlier, coupled with the attendant increase in combinatorial possibilities, and the organizational arrangements in business groups that enable member firms to not only sense but also seize the expanded set of opportunities leads to the following hypothesis:
Hypothesis 4: As pro-market reforms get strengthened in an economy, business group affiliates will have greater growth opportunities than nongroup firms.
DATA AND METHODS
Data
We test our hypotheses on a data set of group-affiliated and nongroup firms from India. The prominence of the business groups in the Indian competitive landscape, the clear identification of group affiliation of firms, and the availability of widely validated databases of financial measures and capital market information on Indian firms make India a popular context for research on business groups (cf. Chari and David, 2012; Douma, George, and Kabir, 2006; Elango and Pattnaik, 2007; Khanna and Palepu, 2000a; Vissa, Greve, and Chen, 2010). Moreover, given our argument that business groups would continue to add value to their affiliate firms even as the institutional environment gets strengthened in an economy, we believe our choice of India, an
Copyright2013 John Wiley & Sons, Ltd. Strat. Mgmt. J.,36: 598–617 (2015)
economy that has undergone a widespread and persistent market-oriented reform process over the last two decades (Ahluwalia, 2002, 2011; Chari and David, 2012; Panagariya, 2008), is appropriate to test our hypotheses.
Our data are drawn from PROWESS, a widely used and well-validated database for research on Indian companies (cf. Elango and Pattnaik, 2007; Khanna and Palepu, 2000a; Khanna and Rivkin, 2001; Vissa et al., 2010), which provides detailed financial measures and capital market information of large and medium Indian firms. The data correspond to the time period 1994–2010 and comprise all firms listed at the Bombay Stock Exchange, the oldest and one of the two significant stock exchanges in India. In line with prior works, firms operating in the financial services industry, firms with multinational parents, and firms that were owned partly or fully by the government were excluded from our sample (Chacar and Vissa, 2005; Chari and David, 2012; Douma et al., 2006; Elango and Pattnaik, 2007; Khanna and Palepu, 2000a; Vissa et al., 2010). We also dropped observations that we suspected to be database errors or unusual outliers using the guidelines followed by prior works (Vissa et al., 2010). Further, in line with previous research studies, we cap the dependent variable at their 1st and 99th percentile values (Douma et al., 2006). Our final sample comprised 13,765 firm-year observations, which included both group-affiliated and nongroup firms. The sample used to examine hypotheses involving only group-affiliated firms comprised 4,379 firm-year observations.
Measures
Dependent variable
Since growth opportunities are typically unob-servable (Adam and Goyal, 2008), we follow prior academic research in finance (Erickson and Whited, 2000) and management (Billet, King, and Mauer, 2007; David et al., 2006; Wright et al., 1996) by using the Q ratio as a proxy variable to measure them. The Q ratio—computed as the sum of market value of equity and book value of debt divided by the book value of assets—is the com-monly used proxy for growth opportunities as it has the “highest information content of all proxies with respect to investment opportunities” (Adam and Goyal, 2008: 55). Anchored on Keynes’
(1936) insight that a firm would invest only if the additional market value created from such investments is likely to exceed their cost, a high Q ratio indicates high growth opportunities (David et al., 2006; Erickson and Whited, 2000). Despite its simple structure, the Q ratio has proved to be a robust proxy for growth opportunities and has, notably, better explanatory power than a firm’s cash flows (Erickson and Whited, 2000). Given that our conceptual arguments focus on growth opportunities afforded by incomplete markets and organizational form, the use of Q ratio as a proxy is particularly appropriate as it estimates the growth opportunities of the firm after taking into account its internal capabilities to exploit them (Davidet al., 2006). Critically, the observed noise in the measurement of Q ratio does not bias the inferences when it is used as a dependent variable in the regression (Erickson and Whited, 2006).
Independent variables
Business Groups, Incomplete Markets, and Organizational Form 605
The variable is computed from the firm-product data that are available in the PROWESS database. We dropped firms whose sum of product sales were less than 90 percent of reported total firm sales. We also ensured that insignificant items do not bias our sample by considering only products that contributed at least 10 percent of the reported firm sales. We then calculatedfirm level product count for every firm. Group product access of an affiliate firm—measured as sum of the firm product count of all other affiliate firms in the group—was then computed. The natural logarithm of group product access and firm product count variables were used for the analyses.
Our third hypothesis relates to the multi-entity characteristic of the business group. We main-tain that, for a given level of portfolio diversity, organizing the diverse businesses as separate legal entities, with a separate governance structure for each affiliate firm, mitigates the internal gover-nance problems associated with incentive align-ment and resource allocation vis-`a-vis organizing the businesses as divisions of a single multidivi-sional firm. We capture this construct through the variable, MEC (multi-entity character) ratio. This measure helps parse the benefits arising from the organizational arrangement (specifically the multi-entity characteristic) from the benefits of partic-ipating in multiple businesses (or what can be termed as multibusiness characteristic). We mea-sure MEC ratio as a ratio of the number of compa-nies in the business group to the number of product markets that a business group is present in. This measure helps us examine the impact of organiza-tional arrangement for a given level of diversity. Consider two groups A and B, each having pres-ence in 10 product markets. Group A is organized as five companies and Group B as two companies. Thus, Group A displays greater multi-entity char-acter than Group B. This is captured in the MEC ratios of Group A and Group B, which are 0.5 and 0.2, respectively; the higher the MEC ratio, the greater the multi-entity character of the business group.
While estimating both group product access and MEC ratio, we included all group firms—all listed and nonlisted nonfinancial firms—including those firms that were not part of our final sample. The affiliate firm in our final sample would have linkages to these other group firms even if they do not feature in our final sample and thus needed to
be included while calculating group product access and MEC ratio.
The extent of pro-market reforms is captured using thereform index measure provided by Chari and David (2012). The index tracks the pro-market changes in the factor markets through an aggre-gate measure of foreign direct investment open-ness, tariff reductions, strengthening of intellectual property laws, strengthening of creditor and share-holder protection, and liberalization of labor laws and restrictions (Chari and David, 2012). Further details regarding the measure are provided in the online supporting information.
Control variables
We controlled for the following variables in our analyses: firm age, size, leverage, marketing inten-sity, research and development (R&D) inteninten-sity, firm profitability, industry, and year. Older and larger firms would have accumulated sufficient resources and capabilities over time that could positively influence a firm’s growth opportunities (Penrose, 1959). However, these firms could also suffer from organizational inertia, which makes them less nimble in pursuing new opportunities. Firm age is measured as the natural logarithm of number of years since the incorporation of the firm (Chakrabarti, Singh, and Mahmood, 2007; Khanna and Palepu, 2000a). Firm size is opera-tionalized as the natural logarithm of firm sales (Doumaet al., 2006; Khanna and Palepu, 2000a). Given the proclivity for group firms to be more leveraged than nongroups (Carney et al., 2011), we employed leverage—calculated as the ratio of debt to equity—as an additional control vari-able. R&D and marketing capabilities reflect a firm’s ability to explore new technology and prod-uct domains, respectively (Danneels, 2008).R&D intensity is measured as the ratio of total R&D expenses to sales.Marketing intensityis calculated as the ratio of the total of marketing, advertising, and distribution expenses to firm sales. Since the Q ratio reflects both the firm’s current profitability and its future potential, we employfirm profitabil-ity—measured as return of assets (ROA), i.e., ratio of operating profit to total assets—as an additional control variable so that its effect on the depen-dent variable, Q ratio, is taken into account. We also control for industry-specific and year-specific effects using indicator variables.
Copyright2013 John Wiley & Sons, Ltd. Strat. Mgmt. J.,36: 598–617 (2015)
Statistical method
Given the cross-sectional time-series nature of our data (firm-year observations), panel data regression is used to test our hypotheses. A fixed effects or random effects model could be used to account for firm-level effects. We report here results of random effects specification for our analyses for two reasons. First, the average number of time period observations per panel in our sample (T=8.1 for the sample of affiliate firms and 6.4 for the overall sample of both group and nongroup firms) is much smaller than the number of panels (m=543 firms and 2,151 firms, respectively). The fixed effects estimators in such cases may be inconsistent (Hsiao, 1986, cf. Leiblein and Madsen, 2009), whereas the random effects estimators are not. Second, one of our variables of interest, group affiliation, and one of our critical control variables, industry dummies, are time invariant and could not be accommodated in a fixed effects specification. The fixed effects specification would also soak up most of the explanatory power of slowly changing variables (Beck, 2001; Zhou, 2001), a condition that some of our variables display with very little within-panel variation when compared to across-within-panel variation. Under these conditions, prior works (cf. Barnett and Salomon, 2006; Leiblein and Madsen, 2009; Yin and Zajac, 2004) have recommended the use of random effects specification over a fixed effects model. We nevertheless tested our hypotheses using a fixed effects model and report the results as part of our additional tests.
RESULTS
Table 1 presents the means, standard deviations, and correlation matrix of the variables. The correlation matrix of the sample, comprising both group and nongroup firms used for testing Hypotheses 1 and 4, are reported in Panel A. The correlation matrix of affiliate firms’ sample, used for testing Hypotheses 2 and 3, are reported in Panel B. The analysis of the correlation indices and the variance inflation factors suggest that our analyses are not affected by multicollinearity.
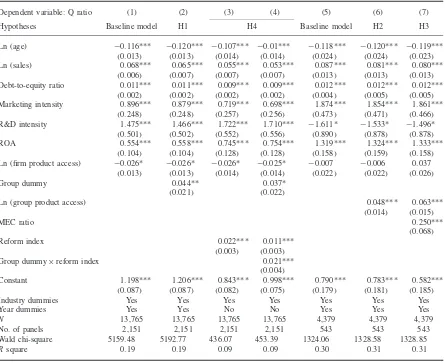
The regression results are presented in Table 2. We report standard errors that are robust to heteroskedasticity. We control for industry-specific and year-specific effects in all our analyses. All our
model specifications are statistically significant. Models 1–4 present our analyses of Hypotheses 1 and 4. The sample for these analyses comprises both group and nongroup firms. Model 1 reports the results of the baseline model with all the control variables. Model 2 includes the indicator variable for group affiliation. The empirical results indicate that group affiliation has a significant positive effect on a firm’s growth opportunities (b=0.044, p<0.039). Hence, Hypothesis 1 is supported.
Our test of Hypothesis 1 is arguably not affected by endogeneity issues. There is a broad consensus in extant research that business group formation is an exogenous process (cf. Khanna and Yafeh, 2005). Affiliate firms cannot decide to join a busi-ness group (cf. Chang, Chung, and Mahmood, 2006; Khanna and Palepu, 2000a); typically, affil-iate firms are promoted by the common dominant owner of the business group. Acquisitions con-stitute a very small part of the business group portfolio (cf. Khanna and Palepu, 2000a: 888). However, following the onset of economic liber-alization in the early nineties, several large busi-ness groups restructured their portfolios to adapt to the changed competitive context and also take advantage of the growth opportunities afforded by liberalization. Business groups restructured their portfolio by consolidating similar businesses that were distributed among affiliate firms into a single entity (for example, Aditya Birla Group brought all its cement businesses under one affiliate, Grasim Industries); pursued acquisitions to strengthen their competitive position (for example, TAFE of Amal-gamations Group acquired its major competitor Eicher Tractors); and sold businesses in which they had no meaningful competitive position (for example, the Tata Group sold its soaps and toi-letries business to Hindustan Unilever Limited). Hence, as a matter of additional caution, we repeated our analysis on a restricted sample of firms that were not part of any domestic mergers and acquisition activity during our sample period (cf. Khanna and Palepu, 2000b: 275, for a simi-lar approach). The results remained robust and are available from the authors.1 In sum, our empirical context and sample arguably do not suffer from endogeneity.
1We thank an anonymous reviewer for suggesting this additional
Business
Gr
oups,
Incomplete
M
arkets,
and
Or
ganizational
Form
607
Table 1. Means, standard deviations, and correlations
Panel A: Group and nongroup firms sample (Hypotheses 1 and 4)
Variable N Mean S.D. 1 2 3 4 5 6 7 8 9 10
1 Q ratio 13765 1.05 0.63 1
2 Ln (firm age) 13765 2.95 0.73 0.01 1
3 Ln (sales) 13765 4.44 1.87 0.12*** 0.43*** 1
4 Debt to equity 13765 1.20 2.33 0.02*** −0.001 0.05*** 1
5 Marketing intensity 13765 0.02 0.04 0.09*** 0.05*** −0.01 −0.02** 1
6 R&D intensity 13765 0.00 0.02 0.08*** 0.003 0.05*** −0.04*** 0.07*** 1
7 ROA 13765 0.12 0.11 0.16*** 0.05*** 0.23*** −0.08*** −0.01 0.03*** 1 8 Ln (firm product
access)
13765 0.43 0.47 −0.02** 0.16*** 0.21*** −0.01 0.06*** 0.07*** 0.003 1
9 Group dummy 13765 0.46 0.50 0.06*** 0.29*** 0.46*** 0.05*** 0.05*** 0.04*** 0.07*** 0.13*** 1
10 Reform index 13765 4.99 2.63 0.11*** 0.29*** 0.23*** −0.01 0.03*** 0.04*** −0.06*** −0.001 −0.11*** 1
Panel B: Only group affiliate firms sample (Hypotheses 2 and 3)
Variable N Mean S.D. 1 2 3 4 5 6 7 8 9 10 11
1 Q ratio 4379 1.08 0.64 1
2 Ln (firm age) 4379 3.24 0.74 −0.01 1
3 Ln (sales) 4379 5.45 1.57 0.18*** 0.32*** 1
4 Debt to equity 4379 1.30 2.35 0.01 −0.07*** −0.07*** 1
5 Marketing intensity 4379 0.03 0.03 0.15*** 0.07*** 0.03 0.01 1
6 R&D intensity 4379 0.00 0.01 0.04*** −0.04** 0.02 −0.03** 0.08 1
7 ROA 4379 0.13 0.08 0.26*** 0.001 0.17*** −0.14*** 0.01 −0.02 1 8 Ln (firm product
access)
4379 0.47 0.48 −0.04*** 0.13 0.17 −0.04** 0.02 0.07*** −0.07*** 1
9 Ln (group product access)
4379 1.87 1.08 0.17*** 0.16*** 0.30*** −0.05*** 0.03** −0.001 0.07*** 0.03** 1
10 MEC ratio 4379 0.65 0.17 0.08*** −0.06*** −0.08*** 0.03* −0.02 −0.03** 0.02 −0.56*** −0.20*** 1
11 Reform index 4379 4.74 2.65 0.16*** 0.23*** 0.26*** −0.01 0.05*** 0.04*** −0.08*** −0.02 0.06*** 0.07*** 1
*p<0.1; **p<0.05; ***p<0.01, double-tailed tests.
Copyright
2013
John
W
iley
&
Sons,
L
td.
Strat.
Mgmt.
J.
,
36
:
598
–
617
(2015)
DOI:
Table 2. Hypotheses test results
Dependent variable: Q ratio (1) (2) (3) (4) (5) (6) (7)
Hypotheses Baseline model H1 H4 Baseline model H2 H3
Ln (age) −0.116*** −0.120*** −0.107*** −0.01*** −0.118*** −0.120*** −0.119***
(0.013) (0.013) (0.014) (0.014) (0.024) (0.024) (0.023)
Ln (sales) 0.068*** 0.065*** 0.055*** 0.053*** 0.087*** 0.081*** 0.080***
(0.006) (0.007) (0.007) (0.007) (0.013) (0.013) (0.013)
Debt-to-equity ratio 0.011*** 0.011*** 0.009*** 0.009*** 0.012*** 0.012*** 0.012***
(0.002) (0.002) (0.002) (0.002) (0.004) (0.005) (0.005)
Marketing intensity 0.896*** 0.879*** 0.719*** 0.698*** 1.874*** 1.854*** 1.861***
(0.248) (0.248) (0.257) (0.256) (0.473) (0.471) (0.466)
R&D intensity 1.475*** 1.466*** 1.722*** 1.710*** −1.611* −1.533* −1.496*
(0.501) (0.502) (0.552) (0.556) (0.890) (0.878) (0.878)
ROA 0.554*** 0.558*** 0.745*** 0.754*** 1.319*** 1.324*** 1.333***
(0.104) (0.104) (0.128) (0.128) (0.158) (0.159) (0.158)
Ln (firm product access) −0.026* −0.026* −0.026* −0.025* −0.007 −0.006 0.037
(0.013) (0.013) (0.014) (0.014) (0.022) (0.022) (0.026)
Group dummy 0.044** 0.037*
(0.021) (0.022)
Ln (group product access) 0.048*** 0.063***
(0.014) (0.015)
MEC ratio 0.250***
(0.068)
Reform index 0.022*** 0.011***
(0.003) (0.003)
Group dummy×reform index 0.021***
(0.004)
Constant 1.198*** 1.206*** 0.843*** 0.998*** 0.790*** 0.783*** 0.582***
(0.087) (0.087) (0.082) (0.075) (0.179) (0.181) (0.185)
Industry dummies Yes Yes Yes Yes Yes Yes Yes
Year dummies Yes Yes No No Yes Yes Yes
N 13,765 13,765 13,765 13,765 4,379 4,379 4,379
No. of panels 2,151 2,151 2,151 2,151 543 543 543
Wald chi-square 5159.48 5192.77 436.07 453.39 1324.06 1328.58 1328.85
Rsquare 0.19 0.19 0.09 0.09 0.30 0.31 0.31
Standard errors corrected for heteroskedasticity in parentheses. *p<0.1; **p<0.05; ***p<0.01
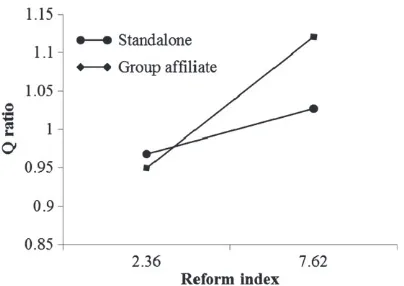
Hypothesis 4 further predicts that the posi-tive association between the extent of pro-market reforms and growth opportunities for firms is pos-itively moderated by group affiliation. The reform index variable is introduced in Model 3 to test this prediction, and the variable is found to be pos-itive and significant (b=0.022, p<0.000). The year dummies are not included for models incor-porating the reform index variable as there is a high degree of collinearity between year dum-mies and the year-specific reform index variable. Model 4 includes the interaction term between reform index and group affiliation variable. The variables, except for group dummy, are mean cen-tered for the estimation of the interaction model. The interaction variable is found to be positive and significant (b=0.021,p<0.000). The interaction
effect is plotted in Figure 2 to facilitate interpre-tation. All the variables except group dummy and reform index were constrained to their mean val-ues. Reform index took the values of one standard deviation above and below its mean value while the group dummy took the value of 0 and 1, denot-ing nongroup and group firms, respectively. As the plot illustrates, reform index has a stronger posi-tive influence on growth opportunities for group-affiliated firms than nongroup firms, thus providing support for Hypothesis 4.
Business Groups, Incomplete Markets, and Organizational Form 609
Figure 2. Business group, institutional reforms, and growth opportunities: the moderating role of group
affiliation
of a group affiliate firm are positively influenced by the access to diversity within the business group. To test this hypothesis, we add the group product access variable in Model 6. The variable is positive and significant (b=0.048, p<0.001), thus providing support for Hypothesis 2. We add the MEC ratio variable in Model 7. The variable is found to have a positive influence on the growth opportunities of an affiliate firm (b=0.250, p<0.000). Thus, our Hypothesis 3, which predicts a positive relationship between the multi-entity character of business group and an affiliate’s growth opportunities, is supported. The group product access variable continues to remain significant (b=0.063,p<0.000).
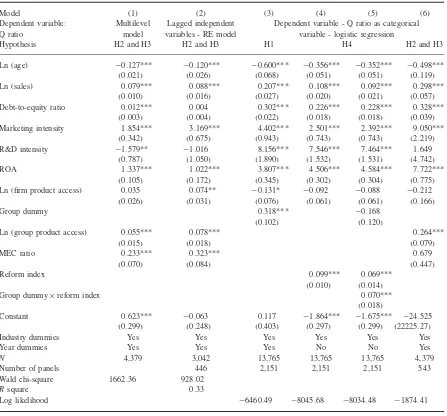
Additional tests
We performed a series of additional analyses to verify the robustness of our results. The results of the additional tests are presented in Tables 3 and 4. First, we examined the robustness of our find-ings under different specifications. We repeated all our analyses on group firms, i.e., Hypotheses 2 and 3, using a multilevel specification. Mod-els 6 and 7 presented in Table 2 assume that the errors are not correlated across firms in a busi-ness group. However, affiliate firms belonging to the same business group may share certain com-mon characteristics and group-level influences. The estimation model should accommodate inde-pendence of observations across business groups and relax that assumption within business groups (cf. Khanna and Palepu, 2000a). A multilevel model achieves this by explicitly modeling the
nested nature of affiliate firms. In the multi-level model, observations across time are nested within affiliate firms, which in turn are hierarchi-cally nested within business groups (cf. Hough, 2006; Misangyiet al., 2006). The multilevel model results are presented in Model 1 of Table 3. The group product access (Hypothesis 2) and MEC ratio (Hypothesis 3) variables remain positive and significant.
Further, we repeated all our analyses of Hypotheses 2 and 3 on a specification using lagged values of the independent variable and control variables. The empirical results remained consistent (Table 3: Model 2) with our previous analysis of both Hypotheses 2 and 3. The analyses of Hypotheses 1 and 4 were not performed using a lagged specification model as group affiliation remains unchanged over time.
Next, we repeated our analyses using alternate specifications of dependent variable. We defined our dependent variable as a binary variable. Following prior works (cf. Davidet al., 2006), we coded growth opportunities as an indicator variable with value 1 when Q exceeds 1, and 0 otherwise. The findings remained robust (Table 3: Models 3–6). The group indicator variable was positive and significant, as was the interaction variable lending support for Hypotheses 1 and 4. The group product access variable was significant at 1 percent (b=0.264,p<0.001), and the MEC ratio variable was supported at a 10 percent significant level, under a one-tailed test specification (b=0.679,
p<0.129).
Additionally, as an extension of our Hypothesis 4, we examined individually the moderating effect of group product access and MEC ratio on the relationship between reform index and growth opportunities. The results were consistent with our results for Hypothesis 4, and are reported in the supporting information.
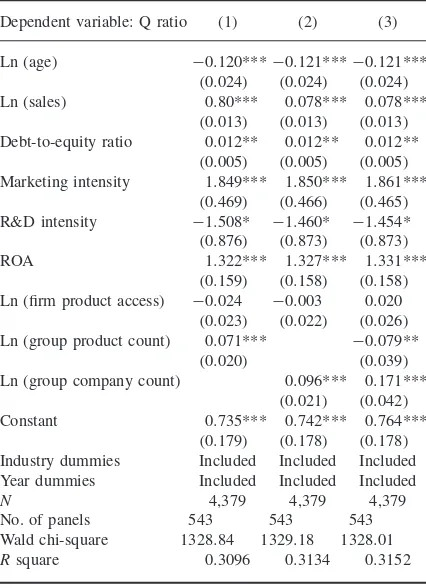
As an additional robustness test of Hypothe-sis 3, we used group product count (measured as natural logarithm of number of product mar-kets that the group is operating in) and group company count (measured as natural logarithm of the number of companies in the group) as separate variables in the place of MEC ratio (cf. Klein and Saidenberg, 2010). The empiri-cal results are presented in Table 4. Both group product count and group company count vari-ables were positive and significant when included in separate models (Table 4: Models 1 and 2).
Copyright2013 John Wiley & Sons, Ltd. Strat. Mgmt. J.,36: 598–617 (2015)
Table 3. Additional tests results
Model (1) (2) (3) (4) (5) (6)
Dependent variable: Q ratio
Multilevel model
Lagged independent variables - RE model
Dependent variable - Q ratio as categorical variable - logistic regression
Hypothesis H2 and H3 H2 and H3 H1 H4 H2 and H3
Ln (age) −0.127*** −0.120*** −0.600*** −0.356*** −0.352*** −0.498***
(0.021) (0.026) (0.068) (0.051) (0.051) (0.119)
Ln (sales) 0.079*** 0.088*** 0.207*** 0.108*** 0.092*** 0.298***
(0.010) (0.016) (0.027) (0.020) (0.021) (0.057)
Debt-to-equity ratio 0.012*** 0.004 0.302*** 0.226*** 0.228*** 0.328***
(0.003) (0.004) (0.022) (0.018) (0.018) (0.039)
Marketing intensity 1.854*** 3.169*** 4.402*** 2.501*** 2.392*** 9.050***
(0.342) (0.675) (0.943) (0.743) (0.743) (2.219)
R&D intensity −1.579** −1.016 8.156*** 7.546*** 7.464*** 1.649
(0.787) (1.050) (1.890) (1.532) (1.531) (4.742)
ROA 1.337*** 1.022*** 3.807*** 4.506*** 4.584*** 7.722***
(0.105) (0.172) (0.345) (0.302) (0.304) (0.775)
Ln (firm product access) 0.035 0.074** −0.131* −0.092 −0.088 −0.212
(0.026) (0.031) (0.076) (0.061) (0.061) (0.166)
Group dummy 0.318*** −0.168
(0.102) (0.120)
Ln (group product access) 0.055*** 0.078*** 0.264***
(0.015) (0.018) (0.079)
MEC ratio 0.233*** 0.323*** 0.679
(0.070) (0.084) (0.447)
Reform index 0.099*** 0.069***
(0.010) (0.014)
Group dummy×reform index 0.070***
(0.018)
Constant 0.623*** −0.063 0.117 −1.864*** −1.675*** −24.525
(0.299) (0.248) (0.403) (0.297) (0.299) (22225.27)
Industry dummies Yes Yes Yes Yes Yes Yes
Year dummies Yes Yes Yes No No Yes
N 4,379 3,042 13,765 13,765 13,765 4,379
Number of panels 446 2,151 2,151 2,151 543
Wald chi-square 1662.36 928.02
Rsquare 0.33
Log likelihood −6460.49 −8045.68 −8034.48 −1874.41
Standard errors corrected for heteroskedasticity in parentheses.
For multilevel model:SD(group)=0.117;SD(firm)=0.325;SD(residual)=0.427. *p<0.1; **p<0.05; ***p<0.01
When both the variables were included in a sin-gle model, the group company count variable continued to remain positive and significant at the 1 percent level (b=0.171, p<0.000) provid-ing support to our arguments relatprovid-ing to organi-zational form (Table 4: Model 3). Interestingly, the group product count variable turned nega-tive and was significant at 5 percent significance level (b= −0.079,p<0.041). This empirical find-ing suggests that it matters how the diverse businesses are organized. The results indicate that, while group diversity by itself may have a
negative effect, the organizational form of business groups mitigates this effect. Thus, Hypothe-sis 3 finds support from this set of additional analyses.2
Additionally, we repeated all our analyses using a fixed effects specification. To test Hypothe-ses 1 and 4, which involved a time-invariant variable—group affiliation, we employed the two-stage approach suggested by Krishnakumar (2006; see also Chari, 2013). All our hypotheses found
Business Groups, Incomplete Markets, and Organizational Form 611 Table 4. Additional test of Hypothesis 3—using group
product count and group company count variables
Dependent variable: Q ratio (1) (2) (3)
Ln (age) −0.120***−0.121***−0.121***
(0.024) (0.024) (0.024)
Ln (sales) 0.80*** 0.078*** 0.078***
(0.013) (0.013) (0.013)
Debt-to-equity ratio 0.012** 0.012** 0.012**
(0.005) (0.005) (0.005)
Marketing intensity 1.849*** 1.850*** 1.861***
(0.469) (0.466) (0.465)
R&D intensity −1.508* −1.460* −1.454*
(0.876) (0.873) (0.873)
ROA 1.322*** 1.327*** 1.331***
(0.159) (0.158) (0.158)
Ln (firm product access) −0.024 −0.003 0.020
(0.023) (0.022) (0.026)
Ln (group product count) 0.071*** −0.079**
(0.020) (0.039)
Ln (group company count) 0.096*** 0.171***
(0.021) (0.042)
Constant 0.735*** 0.742*** 0.764***
(0.179) (0.178) (0.178)
Industry dummies Included Included Included Year dummies Included Included Included
N 4,379 4,379 4,379
No. of panels 543 543 543
Wald chi-square 1328.84 1329.18 1328.01 Rsquare 0.3096 0.3134 0.3152
Standard errors corrected for heteroskedasticity in parentheses. The correlation between ln(group product count) and ln(group company count) is high (0.95, significant at 1%) (cf. Klein and Saidenberg, 2010, which also reports a high correlation between the number of subsidiaries and the number of states).
*p<0.1; **p<0.05; ***p<0.01, with double-tailed test
robust support under the fixed effects specifica-tion.3 The detailed description of these tests and the results are available in the supporting informa-tion.
Finally, as an additional robustness test of Hypothesis 1, we analyzed the performance of business groups relative to a comparable set of unaffiliated firms operating the same industries as the affiliates of the business group. The sample for this exercise corresponded to year 2010 and comprised all firms listed on the Bombay Stock Exchange. We computed the industry-adjusted Q ratio of a business group (cf. Khanna and Palepu, 2000a). We found that nearly 60 percent of the business groups outperformed the comparable set of unaffiliated firms (i.e., their industry-adjusted
3We thank an anonymous reviewer for suggesting this analysis.
Q ratio was positive).4 The empirical results are presented in the supporting information.
DISCUSSION
Over the years, a growing body of research has established business groups as a phenomenon of “great theoretical and practical import” (Carney et al., 2011: 438). Our extant understanding of business groups is largely based on their institu-tional advantage. In this paper, we focus on their organizational advantage by examining the value-adding potential of two characteristics of business groups, viz., portfolio diversity and the multi-entity organizational form, in providing affiliate firms with greater growth opportunities. Our empirical analyses on a sample of Indian group and non-group firms for the period 1994–2010 lend support to our hypotheses.
A key contribution of this paper is to high-light the advantages that the diverse business portfolio of a business group and the attendant resource and knowledge base could offer affiliates in identifying unique opportunities hidden by incomplete markets. The diversity in business groups is often seen as a consequence of the need to tap into the scale and scope of advantages arising out of institutional voids (Carney et al., 2011); the value-adding potential of diversity per se has not been engaged with. The current paper suggests that business group affiliates may fundamentally differ from nongroup firms in their ability to create value out of a specific resource or resource bundle. Given the access to a variety of complementary resources through the business group network, an affiliate firm could value (or create more value out of) a specific resource differently even if the initial resource endowments of the affiliate and nongroup firms are similar (Adegbesan, 2009; Dierickx and Cool, 1989). Fur-ther, while we identify with the agency that Kock and Guillen (2001) attribute to business groups in learning and developing capabilities over time, we find it difficult to agree with their prediction that the business group portfolio would tend to become related over time. Our emphasis on the opportunities found in interstices of incomplete markets suggests that the growth need not be restricted to related opportunities (Ng, 2007).
4We thank an anonymous reviewer for suggesting this analysis.
Copyright2013 John Wiley & Sons, Ltd. Strat. Mgmt. J.,36: 598–617 (2015)
Our empirical findings that business group affil-iates have greater access to growth opportunities also provide a potential answer to the interest-ing empirical observation in the business group literature that business group affiliates are more diversified than nongroup firms across many coun-tries (Claessens et al., 1999; George and Kabir, 2012; Lins and Servaes, 2002). Our conceptual-ization also adds to the discussion on internal capital markets in business groups by suggesting that business groups may also enjoy “expectational advantages” (Barney, 1986) over external capital markets in financing unique opportunities that are hidden by incomplete markets (Ng, 2007). Finally, arguments presented in the current paper highlight the potential of business groups to enhance “evo-lutionary fitness”—“how well a dynamic capabil-ity enables an organization to make a living by creating, extending, or modifying its resources” (Helfat et al., 2007: 7, q.v. Leiblein, 2011: 912). The notion of evolutionary fitness takes on addi-tional relevance in light of the observed longevity of business groups across the world (Granovetter, 1995; Khanna and Yafeh, 2007).
Another contribution of this paper is to engage with the distinctive organizational form of busi-ness groups. Despite a “consensus” in the research literature that business groups are “structurally dif-ferent from conglomerate organizations” (Carney et al., 2011: 437), and the observations in diversi-fication literature that the legal form of organiza-tion significantly influences firm value (Bethel and Liebeskind, 1998; Klein and Saidenberg, 2010), scholarly attention on the distinctive multi-entity organizational form of business groups has been noticeably limited. A vast majority of the empirical literature is limited to comparing business group affiliates with independent nongroup firms. Such a research design fails to isolate membership ben-efits such as economies of scale and scope from those flowing from the organizational formper se. By explicitly examining the implications of the organizational form on the growth opportunities of an affiliate, we address this concern. In doing so, we also offer a potential answer to Markides’ question on the continuing diversification and prof-itability of Asian business groups: “What might explain the continuing prosperity of the Asian con-glomerates? Are they not subject to the same limits to size as Western conglomerates or have they discovered a much better way of managing diver-sity in Asia?” (2002: 107). Our arguments in the
current paper suggest that it may indeed be so. The organizational form of business groups enables what Ghoshal et al. refer to as greater “carrying capacity for complexity”— “the extent to which an organization can accommodate the exercise of entrepreneurial judgment by its members, given the size and diversity of the accumulated stock of resources” (2000:163).
More generally, we believe that our work could renew interest in the enduring strategy-structure nexus in the strategic management literature. While the M-form organization, which emerged as a response to the growing need for decentral-ization following the spurt of growth firms wit-nessed at the turn of the last century (Chandler, 1962), has become the most widely used model of managing diverse businesses (Strikwerda and Stoelhorst, 2009), its limitations have been high-lighted by various scholars (Bartlett and Ghoshal, 1993; Day and Wendler, 1998; Halal, 1994; Zenger and Hesterly, 1997). Bartlett and Ghoshal advo-cate an organizational design based on extensive decentralization of responsibility and devolution of authority comprising “self-contained and man-ageable units with overview” (1993: 28). We sug-gest that the business group organization in which businesses are organized as multiple legal enti-ties with their own management and governance structure, and yet maintained under a coherent administrative context through a host of formal and informal ties (Khanna and Yafeh, 2007; Yiu et al., 2007), exemplifies such an organizational design.
Business Groups, Incomplete Markets, and Organizational Form 613
posing “some enigmatic questions for institutional theorists” (Carney et al., 2011: 453). We submit that the current paper provides potential answers to such questions.
Limitations and further research
As with any other research, our work has its lim-itations. A potential limitation of our study is its single-country empirical context. Our conceptual arguments in this paper are rooted in the inher-ent incomplete nature of markets and the multi-entity organizational form of business groups. We believe that these arguments are broadly applica-ble to all empirical contexts. Replication studies in other countries would confirm our expecta-tions of generalizability. Further, a multicountry study spanning across heterogeneous institutional environments including developed and developing economies could serve to enhance the robustness of our theoretical arguments. A second limita-tion of our work is that, while we do discuss some of the benefits of the multi-entity organi-zational form relative to the M-form, our empir-ical analysis did not involve a direct compar-ison of M-form and business group organiza-tional form, as business groups as a collective are not listed in India; only the affiliates are listed. Future work that explores novel research designs to address this limitation would be a valuable extension.
Measures akin to MEC ratio such as count of companies, segments, etc., have been used in prior literature studying internal organization of firms. While such measures have an advantage of facili-tating empirical study of large sample firms, they have their shortcomings as well (Klein and Lien, 2009). An in-depth longitudinal study based on archival data on the evolution of specific business groups (cf. Bhardwaj, Camillus, and Hounshell, 2006, for such a study of the evolution of pro-ductive possibilities at DuPont Company) would significantly enhance our understanding of their growth and sustenance. Finally, the organizational advantage of business groups highlighted in the current paper is best leveraged in the presence of a coherent administrative context. This raises some questions of interest: What structures and systems do business groups put in place to leverage their superior opportunity access? How does one incentivize the affiliate firms to exchange informa-tion on business opportunities? What role does the
group headquarters play? Future researchers could explore these questions.
CONCLUSION
Business groups occupy a prominent place in the competitive landscape of most economies across the world. The current paper advances our understanding of this important organizational form by highlighting the potential ability of busi-ness groups in uncovering unique opportunities hidden by incomplete markets. More critically, we show that the organizational arrangements in a business group deserve independent scholarly attention. The unique organizational form com-prising independent legal entities tied together under a shared administrative context presents a stable and effective alternative form of orga-nizing diverse businesses. They may, in fact, not be the widely believed organizational anoma-lies that have emerged as an imperfect reso-lution of institutional deficiencies in emerging economies.
ACKNOWLEDGEMENTS
We thank SMJ associate editor Professor Joseph Mahoney and the two anonymous reviewers and for their helpful comments in the development of this paper. We also thank Professors Pranav Garg, Rejie George, Shaleen Gopal, Jaya Krishnakumar, Mukta Kulkarni, Anirvan Pant, and Charles Snow for their helpful comments on earlier drafts of this paper. We thank Professors Murali Chari and Parthiban David for clarifying our queries regard-ing the reform index measure. K. S. Manikandan thanks SAP Labs India for the SAP Labs Doctoral Fellowship for the period during which this paper was written.
REFERENCES
Adam T, Goyal VK. 2008. The investment opportunity set and its proxy variables.Journal of Financial Research 31(1): 41–63.
Adegbesan JA. 2009. On the origins of competitive advantage: strategic factor markets and heterogeneous resource complementarity. Academy of Management Review 34(3): 463–475.
Copyright2013 John Wiley & Sons, Ltd. Strat. Mgmt. J.,36: 598–617 (2015)
Ahluwalia MS. 2002. Economic reforms in India since 1991: has gradualism worked? Journal of Economic Perspectives 16(3): 67–88.
Ahluwalia MS. 2011. Prospects and policy changes in the twelfth plan. Economic and Political Weekly 46(21): 88–105.
Almeida H, Wolfenzon D. 2006. A theory of pyramidal ownership and family business groups. Journal of Finance 61(6): 2637– 2680.
Baker G, Gibbons R, Murphy KJ. 1999. Informal authority in organizations.Journal of Law, Economics, and Organization 15(1): 56–73.
Barnett ML, Salomon RM. 2006. Beyond dichotomy: the curvilinear relationship between social responsibility and financial performance. Strategic Management Journal 27(11): 1101– 1122.
Barney JB. 1986. Strategic factor markets: expectations, luck, and business strategy. Management Science 32(10): 1231–1241.
Bartlett CA, Ghoshal S. 1993. Beyond the M-form: toward a managerial theory of the firm.Strategic Man-agement Journal, Winter Special Issue14: 23–46. Beck N. 2001. Time-series-cross-section data: what have
we learned in the past few years?Annual Review of Political Science4(1): 271–293.
Belenzon S, Berkovitz T. 2010. Innovation in business groups.Management Science 56(3): 519–535. Bertrand M, Mehta P, Mullainathan S. 2002. Ferreting out
tunneling: an application to Indian business groups.
Quarterly Journal of Economics 117(1): 121–148. Bethel JE, Liebeskind JP. 1998. Diversification and the
legal organization of the firm. Organization Science 9(1): 49–67.
Bhardwaj G, Camillus JC, Hounshell DA. 2006. Con-tinual corporate entrepreneurial search for long-term growth.Management Science52(2): 248–261. Billet MT, King T, Mauer DC. 2007. Growth
opportu-nities and the choice of leverage, debt maturity, and covenants.Journal of Finance 62(2): 697– 730. Campbell A, Goold M, Alexander M. 1995. The value of
the parent company. California Management Review 28(6): 107–108.
Carney M. 2008. The many futures of Asian business groups. Asia Pacific Journal of Management 25(4): 595–613.
Carney M, Gedajlovic ER, Heugens PPMAR, Van Essen M, van Oosterhout JH. 2011. Business group affiliation, performance, context, and strategy: a meta-analysis. Academy of Management Journal 54(3): 437–460.
Chacar A, Vissa B. 2005. Are emerging economies less efficient? Performance persistence and the impact of business group affiliation. Strategic Management Journal 26(10): 933– 946.
Chakrabarti A, Singh K, Mahmood I. 2007. Diversifica-tion and performance: evidence from East Asian firms.
Strategic Management Journal 28(2): 101–120. Chandler AD. 1962. Strategy and Structure: Chapters
in the History of American Enterprise. Massachusetts Institute of Technology: Cambridge, USA.
Chang SJ, Chung CN, Mahmood IP. 2006. When and how does business group affiliation promote firm
innovation? A tale of two emerging economies.
Organization Science17(5): 637–656.
Chang SJ, Hong J. 2000. Economic performance of group-affiliated companies in Korea: intragroup resource sharing and internal business transactions.
Academy of Management Journal 43(3): 429–448.
Chari MDR. 2013. Business groups and foreign direct investment by developing country firms: an empirical test in India. Journal of World Business 48(3): 349–359.
Chari MDR, David P. 2012. Sustaining superior perfor-mance in an emerging economy: an empirical test in the Indian context.Strategic Management Journal 33(2): 217–229.
Chung CN. 2001. Markets, culture, and institutions: the emergence of large business groups in Taiwan, 1950s– 1970s.Journal of Management Studies 38(5): 719–745.
Claessens S, Djankov S, Fan JPH, Lang LHP. 1999. The rationale for groups: evidence from East Asia. World Bank Unpublished Working paper.
Cohen WM, Levinthal DA. 1990. Absorptive capacity: a new perspective on learning and innovation. Adminis-trative Science Quarterly 35(1): 128–152.
Colpan AM, Hikino T, Lincoln JR. 2010. Introduction. InThe Oxford Handbook of Business Groups, Coplan AM, Hikino T, Lincoln JR (eds). Oxford University Press: Oxford, UK; 1– 14.
Conger JA, Kanungo RN. 1988. The empowerment process: integrating theory and practice.Academy of
Management Review 13(3): 471–482.
Cuervo-Cazurra A, Dau LA. 2009a. Promarket reforms and firm profitability in developing countries.
Academy of Management Journal 52(6): 1348–1368.
Cuervo-Cazurra A, Dau LA. 2009b. Structural reforms and firm exports. Management International Review 49(4): 479–507.
Danneels E. 2008. Organizational antecedents of second order competences. Strategic Management Journal 29(5): 519–543.
David P, Yoshikawa T, Chari MD, Rasheed AA. 2006. Strategic investments in Japanese corporations: do foreign portfolio owners foster underinvestment or appropriate investment? Strategic Management Jour-nal 27(6): 591–600.
Day D, Wendler JC. 1998. The new economics of organization.McKinsey Quarterly 1: 4–18.
Denrell J, Fang C, Winter SG. 2003. The economics of strategic opportunity. Strategic Management Journal 24(10): 977–990.
Dierickx I, Cool KO. 1989. Asset stock accumulation and sustainability of competitive advantage. Management Science 35(12): 1504–1511.
Douma S, George R, Kabir R. 2006. Foreign and domes-tic ownership, business groups and firm performance: evidence from a large emerging market. Strategic
Management Journal 27(7): 637–657.