ANALYSIS
Technical coefficients for bio-economic farm household
models: a meta-modelling approach with applications for
Southern Mali
Ruerd Ruben *, Arjan van Ruijven
Department of Economics and Management,De6elopment Economics Group,Wageningen Agricultural Uni6ersity,Hollandseweg1,
6706KN Wageningen,The Netherlands
Received 3 September 1999; received in revised form 21 August 2000; accepted 21 August 2000
Abstract
In recent years, different types of bio-economic models have been developed to support the analysis of the potential impact of agrarian policies on changes in land use, sustainable resource management and farmers’ welfare. Most bio-economic models rely on series of discrete input – output coefficients for current and improved cropping and livestock activities, whereas mathematical programming procedures are usually applied to analyse optimum allocative choice. Adequate procedures for the smooth integration of biophysical information into economic decision models are, however, not readily available. This article provides a new and comprehensive framework for the incorporation of technical input – output coefficients derived from agroecological simulation approaches into bio-economic farm household models. Therefore, continuous production functions are estimated for the production side of the farm household model, making use of meta-modelling principles. It is shown that meta-modelling offers considerable scope for improving the specification and behaviour of bio-economic farm household models. This procedure is applied in a farm household model developed for the analysis of farmers’ response to agrarian policies in Southern Mali. Results are presented for the behaviour of a typical household, focusing attention on the trade-offs between farm income and soil nutrient balances under free market conditions and with constraints on labour, capital and animal traction markets. The stability and robustness of the model is analysed through a simulation of the impact of higher input costs for land use and fertiliser applications. © 2001 Elsevier Science B.V. All rights reserved.
Keywords:Technical input – output coefficients; Farm household behavior; Land use; Crop growth; Production function; Bio-eco-nomic models; Meta modelling; Mali
www.elsevier.com/locate/ecolecon
The authors gratefully acknowledge suggestions by Arie Kuyvenhoven, Gideon Kruseman, Peter Hazell and Alain de Janvry and two anonymous reviewers for their useful remarks. All remaining errors are ours.
* Corresponding author. Tel.: +31-317-482486; fax: +31-317-484037. E-mail address:[email protected] (R. Ruben).
1. Introduction
Policy makers in developing countries ask for decision support systems that are able to assist them in the appraisal of the most likely farmers’ responses to different types of interventions. Deci-sions about public investment, market reform or institutional change have a decisive impact on rural incomes, land use and resource allocation that should be acknowledged before these are imple-mented. Therefore, analytical procedures are re-quired that can support decision-making processes regarding agricultural policies (Sadoulet and de Janvry, 1995).
Policy makers and international donor organisa-tions increasingly care about the implicaorganisa-tions of economic policies for the sustainability of the resource base (Munasinghe and Cruz, 1994). This implies that both welfare effects and changes in soil quality should be taken into account. In the short run, soil degradation can be considered as an externality, but in the long run technological change deserves major attention. In the latter case, the analysis should be broadened to include poten-tially feasible and sustainability-enhancing produc-tion technologies that are currently not yet applied. Economic models for policy analysis mostly limit their attention to the historical evolution of land use patterns. Changes in production systems are thus exclusively addressed within the framework of currently applied technologies. Transition towards more sustainable production systems requires, however, insight into a wider range of potential technological options which can be derived from agroecological simulation models (van Keulen and Wolf, 1986; Rabbinge, 1990). These models provide a set of technically feasible input – output coeffi-cients for crop and livestock activities for given soil and climate conditions (Rabbinge and van Itter-sum, 1994).
Farmers’ decision-making regarding the adop-tion of new technologies can be analysed with bio-economic farm household models where pro-duction decisions are linked with preferences re-garding consumption (Singh et al., 1986; Kuyvenhoven et al., 1998). Technological change towards more sustainable production options can take place if reallocation of production factors in
time and space permits improvement of farmers’ welfare under given market and institutional condi-tions. These bio-economic models are used to analyse the impact of different types of economic incentives (i.e. price policies, market development, public investment) on farmers’ resource allocation decisions, as well as their implications for the natural resource base (in terms of changes in nutrient and organic matter balances).
Adequate procedures for linking technical in-put – outin-put coefficients with bio-economic farm household models are not readily available. Econo-metric analyses are limited to current technologies and cannot be used for a simultaneous appraisal of welfare and sustainability effects of new technolog-ical options. When new and potential technologies have to be included, mathematical programming approaches are generally used (Barbier, 1994; Schipper, 1996; Deybe, 1998). The discrete nature of the whole range of technically-efficient input – output coefficients leads in practice to analytical problems related to the frequent occurrence of corner solutions (Hazell and Norton, 1986). Recent development in meta-modelling techniques (Kleij-nen and van Groe(Kleij-nendaal, 1992; Kleij(Kleij-nen and Sargent, 1997) provide a suitable alternative for the integration of technical input – output coefficients derived from agroecological simulation procedures into econometrically specified farm household models. We apply this meta-modelling approach for an analysis of agrarian policies to halt soil degradation in Southern Mali.
2. Bio-economic farm household models
Economic policies influence farmers’ welfare through the adjustment of relative prices that could lead to: (i) reallocation of land and labour re-sources; and (ii) changes in market engagement (i.e. net demand or supply). The simultaneous impact of policy instruments on resource allocation and market exchange asks for an integrated analysis that takes into account both production and con-sumption behaviour. Farm household models provide a useful framework for the appraisal of the responses of different types of farmers to policy measures, considering income and substitution ef-fects (Singh et al., 1986). Moreover, these models can be extended to account for multiple objectives (i.e. profit maximisation, risk aversion, food secu-rity) and multi-period criteria (savings and invest-ment).
Farm household models are particularly useful to assess trade-offs between income objectives and the quality of natural resources. Therefore, sepa-rate procedures are used to define: (i) technical production possibilities; and (ii) consumptive pref-erences. The production side of the models is specified in terms of technical input – output coeffi-cients for different agricultural activities, including parameters that indicate the net balance for soil nutrient and organic matter content. This permits appreciation of the implications of changing prices and market conditions on (short-term) production volumes and (long-term) soil resources. The con-sumption side of the model includes farmers’ pref-erences regarding expenditures for food and non-food items (derived from household budget surveys) and preferences regarding leisure. Dy-namic properties can be incorporated into the model through the specification of savings and investment preferences, permitting adjustments of the resource base in subsequent periods. Linking production and consumption behaviour into a single modelling framework enables an analysis of technical change induced by farm household pref-erences.
Bio-economic models have been developed at household, village, watershed and sector level (see Ruben et al., 1998 for a review) and are usually built from a number of separate modules that
specify: (i) farm household resources and objec-tives; (ii) technological options and related sustain-ability indicators; and (iii) prices and market conditions. This modular framework makes the models suitable for use in different locations and permits the integration of information from differ-ent disciplines. For optimisation iterative or se-quential mathematical programming procedures are used. Although this approach permits the integration of a wide number of different data sources within a single model, estimation proce-dures are highly complex and model outcomes are not always fully comprehensive. Therefore, efforts are made to control the size of bio-economic models and to adapt the model structure to the specific conditions that prevail in less-developed countries (Kruseman, 1999).
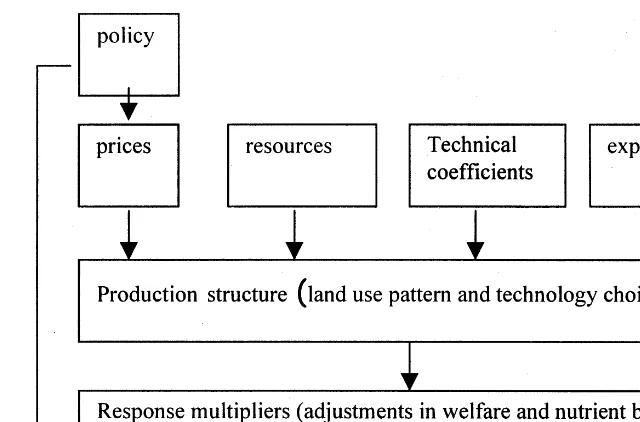
Fig. 1 provides a schematic presentation of the structure of the bio-economic farm household and the optimisation procedures used to calculate changes in land use, income and soil nutrient balances due to changing production conditions (for a full mathematical description of the model: see Kruseman and Bade, 1998).1
Farm households optimise their utility derived from consumption expenditures, taking into ac-count available resources (land, labour, capital) and market prices for production factors and products. This procedure results in the selection of technically feasible and economically efficient pro-duction activities from the set of potential technical coefficients for land use activities. The derived production structure includes the optimal alloca-tion of available resources to land use activities that guarantee highest farm household welfare and/or lowest levels of natural resource degradation. Ad-justments in land use and technology choice can be simulated under conditions of changing relative prices. Response multipliers indicate the percentage
Fig. 1. Modular structure of the bio-economic farm household model.
change in welfare or soil quality as a result of a discrete change in market conditions.
The bio-economic model used in this article has been developed for the analysis of soil degrada-tion processes in the semi-arid area of Southern Mali. In this region, land degradation is particu-larly severe due to: (i) limited access and use of (in)organic fertilisers; and (ii) the expansion of extensive livestock activities beyond the carrying capacity of pastures (Berckmoes et al., 1990; Sis-soko, 1998). Cultivated area of food crops has increased during the last decades, while revenues from cash crop production are used for purchas-ing more cattle. Consequently, fallow practices are strongly reduced and maintenance of soil fer-tility becomes dependent on the use of chemical fertilisers, animal manure, and the recycling of crop residues. Possibilities for intensification of farming systems are, however, constrained due to limited exchange on factor markets for labour, capital and animal traction. Therefore, major at-tention is given to the identification of economic incentives to farmers that permit them to improve the application of inputs (organic and inorganic fertilisers, manure) into more efficient production systems that satisfy both welfare and sustainabil-ity criteria.
The behaviour of the bio-economic farm house-hold model is strongly dependent on the specifica-tion of resource and market constraints. In Southern Mali, market imperfections prevail for labour, capital and animal traction. Labour and animal traction are limiting factors at the begin-ning of the cropping season when soil preparation must take place immediately after the first rainfall (Fafchamps, 1993). Access to capital for input purchase is constrained due to high risks associ-ated with rainfed production and the scarcity of collateral for borrowing, leading to a generally low development of financial institutions. More-over, within the framework of common property resources, land is non-tradable. Under these con-ditions, production and consumption decision, clearly depend on each other, and thus a recursive specification of the farm household model (based on non-separability) must be used (de Janvry et al., 1991). The existence of market failures also implies that intensification of agricultural produc-tion meets major difficulties since farmers must rely to a great extent on their internally available resources to improve factor productivity and soil nutrient balances (Corsi, 1994). Consequently, functional integration of cropping and livestock activities within the farm household becomes es-pecially important.
3. Technical coefficients
Technical options for arable cropping and live-stock production can be defined in terms of in-put – outin-put coefficients. For current production activities, these coefficients can be derived from field surveys, taking into account also the timing of input applications, the active ingredients and the exact weight of both the harvest and the sub-products (crop residues, manure). Alternative methods for producing the same commodities can only be derived from field experiments or agroe-cological simulation procedures. These alterna-tives are based on better procedures to optimise biomass production through: (i) reduction of wa-ter or nutrient constraints; and (ii) control of crop losses, making use of improved input applica-tions, crop residue management strategies, better
timing of operations (soil preparation, weeding, grazing) and the implementation of soil erosion control measures. We estimated a whole range of input – output coefficients for these potential pro-duction activities that guarantee higher levels of input efficiency and lower levels of soil nutrient depletion.
The so-called generation of technical coeffi-cients is based on different combinations of inputs that are converted into agricultural products (in-cluding sub-products) during the production sea-son (divided into five periods). Alternative production technologies for arable cropping are defined by Hengsdijk et al. (1996) according to: (i) soil type (quality, texture, rooting depth); (ii) rain-fall and water availability/distribution; (iii) re-liance on animal traction for soil preparation; (iv) utilisation of crop residues (harvesting, grazing or ploughing); (v) frequency of fallow for soil recov-ery; (vi) use of soil and water conservation mea-sures (simple or tied ridging); and (vii) anti-erosion measures (stone hedges). Similarly, livestock activities are specified with a stationary herd model, taking into account different animal production levels (milk, meat and traction). The requirements in terms of digestible organic matter are estimated according to the type of animal (age, production purpose) and the feed energy intake level. The quality and quantity of available animal feed depends on the type of pastures and the grazing strategy (permanent or seasonal graz-ing). These criteria applied to the defined crop-ping and livestock activities resulted in 6480 unique input – output coefficients that were subse-quently reduced to a feasible set of 1443 technical coefficients for arable cropping and 96 for live-stock activities.2
The procedures for estimating these alternative input – output coefficients are basically derived from agroecological simulation models. Techni-cally feasible production levels are determined, taking into account the most limiting factor (i.e. water, nutrients or plant diseases). In the next
step, different input requirements for these pro-duction levels are determined. Major attention is given to the interactions between soil characteris-tics and input efficiency (i.e. soil organic matter influencing nutrient availability; annual loss of organic matter due to decomposition that can be replenished by crop residues or manure) and the interactions between input use and soil manage-ment practices (conservation and anti-erosion practices influencing fertiliser and water efficiency; organic matter restoration through fallow prac-tices). These ‘synergy effects’ are usually disre-garded with direct estimates of production coefficients from empirical data (de Wit, 1992). Finally, soil organic matter and nutrient balances can be determined, taking into account the supply of external inputs (inorganic fertilisers, manure, crop residues), the uptake by the plants, and losses forthcoming from leaching, denitrification and harvesting of products (Smaling and Fresco, 1993). The latter procedure enables us to combine within a single framework information on produc-tion levels, input requirements and sustainability implications. Therefore, these agroecological sim-ulation procedures represent a highly useful ap-proach to analyse trade-offs and/or complementarities (i.e. potential win-win situa-tions) between production and sustainability ob-jectives. For this latter analysis, mathematical programming procedures are generally used (WRR, 1992; Barbier, 1994; Bade et al., 1997; Kuyvenhoven et al., 1998).
This approach for the quantification of alterna-tive technical coefficients for alternaalterna-tive (more sustainable) activities is widely used in explorative land use studies. Rabbinge and van Latesteijn (1992) rely on estimations for potential produc-tion to identify different long-term opproduc-tions for land use in the European Union. In a similar vein, Bouman et al. (1999) present an analysis for im-proved land use in the Atlantic Zone of Costa Rica, based on separate agroecological models of alternative input – output coefficients for cropping activities (LUCTOR) and pasture and livestock activities (PASTOR). Similar models are available for Malang, Indonesia (van Rheenen, 1994), and for the fifth region of Mali (Veenenklaas et al., 1994). Breman and Sissoko (1998) analyse the
technical feasibility of different technical options for agricultural intensification for the Soudano-Sahelien region, while Sissoko (1998) made use of these coefficients for the appraisal of suitable policy instruments that could enable the imple-mentation of promising technological options in Koutiala region of Mali. These models have in common that scientific information on the inter-actions between soil characteristics, weather (i.e. temperature and rainfall) and crop phenotypes is combined to derive technically feasible coefficients for improved production systems that make a more efficient use of available inputs and produce less soil erosion and nutrient depletion.
The agroecological approach for identifying al-ternative technical coefficients obviously has a great number of advantages. The analytical proce-dures are based on a detailed understanding of how production conditions and farming practices influence yield levels. Moreover, interactions be-tween cropping and livestock activities are explic-itly addressed, taking into account the use of crop residues as fodder, the use of animal traction for field preparations, and the manure applications for the recovery of crop fields. Finally, the agroe-cological analysis provides a clear insight into the locally relevant limiting factors for increasing yields or reducing nutrient balances. This is an important starting point for subsequent discus-sions on suitable policy measures that could be helpful in improving agricultural production in a suitable manner.
fre-quent occurrence of corner solutions when agroe-cological input – output coefficients are used within mathematical programming procedures. The limited stability and the lack of robustness of these bio-economic models makes them less useful for policy analysis since marginal effects can hardly be registered. In order to overcome these problems while maintaining the insights forth-coming from agroecological simulation proce-dures, meta-modelling techniques provide a useful additional tool.
4. Meta-modelling
Meta-modelling is an analytical procedure that has been developed to gain insight into the be-haviour of complex simulation models. The devel-opment of meta-models can serve different purposes (Kleijnen, 1987; Kleijnen and Sargent, 1997). In the first place, meta-modelling is meant to simplify the outcomes of simulation models with the objective of gaining better insight into the critical relationships within the simulation procedures. Secondly, meta-models are used for the validation and verification of the robustness of simulation models. Finally, meta-models are often much smaller in size and can be used to replace the original simulation model in subse-quent analyses. The latter objective is especially relevant for the purpose of this article, whereas we are looking for possibilities to integrate informa-tion derived from agroecological simulainforma-tion mod-els into an econometric model on farm household behaviour. This implies that the set of agroecolog-ical technagroecolog-ical input – output coefficients from crop-ping and livestock activities are analysed with regression techniques to define continuous pro-duction functions. This information is used again within the bio-economic mathematical program-ming model to analyse farm household allocative choice.
Meta-modelling offers a great possibility to overcome the mathematical programming limita-tions intrinsic to bio-economic farm household modelling that have been mentioned in the previ-ous paragraph, providing adequate procedures to capture large numbers of discrete input – output
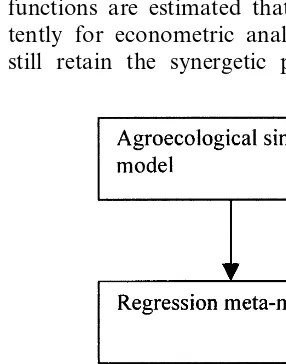
data in one model. Meta-models often have the form of a regression analysis of the input and generated output data of simulation models or mathematical programming models (Kleijnen, 1987). In Fig. 2 the basic steps of the meta-mod-elling approach are shown. In brief, the (meta-) regression model analyses the results of a (agroe-cological) simulation model and prepares the functional relationships that can be used again for mathematical programming analysis.
Different applications of meta-modelling are available from simulation models for the analysis of global warming (van Ham et al., 1990) and climate change (Kleijnen and Standridge, 1986). Kleijnen and Sargent (1997) provide general guidelines for the estimation of meta-models, in-cluding a number of tests for the specification of the adequacy of functional forms, the design of experiments to detect most limiting factors, and procedures to determine the validity of the meta-model.
Meta-modelling offers clear advantages for the processing of large data sets that are used again in subsequent mathematical programming proce-dures. Instead of discrete point data for technical input – output coefficients, continuous production functions are estimated that can be used consis-tently for econometric analysis. These functions still retain the synergetic properties (related to
complementary input) that are fundamental to agroecological simulation models, but permit more insight into the available options for factor substitution in which economists are primarily interested. Moreover, an even wider range of in-put – outin-put coefficients becomes available that enhances the stability of the model and prevents the occurrence of corner solutions. Finally, the estimated functions still include all points of tech-nical efficiency but enable a more detailed analysis of marginal effects.
The performance of meta-models demonstrates in practice a number of problems related to the typical distribution of observations and error terms. Since most meta-models are derived from rather deterministic simulation procedures, prob-lems with heteroscedasticity and serial correlation frequently appear. Therefore, Durbin – Watson statistics and the White test should be carefully analysed. The relative prediction error can be calculated, based on the percentage change in the forecasted value of the regression function when one observation is deleted. Other problems arise when joint output is considered in the meta-model (e.g. yields and nutrient balances). In this article we calculated the environmental implications of selected input – output coefficients by using again the original agroecological data. In principle, both yields and environmental effects could also be estimated simultaneously using two-stage least square (2SLS) procedures (Pindyck and Ru-binfeld, 1991). Otherwise, parametric distance functions might offer a suitable alternative (Rein-hard and Thijssen, 1998).
5. Results
To explore the potential of meta-modelling for bio-economic household modelling, the procedure is applied to the production side of a bio-eco-nomic farm household model for Koutiala region in Southern Mali (Kruseman and Bade, 1998). The original data for the meta-model consist of a series of discrete technical input – output coeffi-cients for current and alternative (or potential) production activities. These coefficients stem in turn from the agroecological simulation model.
The meta-model can be optimised within a mathe-matical programming framework. Optimisation takes place for the farm household objective of consumption utility.
The meta-modelling approach is applied to this series of several hundreds of data points for all crop and livestock activity to derive continuous production functions for each activity, making use of the Battese (1996) procedure to account for zero input use. For arable cropping, we estimated the following Cobb – Douglas production function3
:
lnY=b0+b1 ln(L)+b2 ln(T)+b3 ln(N)
+b4 ln(P)+b5 ln(M) (1)
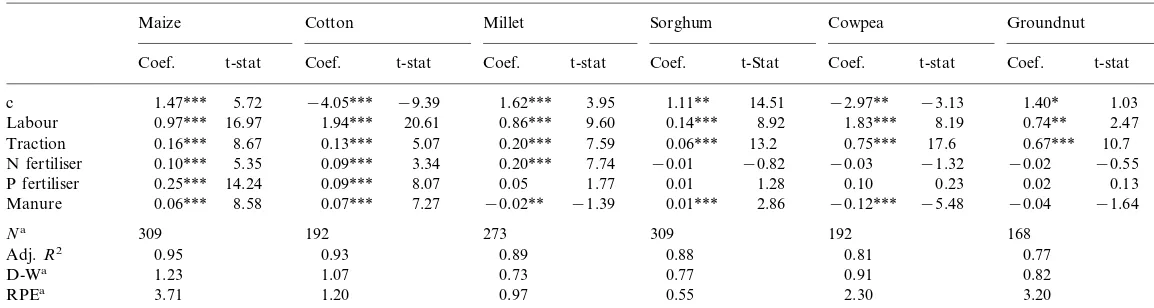
where Y represents the quantity of the different harvested crops (in monetary units), Land Tare the total amounts of labour and traction (in working days);NandPare the amounts of active ingredients of nitrogen and phosphorous fertilis-ers applied to the crop (in kg/ha); and M is the amount of manure applied (in kg/ha). Table 1 shows the results of the production functions for cropping activities using the White correction for heteroscedasticity.
The results of the estimated functions are ac-ceptable. All but a few signs for inputs are posi-tive and those negaposi-tive are not significant. The coefficients for labour are positive and significant, and especially in cotton and cowpea production the elasticity of labour is high. This is consistent with the scarcity of labour in the research area. The traction elasticities for cereals and cotton are estimated between 0.06 and 0.20, while for cowpea and groundnut these are estimated to be about 0.7. The (valid) coefficients for different types of fertilisers are lower than 0.3; for sor-ghum, cowpea and groundnut the fertiliser coeffi-cients are, however, not significant. The negative coefficients for manure in millet and cowpea pro-duction are difficult to explain since it is common
Ruben
,
A
.
6
an
Ruij
6
en
/
Ecological
Economics
36
(2001)
427
–
441
435
Table 1
Cobb–Douglas production functions for cropping activities (Coefficients and t-statistics using OLS regression)
Sorghum Cowpea Groundnut
Maize Cotton Millet
t-stat Coef. t-Stat Coef. t-stat Coef.
Coef. t-stat
Coef. t-stat Coef. t-stat
−9.39 1.62*** 3.95 1.11** 14.51 −2.97** −3.13 1.40* 1.03
c 1.47*** 5.72 −4.05***
9.60 0.14*** 8.92 1.83*** 8.19 0.74**
0.86*** 2.47
0.97***
Labour 16.97 1.94*** 20.61
0.20***
0.16*** 8.67 0.13*** 5.07 7.59 0.06*** 13.2 0.75*** 17.6 0.67*** 10.7
Traction
7.74 −0.01 −0.82 −0.03 −1.32 −0.02
N fertiliser 0.10*** 5.35 0.09*** 3.34 0.20*** −0.55
1.77 0.01 1.28 0.10 0.23 0.02
0.05 0.13
P fertiliser 0.25*** 14.24 0.09*** 8.07
−1.39 0.01*** 2.86 −0.12*** −5.48 −0.04
Manure 0.06*** 8.58 0.07*** 7.27 −0.02** −1.64
309 192 168
273 192
309 Na
Adj.R2 0.95 0.93 0.89 0.88 0.81 0.77
0.77 0.91 0.82
0.73
D-Wa 1.23 1.07
0.55
RPEa 3.71 1.20 0.97 2.30 3.20
aNis the number of observations; D-W is the Durbin–Watson statistic; and RPE is the relative prediction error (in %) *PB0.05.
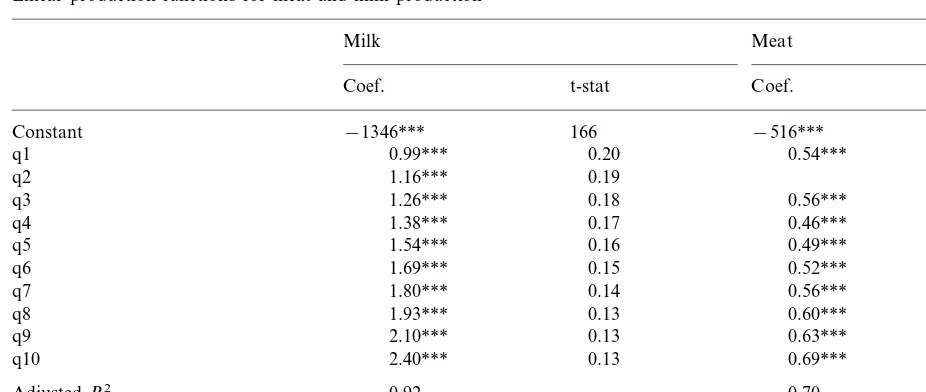
Table 2
Linear production functions for meat and milk productiona
Milk Meat
t-stat Coef. t-stat
Coef.
−516*** −7.16
Constant −1346*** 166
6.85
q1 0.99*** 0.20 0.54***
q2 1.16*** 0.19
0.18 0.56*** 7.46
q3 1.26***
5.26 0.46***
q4 1.38*** 0.17
0.16 0.49*** 6.24
q5 1.54***
7.24 0.52***
q6 1.69*** 0.15
0.14 0.56*** 8.34
q7 1.80***
9.37 0.60***
q8 1.93*** 0.13
0.13 0.63*** 10.1
q9 2.10***
0.69***
q10 2.40*** 0.13 11.0
0.70
AdjustedR2 0.92
0.19
Durbin–Watson Stat. 0.17
96 Number of observations 96
aq1…q10 are food categories of different qualities. In the function for meat q1 and q2 are estimated together. ***PB0.001.
understanding that additional manure should have a neutral or positive influence on crop yield. Apparently, input efficiency of nutrients derived from organic manure is rather limited compared to chemical fertilisers (Ruben and Lee, 2000). Moreover, part of the nutrients from organic manure may become immobilised into lower soil-layers. The production function for groundnut has the lowest R2 and only two coefficients are significant. All functions for crop production have increasing returns to scale, as can be derived from the sum of the individual input elasticities. The Durbin – Watson statistics are relatively low, probably due to serial correlation related to the fixed soil-input relations in the agroecological simulation model.4
Livestock activities are defined for meat and milk production under different regimes of animal feeding. These feeding categories are related to the maintenance requirements and the needs for pro-duction, taking into account the feed source
(pas-ture, crop residues, cotton cake) and quality (N-content and digestible organic matter) of dif-ferent feed types. We used the following linear specification for the production function of livestock:
ln Y=b0+b1 (q1)+b2 (q2) ……b10 (q10) (2)
where q1…q10 represent feed sources available during the wet and dry season that correspond to different levels of energy intake and digestible organic matter. In Table 2 the results for the functions for meat and milk production are shown.
The coefficients in Table 2 are all positive and most of them are significant at the 99% level, except for the constants. The negative constant can be explained by the fact that cattle needs feed for maintenance, which does not contribute di-rectly to production. Only above a certain level of food intake do cattle start producing milk and meat. The variables q1 and q2 in the equation of meat could be estimated together, as the Wald test indicates that they were not significantly different 4Attempts were made to include a dummy for different soil
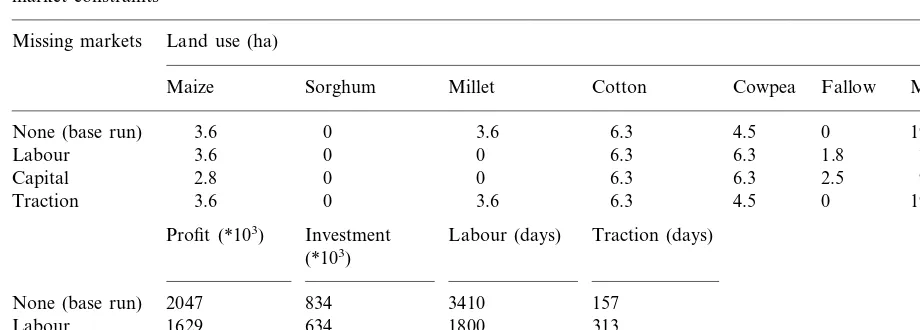
Table 3
Land use pattern, input use and farm household profit and investment under the assumption of perfect markets and with different market constraintsa
Land use (ha) Missing markets
Meat
Maize Sorghum Millet Cotton Cowpea Fallow Milk
1931
None (base run) 3.6 0 3.6 6.3 4.5 0 3200
1.8 770
Labour 3.6 0 0 6.3 6.3 3200
3200 907
Capital 2.8 0 0 6.3 6.3 2.5
3200
Traction 3.6 0 3.6 6.3 4.5 0 1964
Profit (*103) Investment Labour (days) Traction (days) (*103)
None (base run) 2047 834 3410 157
Labour 1629 634 1800 313
Capital 1750 600 2282 192
Traction 2042 849 3500 120
aAll crops in hectares, meat and milk in kg; profit and investment in Fcfa.
from each other. The adjusted R2
value is very high which indicates a good fit. However, the Durbin – Watson statistics indicate that in these functions positive serial correlation occurs.
The estimated functions for crop and animal production are incorporated into a non-linear bio-economic farm household model (Bade et al., 1997; Kruseman and Bade, 1998) which is opti-mised for the objective of expected utility of con-sumption, given the availability of resources (land, labour, traction):
Max EU=S (u·C (Y*−pe·E) (3)
s.t. Y*=pi·I+pc·C+pl·L (4)
where C represents a vector of consumption goods, Y* represents income derived from pro-duction, I represents the different inputs, L is labour force, andpare their respective prices. The vectorEincludes environmental externalities (e.g. nutrient losses) valued against their replacement costs. For optimisation the standard Gams soft-ware is used. When market constraints are effec-tive, this implies that only resources available at the farm household can be used. In the base run, households can fully rely on purchased inputs as long as their budget permits. After optimising the household model, soil nutrient and organic matter balances are calculated for the selected technical
coefficients as major indicators for the sustainabil-ity and resilience of the system (Hengsdijk et al., 1996).5
The household model is first optimised under the assumption of perfect markets, allowing for separability and thus sequential optimisation (Singh et al., 1986). This base run of the model is used as a reference point. Subsequently, con-straints are imposed on the labour, capital and animal traction market by limiting the use of these inputs to the quantities owned by house-holds. The model specifications with different market imperfections are optimised in a non-sepa-rable way, which means that the production and consumption part are estimated simultaneously (Delforce, 1994). In Table 3, the model outcomes under the assumptions of perfect and missing markets are presented.
Table 3 demonstrates that missing markets di-minish the production of crops and meat consid-erably. The labour market constraint causes a shift from millet production towards less labour-intensive fallow and cowpea activities, while the area for maize production is maintained. Conse-quently, less crop residues are available for meat
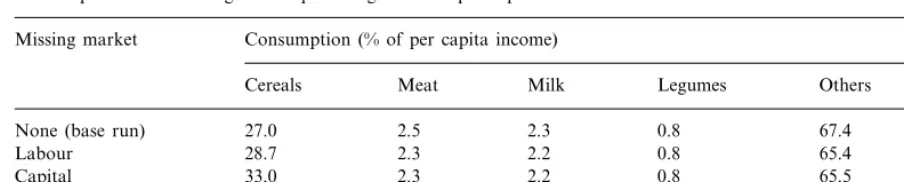
Table 4
Consumption of different goods as percentage of total per capita income Missing market Consumption (% of per capita income)
Meat Milk
Cereals Legumes Others Utility
2.5 2.3 0.8
27.0 67.4
None (base run) 715
2.3 2.2 0.8
Labour 28.7 65.4 528
2.3 2.2 0.8
33.0 65.5
Capital 593
2.5 2.3
Traction 27.0 0.8 67.5 714
production. The market constraint for capital causes a shift from maize and millet production to less input-intensive cowpea production and fal-low, occasioning a similar decline of crop residues for meat production. With a restriction on the market for animal traction the original land use pattern is maintained, but production activities become far more labour- and input-intensive.
The introduction of market imperfections re-duces the level of profit due to changes in the land use pattern and/or shifts in production technolo-gies. Missing markets for labour and capital clearly reduce their factor intensity in the produc-tion process. Apparently, animal tracproduc-tion and labour can be used as substitutes: with a missing labour market the use of animal traction rises sharply, while the use of labour increases when constraints for animal traction are imposed. In principle, when different market imperfections co-incide, possibilities for factor substitution will fur-ther decrease.
The utility levels for the four different model specifications behave consistently. With market imperfections utility decreases compared to the situation with perfect markets. Table 4 shows the results for the consumption side of the model.
Consumption of all categories of goods is lower when market constraints are taken into consider-ation. The shift from meat consumption towards cereals if per capita income falls is consistent with consumer demand theory where meat is normally considered as a luxury good. Consequently, a decrease in income will cause a more than propor-tional fall in meat consumption. Cereals are con-sidered to be basic requirements for food security and therefore cereal consumption does not de-crease as much as meat consumption.
The implications of market imperfections for the soil quality under different production systems can be reviewed through the calculation of nutri-ent balances. Whereas differences in nutrinutri-ent bal-ances between various cropping activities are large, the deviations between the model specifica-tions are relatively small. This can be explained by the fact that the yields per hectare and fertiliser use per hectare differ only slightly between the models with market imperfections. Consequently, nutrient balances are relatively stable as well. The influence of labour and capital market imperfec-tions is most pronounced in the increase of fallow. In this case, market imperfections have a general ‘positive’ effect on sustainability, though at the expense of a decreasing farm household income. Table 5 shows soil nutrient balances under differ-ent market conditions:
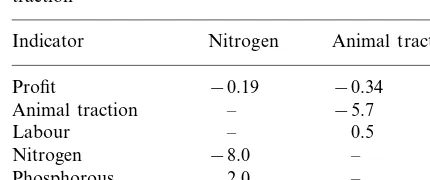
For policy purposes, we are interested in analysing the effects of higher factor prices (result from structural adjustment programmes) on input use and farm household profit. Table 6 shows the effects of price increases for N-fertiliser and ani-mal traction in order to review the responsiveness of the bio-economic farm household model. A 10% increase of N-fertiliser results in small
de-Table 5
Nutrient balances in optimal solutions (kg/ha)a
N-balance P-balance C-balance Missing market
−4.1
None (base run) −27 −1752
−1400
−3.8
Labour −24
−22
Capital −3.4 −1401
Traction −26 −3.7 −1743
Table 6
Implications of a 10% increase of N-fertiliser price and animal tractiona
Indicator Nitrogen Animal traction
Profit −0.19 −0.34
Animal traction – −5.7 0.5 –
Labour
−8.0
Nitrogen –
– 2.0
Phosphorous
Manure 2.2 –
aFigures give percentage change in indicator values com-pared to the base run.
6. Discussion and conclusions
Limited availability of large and consistent data sets necessary for the empirical simulation of tech-nical input – output coefficients for bio-economic models is one of the major bottlenecks in policy analysis. Decision-support systems for policy makers should be able to address issues related to the implications of technological change for farm-ers’ welfare and sustainable resource manage-ment, and could be helpful to identify feasible policy instruments to induce farmers towards the adoption of these technologies. Therefore, be-havioural aspects of farmers’ choice and available options for technological change must be com-bined within a single and consistent modelling framework.
In this paper we applied a meta-modelling ap-proach for the production side of a bio-economic farm household simulation model in order to generate continuous production functions on the basis of discrete production data that can be derived from agroecological simulation results. These data are linked to a bio-economic mathe-matical programming model that takes into ac-count both production behaviour (technological choice) and consumption preferences in a recur-sive manner.
The basic farm household model in which these production functions for cropping and livestock activities are incorporated shows a consistent be-haviour. When no market constraints are consid-ered (i.e. assuming separability between production and consumption), the household re-lies strongly on market exchange for labour and animal traction. The introduction of market con-straints for labour, capital and animal traction in the model (i.e. assuming non-separability) leads to substantial changes in land use and production technologies in favour of less-intensive cropping and feeding activities, and consequently also a lower profit. This implies in turn a sacrifice in terms of household consumption and welfare.
The use of meta-models to replace a series of discrete input-output data in a farm household model is a promising concept. Meta-modelling offers the possibility to improve the operational use of farm household models since the large creases in N-fertiliser use for crop production,
numbers of (actual and potential) production pos-sibilities are condensed into a limited number of continuous production functions. Moreover, these production functions enable the appraisal of pro-duction activities that are both technically and economically efficient. Traditional shortcomings of agroecological simulation procedures related to the neglect of factor substitution can be overcome within this framework, while fundamental insights into the synergetic relations amongst different in-puts as well as between cropping and livestock activities are retained.
Some critical notes could be made regarding this approach. Firstly, a meta-model is essentially ‘a model of a model’ and therefore important basic specifications can be lost. This implies that the functional forms used to estimate the meta-model are of crucial importance. Secondly, the possibilities to evaluate the robustness of meta-models are still rather limited. It is good practice to rely on different time-series of input – output data that can be used for: (i) the estimation y calibration of the meta-model; and (ii) the valida-tion of the meta-model vis-a`-vis the results derived with the original simulation model, per-mitting a comparison of the outcomes of the simulation model and the meta-model. The model we used for Southern Mali did not permit such a procedure due to the absence of data, and there-fore we relied on the relative prediction error as a measure for the robustness of the meta-model. Finally, while bio-economic models are built to analyse changes in farm household welfare and adjustment in agroecological nutrient and soil or-ganic matter balances, the environmental implica-tions of selected input – output coefficients were calculated by using the original agroecological data. In principle, parametric distance functions could be used to analyse both effects simultaneously.
It can be concluded that the presented meta-modelling approach provides a useful tool to ex-plore the characteristics of the discrete technical input – output coefficients that are subsequently incorporated into the framework of a dynamic and continuous bio-economic farm household model. These procedures enable improvement of the specification and the robustness of
meta-mod-els based on data sets derived from different disciplines. Policy simulations based on such inte-grated models could provide consistent estimates of response elasticities based on income, substitu-tion and scale effects.
Acknowledgements
The authors wish to acknowledge the co-opera-tion received by the Institut d’Economie Rurale (IER) in Bamako, Mali, within the framework of the Project Production Sudano Sahelienne (PSS). We owe special thanks to Huib Hengsdijk and Herman van Keulen for access to the technical coefficient generator for land use activities in the Koutiala region of Southern Mali.
References
Bade, J., Hengsdijk, H., Kruseman, G., Ruben, R., Roebeling P., 1997. Farm household modelling in a regional setting: the case of Cercle de Koutiala, Mali. DLV Report No. 6, Wageningen Agricultural University, Wageningen, 40 pp. Barbier, B., 1994. Modelidation agronomique et economique
de la durabilite´ d’un syste`me agraire villageois. PhD thesis, CIRAD-SAR, Montpelier, 146 pp.
Battese, G., 1996. A note on the estimation of Cobb-Douglas production functions when some explanatory variables have zero values. J. Agri. Econ. 48, 250 – 252.
Berckmoes, W.M.L., Jager, E.J., Kone, Y., 1990. L’intensifica-tion agricole au Mali-Sud: Souhait ou Realite? Bulletin No. 314, Royal Tropical Institute, Amsterdam, pp. 40. Corsi, A., 1994. Imperfect labour markets, preferences, and
minimum income as a determinants of pluriactivity choices. In: Caillevet, F., Guyonard, H., Lifran, R. (Eds.), Agricultural Household Modelling and Family Economics. Elsevier, Amsterdam, pp. 87 – 110.
de Janvry, A., Fafchamps, M., Sadoulet, E., 1991. Peasant household behaviour with missing markets: some para-doxes explained. Econ. J. 101, 1400 – 1417.
de Wit, C.T., 1992. Resource use efficiency in agriculture. Agri. Syst. 40, 125 – 151.
Delforce, J., 1994. Separability in farm household economics: an experiment with linear programming. Agri. Econ. 10, 165 – 177.
Deybe, D., 1998. Can agricultural sector models be a tool for policy analysis? An application for the case of Burkina Faso. Agri. Syst. 58, 367 – 380.
Hazell, P.B.R., Norton, R.D., 1986. Mathematical Program-ming for Economic Analysis. Macmillan, New York. Hengsdijk, H., Quak, W., Bakker, E.J., Ketelaars, J.J.M.H.,
1996. A technical coefficient generator for land use activi-ties in the Koutiala region in South Mali. DLV Report No.6. WAU/AB-DLO, Wageningen, 96 pp.
Kleijnen, J.P.C., 1987. Statistical Tools for Simulation Practi-tioners. Marcel Dekker, New York.
Kleijnen, J.P.C., van Groenendaal, W., 1992. Simulation a Statistical Perspective. Wiley, Chichester.
Kleijnen, J.P.C., Sargent, R.G., 1997. A methodology for fitting and validating meta-models in simulation. Research paper No.116, Katholieke Universiteit Brabant, Tilburg, 12 pp.
Kleijnen, J.P.C., Standridge, C.R., 1986. Experimental design and regression analysis in simulation: an FMS case study. Serie research memorandum No. 212. Katholieke Univer-siteit Brabant, Tilburg, 32 pp.
Kruseman, G., 1999. Bio-economic farm household modelling for agricultural intensification. PhD Thesis. Wageningen Agricultural University, Wageningen (in press), 251 pp. Kruseman, G., Bade, J., 1998. Agrarian policies for
sustain-able land use: bio-economic modelling to assess the effec-tiveness of policy instruments. Agric. Syst. 58 (3), 465 – 481. Kruseman, G., Hengsdijk, H., Ruben, R., Roebeling, P., Bade, J., 1997. Farm household modelling system for the analysis of sustainable land use and food security: theoretical and mathematical description. DLV Report No.7. WAU/ AB-DLO. Wageningen, 56 pp.
Kuyvenhoven, A., Ruben, R, Kruseman, G., 1998. Technol-ogy, market policies and institutional reform for sustain-able land use and food security. Agric. Econ. 19, 53 – 62. Munasinghe, M., Cruz, W., 1994. Economy Wide Policies and
the Environment. World Bank, Washington DC. Pindyck, R.S., Rubinfeld, D.L., 1991. Econometric Models
and Economic Forecasts. McGraw-Hill, New York. Rabbinge, R. (Ed.), 1990. Theoretical production ecology:
reflections and prospects. Pudoc simulation monographs, Wageningen, 276 pp.
Rabbinge, R., van Ittersum, M.K., 1994. Tensions between aggregation levels. In: Fresco, L.O., Stroosnijder, J., Bouma, J., van Keulen, H. (Eds.), The Future of the Land, Mobilising and Integrating Knowledge for Land Use Op-tions. Wiley, Chichester, pp. 31 – 40.
Rabbinge, R., van Latesteijn, H.C., 1992. Long-term options for land use in the European Community. Agri. Syst. 40, 195 – 210.
Ruben, R., Lee, D.R., 2000. Combining internal and external inputs for sustainable intensification. 2020 Policy Brief No. 65. International Food Policy Research Institute, Washing-ton, 2 pp.
Ruben, R., Kuyvenhoven, A., Kruseman, G., 1998. Bio-eco-nomic models for eco-regional development: policy instru-ments for sustainable intensification. Paper presented at pre-conference workshop 1998 of the American Associa-tion for Agricultural Economics (AAAE) annual meeting ‘Agricultural Intensification, Economic Development and the Environment’, Salt Lake City, August 1998, 45 pp. Sadoulet, E., de Janvry, A., 1995. Quantitative Development
Policy Analysis. Johns Hopkins Press, Baltimore. Schipper, R.A., 1996. Farming in a fragile future: economics
of land use with applications in the Atlantic Zone of Costa Rica. PhD thesis. Wageningen Agricultural University, Wageningen, 282 pp.
Singh, I., Squire, S., Straus, J. (Eds.), 1986. Agricultural Household Models, Extensions, Applications and Policy. Johns Hopkins Press, Baltimore.
Sissoko, K., 1998. Et demain l’agriculture? Options techniques et mesures politiques pour un de´veloppement agricole durable en Afrique subsaharienne; Cas du Cercle de Koutiala en zone sud du Mali. Documents sur la gestion des Resources Tropicales no. 23, Universite´ Wageningen, Wageningen, 184 pp.
Smaling, E.M.A., Fresco, L.O., 1993. A decision-support model for monitoring nutrient balances under agricultural land use (NUTMON). Geoderma 60, 235 – 256.
van Ham, G., Rotmans, J., Kleijnen, J.P.C., 1990. Gevoe-ligheidsanalyse via meta-modellen en proefopzetten, toege-past op het broeikassimulatiemodel IMAGE. Rapport Rijks instituut voor Volksgezondheid en Milieuhygiene (RIVM) No. 758471010, Bilthoven. 40 pp.
van Keulen, H., Wolf, J. (Eds.), 1986. Modelling Agricultural Production: Weather, Soils and Crops. Pudoc Simulation Monographs, Wageningen, 114 pp.
van Rheenen, T., 1994. Farm household level optimal resource allocation: an explorative study in the limestone area of East Java. PhD Thesis. Wageningen Agricultural Univer-sity, Wageningen, 145 pp.
Veenenklaas, F.R., van Keulen, H., Cisse, S., Gosseye, P., van Duivenboden, N., 1994. Competing for limited resources: options for land use in the Fifth Region of Mali. In: Fresco, L.O., Stroosnijder, J., Bouma, J., van Keulen, H. (Eds.), The Future of the Land: Mobilising and Integrating Knowledge for Land Use Option. Wiley, Chichester, pp. 227 – 247.
WRR, 1992. Ground for Choices: Four Perspectives for the Rural Areas in the European Community. Report Nether-lands Scientific Council for Government Policy. SDU, The Hague.