ANALYSIS
Incorporating distributional considerations in the safe
minimum standard approach: endangered species and local
impacts
Robert P. Berrens
a,* , Michael McKee
a, Michael C. Farmer
baDepartment of Economics,Uni6ersity of New Mexico,Albuquerque,NM87131,USA bSchool of Public Policy,Georgia Institute of Technology,Atlanta,GA30334,USA Received 28 April 1998; received in revised form 5 November 1998; accepted 22 February 1999
Abstract
Explicitly incorporating current distributional concerns into the safe minimum standard (SMS) approach is the objective of this study. The SMS approach is a collective choice process that prescribes protecting a minimum level of a renewable natural resource unless the social costs of doing so are somehow excessive or intolerably high. More complete implementation of an SMS approach, if it is to be a pragmatic policy tool, requires that distributional considerations be included in determining whether the economic consequences of preservation actions are intolerable. Two case studies involving the US Endangered Species Act are used to illustrate how distributional concerns might be incorporated into the SMS approach. © 1999 Elsevier Science B.V. All rights reserved.
Keywords:Safe minimum standard ; Distributional consequences ; Endangered species
www.elsevier.com/locate/ecolecon
1. Introduction
Explicitly considering current distributional concerns in the safe minimum standard (SMS) approach is the objective of this study. The SMS approach is a collective choice process that pre-scribes protecting a minimum level (safe standard) of a renewable natural resource unless the social
costs of doing so are somehow excessive or intol-erably high. More complete implementation of an SMS approach, if it is to be a pragmatic policy tool, requires that distributional considerations be included in determining whether economic effects of preservation actions are intolerable. Two prominent case studies involving the US Endan-gered Species Act (ESA) are used to illustrate how distributional concerns might be incorporated into the SMS approach.
First advanced by Ciriacy-Wantrup (1952), the SMS approach has been widely discussed (e.g. * Corresponding author. Tel.: +1-505-2779004; fax: +
1-505-2779445.
E-mail address:[email protected] (R.P. Berrens)
Bishop, 1978). The SMS approach is argued to apply in situations involving true (Knightian) un-certainty and irreversibility, but actual applica-tions remain rare. Appeals to the SMS approach are common in discussions of sustainability (Folke et al., 1994Turner et al., 1994Castle, 1996), often with respect to protecting at-risk species and biodiversity (Randall, 1991Bishop, 1993).
In applying an SMS approach to protecting an at-risk species (or set of species), the burden of proof lies in demonstrating that the economic consequences of preservation activities are intoler-able. What constitutes intolerable is to be decided by the social or political consensus process in any particular case (Farmer and Randall, 1998). How-ever, investigation of the types of considerations that might constitute intolerableness is critical to the SMS approach as a pragmatic policy tool. Following Randall (1991), invoking the intolera-ble cost argument to circumvent preservation ought to require some ‘extraordinary decision process’.
Several sources have noted that the general structure of the ESA, as amended, is consistent with the SMS approach (Castle and Berrens, 1993Woodward and Bishop, 1997). In reviewing the lengthy ESA process for the northern spotted owl in the Pacific Northwest, Thomas and Verner (1992 p. 637) make a similar argument, albeit without explicitly identifying the SMS approach (and see Booth, 1994 p. 238). For the case of endangered fishes in the Colorado River, Berrens et al. (1998) use the results from federal court-or-dered US Fish and Wildlife Service (USFWS) implementation to illustrate how the ESA was consistent with the SMS approach. Specifically, in the exclusion process for designating critical habi-tat, the lack of severe economic costs was deter-mined by comparing expected aggregate regional economic impacts against historical fluctuations in the regional economy. However, this step to-wards implementing the SMS approach fails to incorporate distributional concerns, which may be important in defining intolerable economic costs of species preservation actions. Endangered spe-cies debates are often focused on the distribution of economic consequences (Brown and Shogren, 1998). Randall and Farmer (1995) acknowledge
that an SMS approach might be amended to included distributional considerations.
The case studies involve results from previous economic analyses done by or for the USFWS in two prominent ESA cases: (1) endangered fishes in the Colorado River; and (2) the northern spot-ted owl in the Pacific Northwest. These cases illustrate the general link between the ESA and the SMS approach, but also bring out the impor-tance of including distributional and compensa-tion issues in considering what might constitute intolerable costs.
2. The SMS approach: from ethical issues to providing practical guidance
Irreversible species losses involve intergenera-tional equity issues (Norton, 1987). Present value benefit-cost decision rules neglect fundamental ethical issues such as intergenerational allocation of natural assets. Thus, it may be necessary to go beyond standard efficiency criteria (Bishop, 1993). One widely discussed alternative to standard benefit-cost analysis (BCA) is the SMS approach. While the SMS approach begins with the assump-tion that preservaassump-tion of at-risk species is a priori beneficial, there is no ‘trump card’ (Randall, 1991). With respect to protecting natural capital assets for the future, the SMS approach has been viewed as falling between ‘strong’ and ‘weak’ sustainability perspectives (Turner et al., 1994). The SMS approach is a conditional imperative, recognizing the need to protect ‘critical’ natural capital (e.g. species habitat), but remaining sensi-tive to costs. Bishop (1980 p. 209) frames the ethical decision problem as: ‘To what extent is it fair for the current generation to bear costs in order to reduce uncertainty faced by future generations?’
for intragenerational equity is motivated by the same ethical mandate of fairness (distributive jus-tice) as that underlying intergenerational equity (Folke et al., 1994).
Farmer and Randall (1998) argue that trying to resolve our obligations to the future while weigh-ing current interests imposes a ‘responsibility to seek consensus’ across moral arguments; thus, a shift away from strict benefit-cost decision rules is not logically inconsistent. Certainly, potential ir-reversibility coupled with a high degree of uncer-tainty and complex environmental goods that are not priced and traded in markets imposes an exceptional burden on regular decision-making processes.1
Standard BCA assumptions may be violated. BCA is strongly consequentialist and welfarist (Berrens and Polasky, 1995Randall and Farmer, 1995), requiring identification of all out-comes, assuming complete individual preference orderings, and depending on accurate measure-ment and aggregation of individual values.
Assigning monetary values to species preserva-tion benefits may be especially problematic. Both supporters and critics of nonmarket valuation, including controversial applications of the contin-gent valuation (CV) method to measure nonuse values, call for further exploration of the SMS approach (Vatn and Bromley, 1995Loomis and White, 1996). In their recent meta-analysis of endangered species CV results, Loomis and White (1996) argue that there is important systematic information about preservation benefits. How-ever, acknowledging various composition and adding-up problems, they stop short of endorsing the use of such values in strict benefit-cost deci-sion rules, and instead support an SMS approach to protecting endangered species.
Others argue that a valid SMS approach should necessarily require the measurement of preserva-tion benefits (including nonuse values) in the
defining the net social costs of preservation (e.g. Crowards, 1998).2 While one can support the logic for including estimated species preservation benefits in defining net social costs, the practical concern lies with validly estimating nonuse values. Economists remain highly divided on the validity of CV for estimating nonuse values (Diamond and Hausman, 1994Hanemann, 1994). As indi-cated by recent history with natural resource dam-age law (Jones and Pease, 1997), the potential for formally requiring inclusion of nonuse values in ESA economic analyses would appear unlikely.3
Whether or not the full range of nonmarket and social values are included in defining the (net) social costs of preservation actions, the protection offered by the SMS approach is not absolute, and this poses a conundrum. An SMS approach ini-tiated out of concern for incomplete articulation of our obligations to the future, and even current social policy objectives4, must be checked by a measure of what costs are tolerable. As such, the SMS approach often appears to be a muddle through process (Hohl and Tisdell, 1993Rolfe, 1995).
This might appear to leave real world practi-tioners with little guidance, and condemned to oversee a slow, cumbersome process. But, by not
2Crowards (1998, p. 308), argues for including the ‘rela-tively near-term quantifiable benefits’ of preservation. Gowdy (1997, p. 38), argues to extend the SMS to include the preser-vation benefits of ‘evolutionary potential’.
3Brown and Shogren (1998, p. 13) argue that despite ex-traordinary analytical difficulties, ‘‘determining at least a plau-sible range for these values would seem to be essential if we are to make judgements about the benefits of preservation.’’ Berrens et al. (1998) argue that while the SMS approach is not dependent on nonmarket valuation information, estimates of preservation benefits could be considered within the ESA process, as a kind of separate piece of economic information (which may have its own distributional issues). Further, if economic studies are impact analyses, then this presents ques-tions of consistently combining with estimates of preservation benefits.
4For example, a recurrent ESA policy question is what is the exact preservation objective (e.g. individual species, ecosys-tems or genetic diversity)? Metrick and Weitzman (1998) provide evidence that agency actions have tilted toward pro-tecting ‘charismatic megafauna’.
taking seriously the ambiguities that initiate con-sideration of the SMS approach, attempts to rec-oncile to pre-articulated social objectives miss the point. Ambiguities about how to balance current concerns with duties to the future ‘compels a resource manager to regulate by consensus’ (Farmer and Randall, 1998). Consensus processes can be focused by anchoring to relevant and familiar issues. To the extent that the dimensions of preservation costs (size and distribution) are immediate, these costs can serve as a touchstone. Some scholars express legitimate concern that an unarticulated value for the full range of social benefits of preservation disadvantages those pro-tections against clearly articulated costs (Norton, 1995); e.g. in the rush to get something done the difficult-to-measure benefits of preservation may not be fully considered. An alternative concern is that management practices for species preserva-tion may frequently be delayed (as is common under the ESA) in measuring impacts and their distribution. Such delay risks unnecessarily over-riding protection actions in the political consensus process, since unmitigated costs can mount. The sooner these costs and their distribution are artic-ulated, the less muddled the consensus process can become. Thus, working to some political con-sensus on what constitutes intolerable cost is a central issue. Properly conceived, the SMS ap-proach is a collective choice process and not just identification of safety standards.
3. Linking the ESA and the SMS approach
3.1. Conceptual links
The ESA of 1973, as amended, contains several provisions that are conceptually consistent with the SMS approach. While the initial orientation of the ESA is towards protecting a listed species, information on economic consequences can be used at several points in the process.
To be protected under the ESA, a species must be listed either as ‘threatened’ or ‘endangered’. The listing decision is to be made utilizing the best scientific data available, and cannot be based on any economic analysis. Once listed, critical
habi-tat for the species must be proposed, and a recov-ery plan developed by the implementing agency (primarily the USFWS). The critical habitat desig-nation process requires a draft economic analysis, which begins with a biological evaluation to ob-tain habitat requirements, which are then con-verted into direct economic impacts by linking habitat requirements to economic activities that must be altered. After public comment and input, the final economic analysis is used along with physical and biological data as inputs into the exclusion process. The ESA (Section 4) requires consideration of economic and other relevant im-pacts in deciding whether to exclude areas from the critical habitat. Such exclusion cannot jeopar-dize recovery of the listed species and be likely to cause extinction.
Thus, in implementation the ESA directs that probable economic ‘impacts’ be considered in the exclusion process, and this necessitates economic modeling (e.g. input – output [I – O] or computable general equilibrium [CGE]). While falling short of strict economic surplus measures, impact analyses are often the only practical measure of economic consequences. Aside from this pragmatic perspec-tive, changes in economic activity will often be focused on in the public debate over critical habi-tat cases (Berrens et al., 1998).
While the ESA permits exclusion only if the species is not threatened with extinction, it con-tains a second level exemption opportunity be-yond the critical habitat exclusion process. This additional opportunity comes under Section 7 in the form of special hearings. Section 7 applies exclusively to federal agencies and requires that their actions not jeopardize the existence of the species, or destroy or adversely modify designated critical habitat (Rohlf, 1989). However, an appeal can be made to an Endangered Species Commit-tee (the ‘God Squad’), which possesses the author-ity to permanently exempt species from ESA protection. The committee is composed of federal cabinet-level members and an appointed represen-tative for each state involved.
is in the ‘public interest.’ The Committee has the power to designate an administrative judge, secure information, hold hearings, subpoena witnesses, and allow cross-examination. The type of infor-mation that might be included in any particular hearing could be wide ranging (e.g. economic impacts, distributional concerns, and evidence on nonmarket values). In practice, the critical habitat exclusion process is commonly used while the exemption process has been rarely used.
In summary, the exclusion process under the ESA allows the exemption of individual areas from designated critical habitat if inclusion would entail severe economic impacts, and a second level decision process can allow species to be com-pletely exempted from protection. Comparably, the SMS approach would allow the extinction of a species if the economic consequences of preser-vation were judged to be somehow intolerable, which might include distributional concerns. Taken together, the ESA’s exclusion and exemp-tion processes are consistent with the extraordi-nary decision making process of Randall (1991) under the SMS approach.
3.2. Related modeling considerations
The previous discussion focused on conceptual links between the ESA and the SMS approach. However, in practice the ESA requires that crite-ria be developed for determining the severity of economic impacts for foregoing preservation ac-tions. Criteria for such choices are not articulated in the ESA itself, and appear to be implemented on a case-by-case basis. The related issue is that regional modeling decisions (e.g. region of analy-sis, choice of analytical method) can affect the accounting of aggregate impacts and their distribution.
Of concern is the role of distributional conse-quences in determining the severity of economic impacts. Distributional considerations arise at both a spatial and a sectoral level, and the eco-nomic analysis must choose the appropriate re-gion and level of sectoral detail. Much of the design is left to the judgement of the analyst, and the choices are not innocuous. For example, these modeling choices are likely to be connected to the
exclusion criterion that is selected in any particu-lar case. This is seen in the two case studies discussed below; they differ in that the endan-gered fishes case addresses distributional conse-quences by assessing the geographic distribution of impacts, while the owl case focuses on sectoral distribution.
Defining the region for analysis is always prob-lematic and somewhat imprecise. An artificially small region may fail to capture all of the resource reallocation that accompanies the designation of critical habitat, while a large region may mask the impacts imposed on a subset of the population or particular sectors of the economy. The region must be sufficiently large to contain substantially all of the direct and indirect impacts associated with habitat designation, but not so large as to obscure impacts. The region must cover at least the areas that are expected to incur direct impacts from preservation actions; extension to indirect impacts is less clear-cut.
4. Case studies described
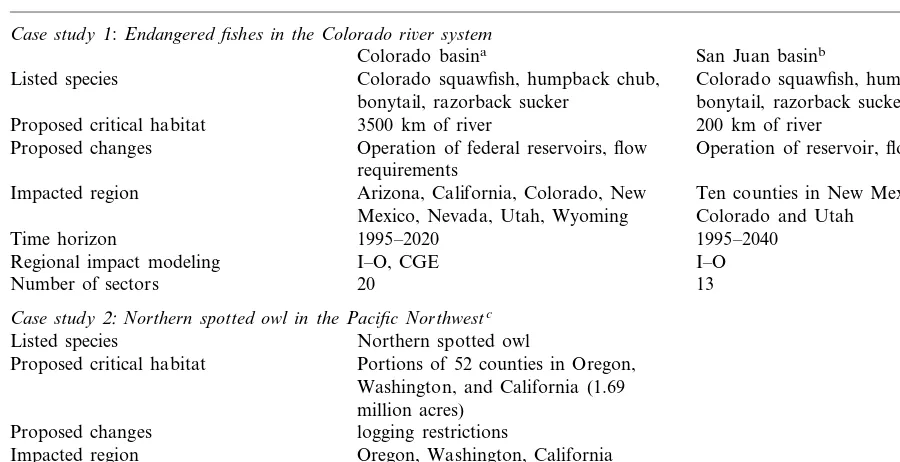
Table 1
Summary of the case studies
Case study1:Endangered fishes in the Colorado ri6er system
San Juan basinb Colorado basina
Colorado squawfish, humpback chub, Colorado squawfish, humpback chub,
Listed species
bonytail, razorback sucker bonytail, razorback sucker Proposed critical habitat 3500 km of river 200 km of river
Operation of federal reservoirs, flow Operation of reservoir, flow requirements Proposed changes
requirements
Arizona, California, Colorado, New
Impacted region Ten counties in New Mexico, Arizona,
Colorado and Utah Mexico, Nevada, Utah, Wyoming
Time horizon 1995–2020 1995–2040
Regional impact modeling I–O, CGE I–O
13 20
Number of sectors
Case study2:Northern spotted owl in the Pacific Northwestc Northern spotted owl Listed species
Portions of 52 counties in Oregon, Proposed critical habitat
Washington, and California (1.69 million acres)
Proposed changes logging restrictions
Impacted region Oregon, Washington, California 1990–2040
Time horizon
I–O modeling and multiplier analysis Regional impact modeling
1 (logging related) Number of sectors
aSources: Brookshire et al. (1993) and Maddux et al. (1993). bSource: Brookshire et al. (1997).
cSources: Thomas et al. (1990) and Schamberger et al. (1992).
al., 1990). The distributional component of each case arose from different but similar factors. In the San Juan case, the impetus was relatively high economic impacts to the sub-region, and special concern for Native American Tribal lands. The owl case involved adverse impacts primarily imposed on a declining industry (logging) in rural areas with few alternative opportunities.
4.1. Colorado and San Juan Ri6er basin studies
The original Colorado River basin study in-volved proposed designation of 3350 km of river as critical habitat (Brookshire et al., 1993). En-demic fish populations have been declining due to physical and biological changes in the river and its natural hydrograph (due to economic develop-ment). Recovery requires changes in current flow regimes and operation of this regulated river sys-tem. Predicted impacts of ESA protection affect all seven states in the basin (Arizona, California, Colorado, Nevada, New Mexico, Utah and
The economic impact analysis for the San Juan River sub-basin updated the Colorado basin study to capture the specific effects of critical habitat flow requirements on water development projects on Native American Tribal lands and surrounding counties (Brookshire et al., 1997). Affected Tribal units were the Jicarilla Apache, Navajo, Southern Ute and Ute Mountain Ute.
Although the focus of the follow-up phase was on impacts to Tribal economies, the regional model encompassed a total of ten counties located in Arizona, Colorado, New Mexico, and Utah (incorporating the Tribal lands). There were sev-eral justifications. First, species preservation ac-tions would affect developments on the Animas and La Plata Rivers in Colorado, the San Juan River in New Mexico and Utah, and the Navajo Reservoir. Since these represent a linked physical system, any direct impacts in one part of the system would have effects elsewhere. Second, the ten counties defined an economic region, linked through employment and commercial transac-tions. Third, constructing a model of the entire regional economy allowed comparison of alterna-tive water development scenarios (Brookshire et al., 1997).
The method of analysis used in the San Juan study was to construct a regional I – O model to generate scenarios that projected economic activ-ity under two conditions. The first was a baseline scenario, and the second considered preservation actions, which involved some restriction of water resources development.5 Designation of critical habitat involved changes in the flow regime of the river. A mixed modeling approach was used, where agricultural impacts were generated through a supply-side shock used to generate an exogenous level of output in agriculture sectors. Direct impacts in remaining sectors were modeled as final demand changes. Lacking data at the individual Tribal level, the impact analysis was undertaken for the entire 10-county region. Then,
identifying impacts to the Tribal economies in-volved ‘sharing’ or simply proportioning from total regional impacts (either population-based or employment-based) (see Brookshire et al., 1997).6
4.2. Northern spotted owl study
The northern spotted owl (Strix occidentalis caurina) inhabits old growth forests in the Pacific Northwest; it has commonly been regarded as an indicator species for old growth forest ecosystems, where a decline in the health of the ecosystem would be signaled by a decline in the owl popula-tion (Thomas and Verner, 1992Booth, 1994). The recognized decline in the population of the owl was attributed to increased timber harvests over the past 30 years (Schamberger et al., 1992). Rem-nant old-growth habitat is now restricted almost entirely to public lands (Booth, 1994).
The USFWS listed the owl as threatened in 1990 [see, 55 Federal Register 26114] and pro-posed critical habitat in 1991 (USDI, 1991). The actual federal listing was preceded by more than a decade of biological concern (state listings and proposed federal listings), and considerable scien-tific study including the recommended regional conservation strategy by the federal Interagency Scientific Committee (ISC) (Thomas et al., 1990). Both before and after the listing there were nu-merous legal and political actions over proposed protection (Booth, 1994Marcot and Thomas, 1997), eventually including the initiation of the multi-species Clinton Forest Plan that involves an 80% reduction in public timber supply in the Pacific Northwest (Thomas, 1993).
In the economic impact analysis for the final critical habitat designation (Schamberger et al., 1992), habitat preservation was discussed solely in terms of reductions in timber harvests on selected lands. Schamberger et al. (1992) did not construct a full regional I – O model to conduct the analysis. Rather, they utilized the IMPLAN database and
5The primary data source was the IMPLAN database (USDA, 1993), which was augmented by various sources. Actual I – O models were written in GAUSS; the code is available upon request from Mike McKee, Department of Economics, University of New Mexico, 87131.
software to derive employment and output multi-pliers for the sectors with direct effects (primarily logging). These were used to estimate the total (direct and indirect) economic impacts associated with reductions in timber harvests necessary to provide owl habitat. Specifically, the IMPLAN models were used to construct job response coeffi-cients that were applied to the planned reduction in timber harvest to obtain the projected job losses in each of the affected counties.
Of note in this study is the narrow economic focus. Attention was restricted to the logging-re-lated industries, which omitted the possibility of other uses of the forest resources, and to the rural communities affected by logging reductions. Schamberger et al. (1992) suggest that this focus was intentional given that logging in this area was in decline and there were limited economic alter-natives for displaced forestry workers. Consider-able effort was made to adjust employment multipliers to remove metropolitan area effects. Schamberger et al. (1992, p. 44), state that the adjustment was intended to: ‘remove large metropolitan economies from the analysis... based on the goal to measure impacts within the regions which contain labor and enterprises closely associ-ated with the timber industry.’
5. Results of the case studies
5.1. Colorado and San Juan studies
For the larger Colorado River basin study, predicted impacts from species preservation at the seven-state regional level were actually positi6e: for a 3% discount rate, the present value (PV) of the regional impacts for the study period are $1.294 billion (Brookshire et al., 1993). While positive, these impacts are extremely small com-pared to overall economic activity, consisting of a 0.003% increase over the baseline. Employment is expected to increase by 6250 in the last year of the study period, a 0.02% increase over the baseline. As Brookshire et al. (1993) argue, the total re-gional impacts are positive due to the reallocation of water from low valued upstream uses (primar-ily low valued irrigated cropping) to higher valued
downstream uses (higher valued cropping and some municipal and industrial uses).
Although regional impacts are positive, impacts differ considerably across states. Among the seven states, the largest positive impacts accrue to Cali-fornia, resulting in a increase in output of 0.013% over the baseline. This corresponds to an increase in gross output with a PV of $3.335 billion. Impacts to New Mexico result in a reduction of output by 0.279%, equivalent to an increase in gross output with a PV of $2.454 billion. The impacts of the other states lie between these two values.
As noted previously, excluding all or part of proposed critical habitat requires identification of criteria and some determination that economic impacts are excessive. In outlining the exclusion process followed for the four endangered fishes, the USFWS (1994, p. 13381), cited the need to: ‘provide a method by which the severity of eco-nomic impacts could be assessed’. In the original Colorado River study, Brookshire et al. (1993) argued that impacts within 1% of the baseline level of economic activity would fall below a level which the economy could absorb as part of the natural adjustment process to internal and exter-nal shocks. By this criterion, if predicted impacts are within this range, then no exclusion from the proposed critical habitat is justified. Berrens et al. (1998) interpreted this as being generally consis-tent with the SMS approach. However, it should be noted that detailed rationale for the 1% crite-rion is not explicitly given in Brookshire et al. (1993). By inference, it is based on a comparison with past economic fluctuations.7
The state-level analysis (Brookshire et al., 1993) suggested that no reach of the river be excluded (i.e. did not exceed the 1% criterion). However, it was clear that the distribution of impacts was not uniform and that New Mexico, in particular,
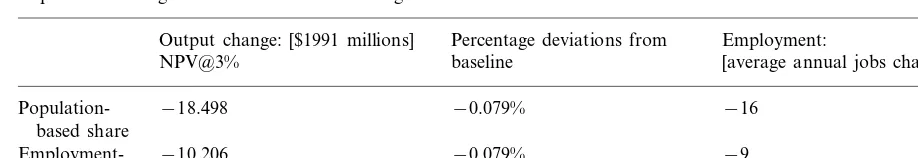
Table 2
Impacts of endangered fish critical habitat designation to combined tribal economies — San Juan basina
Percentage deviations from
Output change: [$1991 millions] Employment:
baseline [average annual jobs change] NPV@3%
−18.498
Population- −0.079% −16
based share
Employment- −10.206 −0.079% −9
based share
aSource: Brookshire et al. (1997).
would experience moderate adverse impacts. Within New Mexico, these impacts would be most strongly felt in the northwestern ‘Four Corners’ region. Hence the need for a more spa-tially-detailed analysis as reported in the San Juan follow up study.
The primary motivation for the San Juan fol-low-up study was an evaluation of the impacts to relatively poor Tribal economies, which are less able to cope with adverse exogenous shocks such as the designation of critical habitat. An important consideration was restrictions on the completion of the final component (‘Block 9’) of the large scale Navajo Indian Irrigation Project. While the unemployment rate for the region was 9.7%, Tribal unemployment rates ranged from 17.2% for the Jicarilla Apache to 27.9% for the Navajo. Thus, there was a concern that alterna-tive opportunities are especially limited for em-ployment in Tribal economies.
The predicted output and employment im-pacts to the Tribal economies are reported in Table 2. These results represent the aggregate impacts to the four Tribal entities. There is a considerable difference in the absolute level of impacts between the population- and employ-ment-based sharing methods, which bracket the possible values for the impacts to the Tribal economies (−$18.5 vs. −$10.2 million PV of output). As in the Colorado study, the criterion used in San Juan study was whether predicted impacts were within 1% of the historical fluctua-tion of the region. Again, no detailed rafluctua-tionale for this criterion was explicitly given. As in the original economic analysis, none of the pre-dicted impacts in the San Juan study were found to exceed the 1% threshold, and thus no
critical habitat was excluded (Brookshire et al., 1997).
Also, in the case of the San Juan basin, no direct compensation measures were considered or undertaken. However, between the 1993 and 1997 studies there was a significant change in the calculation of the direct impacts of setting aside critical habitat. In the original study (Brookshire et al., 1993), ‘Block 9’ of the Navajo Indian Irrigation Project was treated as infeasible to complete, given the stream flow needs of the endangered fishes. In the San Juan study (Brookshire et al., 1997), this block was projected to be permitted (and scheduled for completion in 2003) under the argument that other water conservation efforts would meet stream flow needs. While there was no explicit statement that this change was made as mitiga -tion, one interpretation is that this helped lessen (i.e. make more tolerable) the impacts on a rela-tively poor Tribal economy. This significant change also explains why estimated impacts (0.079%) on output in Table 2 are actually smaller than the estimated New Mexico impacts (0.279%) on output in the larger Colorado River study.
5.2. Northern spotted owl study
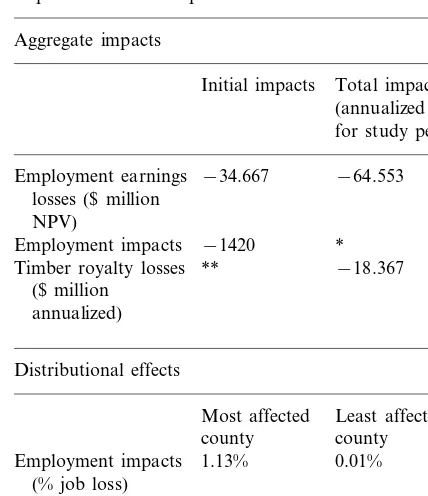
em-Table 3
Impacts of northern spotted owl critical habitat designationa
Aggregate impacts
Total impacts Initial impacts
(annualized values for study period)
Employment earnings −34.667 −64.553 losses ($ million
NPV)
Employment impacts −1420 * Timber royalty losses ** −18.367
($ million annualized)
Distributional effects
Most affected Least affected county county
Employment impacts 1.13% 0.01% (% job loss)
22.99%
Timber royalty losses 1.13% (% reduction in
revenues)
aSource: Derived from Schamberger et al. (1992). * The assumption is that employment will decline for only two years. Replacement jobs are lower wage than lost timber industry jobs.
** Only annualized values are reported for this metric.
ble’ and eligible for exclusion if the unemploy-ment rate was 2% above the average over the previous six years, or if the county rank of vulner-ability was greater than the mean vulnervulner-ability score plus two standard deviations. On these bases, some 40% of the proposed habitat in Ore-gon, 89% in Washington and 72% in California were excluded. While not explicitly stated, the rationale for the chosen exclusion criterion can be inferred to be allowing identification of counties least able to absorb employment losses from log-ging restrictions. These counties presumably would experience longer term economic impacts from critical habitat designation, and thus were given special consideration by the USFWS.
A subsequent analysis by Waters et al. (1994) also evaluated the economic impacts associated with critical habitat designation [as taken from the ISC report and used by Schamberger et al. (1992)]. Using a multi-regional I – O model, Wa-ters et al. (1994) focused on linkages between the rural and urban areas in the Pacific Northwest. Waters et al. (1994) found that the effects of critical habitat designation were smaller than re-ported by Schamberger et al. (1992). There are two relevant issues. First, given direct impacts will be proportionately smaller when applied to a larger economy. Second, larger regions are typi-cally characterized by more diverse economies that can better absorb an exogenous shock; thus, economic impacts associated with a given critical habitat will be smaller if the impacted region is larger. Waters et al. (1994) employed a general equilibrium modeling approach, which allows the reallocation of resources from setting aside critical habitat. The single industry approach of Scham-berger et al. (1992) does not. Since resources are reallocated rather than destroyed, general equi-librium approaches will generate lower estimates of impacts. However, as the Colorado study demonstrated, focusing on a large region poten-tially obscures the geographic distribution of im-pacts associated with critical habitat.
In addition to the substantial exclusions through the final critical habitat designation pro-cess, the Endangered Species Committee exemp-tion process was also invoked in the owl case (Thomas and Verner, 1992). Under Section 7 of ployment in the logging industry within the
re-spective county. At-risk counties were identified on the basis of the overall health of the local economy and its judged ability to absorb impacts. Impacts were reported at a county level so that the at-risk counties could be readily identified.
‘vulnera-the ESA, ‘vulnera-the USFWS consulted on 44 timber sales (on Bureau of Land Management [BLM] lands) in southwestern Oregon and judged that allowing timber cutting here would jeopardize the owl’s recovery. Thus, these sales were precluded. The BLM appealed asking for a review by the Endangered Species Committee to determine whether these sales were essential to the local economy, and whether the sales should proceed despite the USFWS determination of jeopardy (Thomas and Verner, 1992). Prior to the spotted owl case, the Endangered Species Committee had never granted an exemption. Extended public hearings were held in 1992. Juxtaposed with spe-cies preservation arguments, was the concern for preserving employment in the forest products sec-tor. The Committee eventually sought middle ground by approving 13 of the 44 timber sales.8
However, dispute over the northern spotted owl was the direct impetus for the multi-species, ecosystem-oriented Clinton Forest Plan, which regulated timber production on all federal lands in the Pacific Northwest (Marcot and Thomas, 1997). Passed in 1993, this legislation took effect in 1994 with a district court ruling that the plan did not violate the ESA. Of note, the Clinton Forest Plan included a compensation plan to aid those hardest hit by species preservation actions. Specifically, up to $1.2 billion in federal funds was allocated over five years for job retraining for those who lost jobs in logging-related industries.9
6. Discussion and conclusions
The ESA is likely to continue to be an evolving piece of legislation, with reauthorization pending since 1992 and subsequent implementation relying on yearly congressional appropriations (Ando, 1998). Important elements in the debate include: (1) special consideration to the rights and
incen-tives of private landowners (Polasky et al., 1997); (2) formal incorporation of a multi-species orien-tation to capture potential economies of scale in protection (Dobson et al., 1997); and (3) the role of the ESA within a larger biodiversity policy framework (Ecological Society of America, 1995). Similar to the SMS approach itself, the question of whether and how economic benefit information concerning species preservation might be included in the ESA’s economic analyses also remains an important issue (Brown and Shogren, 1998).
Against this backdrop, two of the most promi-nent ESA case studies are used to illustrate that on a general level there is a consistency between the ESA and the SMS approach. However, it must be noted that only about 40% of the more than 1000 listed species have designated critical habitat and recovery plans in place (Brown and Shogren, 1998). Thus, the majority of listed spe-cies have not been through an SMS-type process. The two case studies differed considerably them-selves in modeling approaches. Such choices are not innocuous in estimating economic impacts and their distribution. One implication observed in the case studies is that there is likely to be a need for economic modeling conducted at several different levels of analysis.
Additionally, the cases used different criteria for potential exclusion thresholds in defining criti-cal habitat; neither provided detailed justification for the choice. The implication is that there is likely to be no universal criterion or standard; this may well be justified in that the ‘economic engine’ that endangers species differs across cases. Cer-tainly, no pre-defined rule or general guidelines currently exist, and this remains an important policy issue.
However, it is shown in these two ESA cases that the consensus process for defining what con-stitutes intolerable costs is likely to include distri-butional considerations. Distributional effects constitute a valid political and moral component of the economic impacts of species preservation. Further, recognizing distributional concerns opens consideration to questions of compensation and mitigation. The dimensions of such concerns may include geographic regions, specific economic sectors, particular social groups (e.g. Native 8Marcot and Thomas (1997, p. 7) state: ‘As a quid pro quo,
however, the committee directed the BLM to cease delay and adopt the recovery plan, which was a close facsimile of the ISC strategy that BLM had previously abandoned.’
American Tribes) and individual land owners. Compensation raises its own set of theoretical and distributional considerations. For example, with the Clinton Forest Plan, those hardest hit were partially compensated by US taxpayers rather than only local or regional agents. If preservation costs are localized and benefits are highly dispersed (e.g. nonuse values), then such a pattern of com-pensation may be justified.
While currently much-discussed in terms of ‘reg-ulatory takings’ under the Fifth Amendment of the U.S. Constitution (e.g. Stroup, 1997), neither the ESA nor current jurisprudencerequires compensa-tion for adverse impacts from ESA accompensa-tions (Innes et al., 1998 p. 36). Innes et al. note that a strict mandate for full compensation under a regulatory takings argument is weak; yet, a reformed ESA should give full consideration to carefully crafted compensation packages to entice private landown-ers into habitat conservation plans (HCP’s). How-ever, compensation and mitigation actions need not be based on the slippery slope of regulatory takings arguments (see Bromley, 1997), but rather out of concern for distributive justice, and consid-eration of what might constitute intolerable costs within an SMS approach.
In closing, an SMS approach is not a uni-dimen-sional resource management objective. Rather, it must be viewed as a collective choice process. Ideally the SMS approach is invoked early to avoid waste of resources, to facilitate consensus and to identify particular tensions with other highly-valued social priorities (Farmer and Ran-dall, 1998). For example, once a species is listed, incremental exceptions to preservation plans are allowed if they do not strongly undermine preser-vation objectives. Such concessions might center on losses that resource managers, following eco-nomic analyses and public input, particularly wish to avoid (e.g. thru the ESA’s habitat exclusion process). Yet, if total exceptions accumulate to where preservation objectives are threatened and local consensus is lacking, a new, external and extraordinary appeal (e.g. the ESA’s Exemption Committee) is made to adjudicate the (in)tolerability of social costs. Such a decision process can throw out preservation entirely, re-or-der the consensus priorities, or seek some
compro-mise. This extra level of appeal helps keep an SMS consensus process honest and adaptable. As ar-gued by Farmer and Randall (1998), there are no guarantees that society will always reach consensus concerning the tolerable costs of species preserva-tion; however, when consensus is reached, an SMS approach is likely to be involved. The point em-phasized here is that consideration of distribu-tional concerns and potential compensation and mitigation measures are likely to be key elements of such consensus processes in identifying ‘tolera-ble’ costs.
Acknowledgements
Helpful review comments were provided by Emery Castle, Douglas Booth, Tom Crowards and several anonymous reviewers. The arguments ex-pressed are solely the responsibility of the authors.
References
Ando, A., 1998. Ecosystems, interest groups, and the endan-gered species act. Resources 130, 7 – 9.
Berrens, R., Brookshire, D, McKee, M., Schmidt, C., 1998. Implementing the safe minimum standard approach: two case studies from the US endangered species act. Land Econ. 74, 147 – 161.
Berrens, R., Polasky, S., 1995. The paretian liberal paradox and ecological economics. Ecol. Econ. 14, 45 – 56. Bishop, R., 1978. Endangered species and uncertainty: the
economics of a safe minimum standard. Am. J. Agric. Econ. 57, 10 – 18.
Bishop, R., 1980. Endangered species: an economic perspec-tive. Transactions of the 45th North American Wildlife Conference 45, 208 – 218.
Bishop, R., 1993. Economic efficiency, sustainability, and bio-diversity. Ambio 22, 69 – 73.
Booth, D., 1994. Valuing Nature: The Decline and Preserva-tion of Old-Growth Forests. Rowan and Littlefield, Lan-ham, MD.
Bromley, D., 1997. Constitutional political economy: property claims in a dynamic world. Contemp. Econ. Policy 15, 43 – 54.
Brookshire, D., McKee, M., Watts, G., 1993. Draft Economic Analysis of Proposed Critical Habitat Designation in the Colorado River Basin for the Razorback Sucker, Hump-back Chub, Colorado Squawfish, and Bonytail, Volume II. Prepared for US Department of the Interior, Fish and Wildlife Service, Salt Lake City, UT.
Brown, G., Shogren, J., 1998. Economics of the endangered species act. J. Econ. Perspectives 12, 3 – 20.
Castle, E., 1996. Pluralism and pragmatism in the pursuit of sustainable development. In: Adamowicz, W., Boxall, P., Luckert, M., Phillips, W., White, W. (Eds.), Forestry, Economics and the Environment. CAB International, Wallingford, UK.
Castle, E., Berrens, R., 1993. Endangered species, economic analysis, and the safe minimum standard. Northwest Envi-ron. J. 9, 108 – 130.
Ciriacy-Wantrup, S.V., 1952. Resource Conservation: Eco-nomics and Policy. University of California Press, Berke-ley, CA (3rd ed. 1968).
Crowards, T., 1998. Safe minimum standards: costs and op-portunities. Ecol. Econ. 25, 291 – 302.
Diamond, P., Hausman, J., 1994. Contingent valuation: is some number better than no number? J. Econ. Perspectives 8, 45 – 64.
Dobson, A., Rodriguez, J., Roberts, W., Wilcove, D., 1997. Geographic distribution of endangered species in the United States. Science 275, 550 – 553.
Ecological Society of America, 1995. Strengthening the Use of Science in Achieving the Goals of the Endangered Species Act. Ecological Society of America, Ad Hoc Committee on Endangered Species, Washington, DC.
Farmer, M., Randall, A., 1998. The rationality of a safe minimum standard. Land Econ. 74, 287 – 302.
Folke, C., Hammer, M., Costanza, R., Jansson, A., 1994. Investing in natural capital — why, what and how? In: Jansson, A., Hammer, M., Folke, C., Costanza, R. (Eds.), Investing in Natural Capital: The Ecological Economics Approach to Sustainability. Island Press, Washington, DC. Glick, D., 1995. Having owls and jobs too. Nat. Wildlife 33,
8 – 13.
Gowdy, J., 1997. The value of biodiversity: markets, society and ecosystems. Land Econ. 73, 25 – 41.
Hanemann, W.M., 1994. Contingent valuation and economics. J. Econ. Perspect. 8, 19 – 44.
Hohl, A., Tisdell, C., 1993. How useful are environmental safety standards in economics? — The example of safe min-imum standards for protection of species. Biodiversity Conservation 2, 168 – 181.
Innes, R., Polasky, S., Tschirhart, J., 1998. Takings, compen-sation, and endangered species protection on private lands. J. Econ. Perspect. 12, 35 – 52.
Jones, C., Pease, K., 1997. Restoration-based compensation measures in natural resource liability statutes. Contemp. Econ. Policy 15, 111 – 122.
Loomis, J., White, D., 1996. Economic benefits of rare and endangered species: summary and meta analysis. Ecol. Econ. 18, 195 – 204.
Maddux, H., Noonan, W., Fitzpatrick, L., Brookshire, D., McKee, M, Watts, G., 1993. Overview of the Proposed Critical Habitat Designation for the Four Colorado River Endangered Species. Prepared for US Department of the Interior, Fish and Wildlife Service, Salt Lake City, UT. Marcot, B, Thomas, J. W., 1997. Of Spotted Owl, Old Growth
and New Policies: A History Since the Interagency Scien-tific Report. US Department of Agriculture, Forest Ser-vice, Gen. Tech. Rep. PNW-GTR-408, Portland, OR. Metrick, A., Weitzman, M., 1998. Conflicts and choices in
biodiversity preservation. J. Econ. Perspect. 12, 21 – 34. Norton, B., 1987. Why Preserve Natural Variety? Princeton
University Press, Princetion, NJ.
Norton, B., 1995. Resilience and options. Ecological Econom-ics 15, 133 – 136.
Palmini, D., 1999. Uncertainty, risk aversion and the game theoretic foundations of the safe minimum standard: a reassessment. Ecological Economics (Forthcoming). Polasky, S., Doremus, H., Rettig, B., 1997. Endangered
spe-cies conservation on private land. Contemp. Econ. Policy 15, 66 – 76.
Randall, A., 1991. The value of biodiversity. Ambio 21, 63 – 68.
Randall, A., Farmer, M., 1995. Benefits, costs, and the safe minimum standard of conservation. In: Bromley, D. (Ed.), The Handbook of Environmental Economics. Basil Black-well, New York.
Rohlf, D., 1989. The Endangered Species Act: A Guide to Its Protections and Implementation. Stanford Environmental Law Society, Stanford, CA.
Rolfe, J., 1995. Ulysses revisited — a closer look at the safe minimum standard rule. Aust. J. Agric. Econ. 39, 55 – 70. Schamberger, M., Charbonneau, J., Hay, M., Johnson, R., 1992. Economic Analysis of Critical Habitat Designation Effects for the Northern Spotted Owl. US Fish and Wildlife Service, Washington, D.C.
Stroup, R., 1997. The economics of compensating property owners. Contemp. Econ. Policy 15, 55 – 65.
Thomas, J.W. (Team Leader), 1993. Forest Ecosystem Man-agement: An Ecological, Economic and Social Assessment. US Gov. Printing Office, Washington, DC.
Thomas, J.W., Forsman, E., Lint, J., Meslow, E., Noon, B., Verner, J., 1990. A conservation strategy for the northern spotted owl. Interagency Scientific Committee to Address the Conservation of the Northern Spotted Owl, Portland OR.
Thomas, J.W., Verner, J., 1992. Accommodation with socio-economic factors under the endangered species act-more than meets the eye. Transactions of the 57th North Amer-ican Wildlife and Natural Resources Conference 57, 627 – 641.
US Department of Agriculture, 1993. IMPLAN. IMPLAN Development and Applications Group. University of Min-nesota, St. Paul, MN.
US Department of Interior (USDI), 1991. Exclusion Process: Critical Habitat and the Northern Spotted Owl, US Fish and Wildlife Service, Washington, DC.
US Fish and Wildlife Service (USFWS), 1994. Endangered and Threathened wildlife and plants: determination of critical habitat for four Colorado river endangered fished; Final rule. Federal Register 59: 13374 – 13400.
Vatn, A., Bromley, D., 1995. Choices without prices without apology. In: Bromley, D. (Ed.), Handbook of Environmen-tal Economics. Basil Blackwell, New York.
Water, E., Holland, D., Weber, B., 1994. Interregional effects of reduced timber harvests: the impacts of spotted owl listing in rural and urban Oregon. J. Agric. Res. Econ. 19, 141 – 160.
Woodward, R., Bishop, R., 1997. How to decide when experts disagree: uncertainty-based choice rules in environmental policy. Land Econ. 73, 492 – 507.