MOBILE MAPPING BY FMCW SYNTHETIC APERTURE RADAR
OPERATING AT 300 GHZ
S. Palma,b∗, R. Sommera, A. Hommesa, N. Pohla, U. Stillab
a
Fraunhofer FHR, Institute for High Frequency Physics and Radar Techniques, 53343 Wachtberg, Germany - [email protected] b
Photogrammetry and Remote Sensing, Technische Universitaet Muenchen, Muenchen, Germany - [email protected]
Commission I, WG I/2
KEY WORDS:Mobile Radar Mapping, Car-borne SAR, Street Mapping, Ultra-High Resolution SAR, Subcentimeter Resolution
ABSTRACT:
While optical cameras or laser systems are widely used for mobile mapping low attention was payed for radar systems. Due to new semiconductor technologies, compact and leight weight SAR systems based on the Frequency Modulated Continuous Wave (FMCW) principle in the millimeter wave domain can serve for mobile radar mapping on cars. For mapping of long stripes along roads in close range a special strategy for focusing of SAR images was developed. Hereby local adapted planes for processing are used considering the IMU data of the sensor. An experimental system was designed for high resolution radar mapping of urban scenes in close range geometry. This small and leight weighted system has a bandwidth of 30 GHz (5 mm resolution) and operates with 300 GHz in the lower terahertz domain. Experiments with a van in an urban scenario were carried out for proof of applicability of an operating SAR system resolving objects in the subcentimeter domain. The results show that narrow cracks in the asphalt of the road are visible and the measuring of small metallic objects placed in the scene is possible. Based on this mobile mapping techniques a first result from an acquisition of vertical facade structure is shown.
1. INTRODUCTION
Synthetic aperture radar imaging from satellites or airborne plat-forms is a well established technology for mapping the earth sur-face. Active illuminating, penetrating clouds and smoke and high resolution indepenent of distance are the advantage of such SAR sensors. While high resolution mobile mapping systems are cur-rently dominated by camera or laser based scanning systems (El-lum and El-Sheimy, 2002, Paparoditis et al., 2012), low attrac-tion was payed for radar systems with high imaging resoluattrac-tion capabilities. Conventional airborne SAR systems operating usu-ally in X- or Ka-band are not practical for the usage of car-borne platforms due to their aperture size - far field condition for close distances - and their limited resolution capacity. There were only few experiments like (Frey et al., 2013) to test for specific con-ditions of car-borne SAR systems. However, to our knowledge none of them were mapping surface structures at close distance of only several meters in subcentimeter resolution.
In recent years compact and light weight FMCW radar systems in the millimetre and also lower terahertz domain become appli-cable for mobile mapping scenarios. Operational airborne SAR systems in these frequency domain are currently on the scale of some kilograms or even below (Otten et al., 2014), (Kinghorn and Nejman, 2009). The use of even higher frequencies allow for very small aperture sizes and measurements in near field. Reach-ing the lower terahertz domain with modern, coherent radar sen-sors, bandwidths are now available which can resolve down to a few millimeters. The compactness and the resolution of these new sensor generations offer a variety of new potential applica-tions where the use of an imaging radar so far was hardly possi-ble. The deployment of new carrier platforms like cars or small remotely piloted aircraft systems is now possible.
In this paper we want to focus on car-borne high resolution mo-bile mapping applications and therefore conducted first
experi-∗Corresponding author.
ments with a current state experimental radar system which was developed at Fraunhofer FHR. The special street mapping geom-etry and the close range of the sensor raises new challenges on the focusing geometry. We use locally adapted planes for fo-cusing considering the IMU data of the sensor. Further, these experiments should give first results on processing such high fre-quencies and bandwidths and to what extend fine-scaled signa-tures and object texsigna-tures in mobile mapping scenarios can be re-solved by radar. The sensor operates in the lower terahertz do-main with an operating frequency of 300 GHz and a bandwidth of 30 GHz. With these parameters a theoretical resolution of 5 mm can be processed. With the SAR sensor mounted on a platform in a moving van, data were collected by driving on conventional roads illuminating the opposite roadway or parking lanes. The SAR system’s ability of resolving different metallic objects in size and characteristics down to a radar cross section of -43 dBsm placed in the scenario was validated. The results are promising that for monitoring runways or roadways, very small metallic ob-jects which may cause a threat are detectable. A few millimeters deep cracks in the asphalt of the road are displayed in the SAR image. In addition, these experiments can serve as groundwork for a future use of such a SAR sensor even on a multicopter.
2. STREET MAPPING GEOMETRY
illumi-nated surface for as many scenarios. On the other side it should allow an efficient processing of the raw data.
In airborne scenarios the airplane is usually flying some kilome-ters away from the illuminated scene and without any DSM or DEM there is no information of the scene’s topographie. The use of a flat plane model is therefore a straight forward assumption and fits well to airborne scenarios if the region of interest is no challenging terrain. A terrain height change of several meters in the scene is unproblematic compared to the long distance to the sensor.
In theory, this flat plane model works also well for street mapping at close range with the constraint that the streets are almost with-out gradient. In practical, however, this assumption is unrealistic as streets often show gentle slope or rise. One meter height differ-ence on several hundred meter distance would already be prob-lematic as the sensor is only mounted at close height above the street. The focusing plane might then already be above the sensor configuration. For mapping several hundred meters or even kilo-meters of streets in close range, this flat plane assumption has to be adapted.
An advantage in the described street mapping geometry, however, is the fact that the sensor is just several meters away from the oberserved area and the car has direct contact to the road surface. Thus, the received GPS/INS data while moving the car measure the terrain information very accurately and densely. With the as-sumption that the illuminated side of the roadway is at the same height level as the side of the road the car is driving, we extract the GPS/INS data to estimate an instant DEM model. In this config-uration the IMU data is not only used for SAR focusing, but also used to calculate the geometry of the instantaneously oberserved scene.
In the following for each synthetic apertured~swe assume a flat
plane model as defined in Fig.1 with a normal vector~n=
in the cartesian coordinate system.
For small distances the traveled path~sof the sensor can be ap-proximated to be linear giving the parametrization of
~
s=~r0+λ~a, λ∈R (1)
with~a being the approximated linaer directional vector of the sensor’s movement and~r0the start position. The vector~acan
be calculated by the sensor’s velocity, position and angular in-formation from the IMU data of the system. It is described by
~a= (deast, dnorth,0)′, withdeastanddnorthbeing the distance travelled in the geographical directions. Determination of the ac-tual sensor position~rs(nT)solely from GPS information would be far too inaccurate for the focusing process. Assuming a linear motion of the sensor in between each synthetic aperture with the duration ofT, the calculation of~rs(nT)can be approximated by an integration or discrete sum of the sensor velocity components to
with the corresponding sensor velocities~veast(mT),~vnorth(mT) and~vdown(mT)and the sweep durationT. As the GPS/INS data rate is much lower than the sweep repetition frequency, a cubic interpolation of the navigational data is used to estimate the dif-ferent velocities and angular information chirp by chirp.
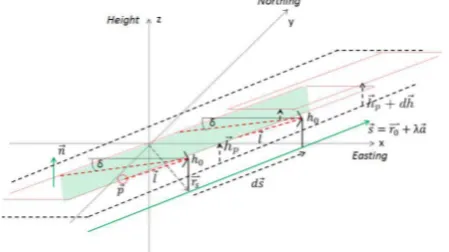
Figure 1: Street mapping geometry for each synthetic aperture
d~s. The radar sensor is mountedh0= 2m above the street level
with an depression angleδof 30 degrees. In steps of the length of one synthetic aperture the height of the focusing plane is adjusted by the height distanced~hcalculated from the INS data.
The radar is further mounted on the car’s window in a certain heighth0≈2mabove the ground. The radar beam is constantly
illuminating the ground with an adjustable depression angleδ be-tween10◦and40◦. The beamwidth of the sensor hereby has an opening angle of up to20◦in azimuth and range. As the sensor is moving, for each aperture length|d~s|the level of the actual focus-ing plain~hpis constantly adjusted in height, so that it is always at the same distanceh0from the sensor. This guarantees the same
level of focusing depth and geometry in the case the trajectory is slightly up- or downward rising. With~lbeing the actual line of sight of the radar sensor, the intersection with the focusing plane
~
pand thus the currently illuminated scene can be calculated with
~
As small height increases or decreases during a synthetic aper-ture are compensated in the processing, strong height increases should be avoided as the flat earth model is neglected. Alternat-ing movements of the sensor in the northAlternat-ing or eastAlternat-ing directions are unproblematic, as the projection only takes place in thezor height domain.
The azimuth resolution depends on the wavelength of the system and the ability to illuminate and coherently process a given target on the ground in a preferably high angular interval. For suffi-ciently small angles in the ideal side looking stripmap geometry, the azimuth angular intergration intervalφcan be approximated as
φ≈BWAzimuth
fc ,
(4)
withBWAzimuth as the desired bandwidth in azimuth domain andfcthe carrier frequency. The sensor’s radar waveform has a given bandwidthBWof up to 44 GHz and a center frequencyfc of 300 GHz. With a typical perpendicular distance to the target
rmidof 10 m, this leads to a synthetic aperture length of
|d~s| ≈rmid·tan
φ
2 ≈0.5m. (5)
should be adequate for street mapping.
During the pathd~s, the radar signal energy has to be coherently integrated to achieve high crossrange resolution. This demands for stable trajectories of10λ during the pathway. Compared to
air-borne SAR experiments with X- or Ka-band radar sensors, these aperture length|d~s|are comparatively very small. With the con-straint that at this frequency of 300 GHz a stability of0.1mm is expected, these requirements are apparently at the limit of mod-ern IMU systems. As this high accurancy typically can not be attained during the movement of the sensor in a car, deviations to the ideal trajectory have to be compensated in the signal pro-cessing step. This avoids blurring and misplacement effects in the final imaging process.
For the actual focusing of the radar data, a fast time domain ap-proach orientated on the work of (Ribalta, 2011) has been devel-oped. The details of the processing will, however, not discussed in this paper.
3. SENSOR DESIGN
The current radar system used for the car-borne experiments is called Millimeterwave Radar using Analog and New Digital Ap-proach (MIRANDA-300). The development of this experimen-tal system is based on the MIRANDA-94 FMCW radar system, which was designed as a compact and light weigth airborne re-mote sensing SAR at Fraunhofer FHR (Stanko et al., 2011). The sensor can be remotely operated by a person outside the car via a digital data link, but in the described experiments it was operated by the co-driver.
3.1 Radar Front-End
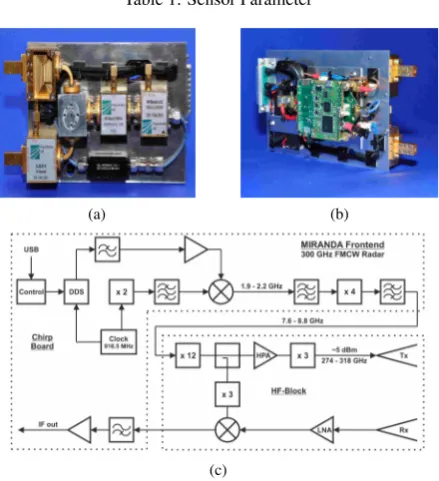
The front and back of the radar sensor together with a block di-agram of the HF components is shown in Fig. 2. The physical dimensions of the front-end are20x10x10cm with a weight of∼1.5 kg. The used chirp is generated with a signal generator which guarantees a very linear frequency chirp. The signal gener-ator basically depends on a stabilized clock genergener-ator working at 916 MHz driving a direct digital synthesizer (DDS). Subsequent to the chirp generator two frequency multipliers are applied. The first one is a by 12 multiplier, increasing the chirp frequency at 8 GHz to 96 GHz. Secondly, a by three frequency multiplier is used to achieve the 300 GHz transmit frequency. The resulting bandwidth reaches then 44 GHz, giving the system a range reso-lution of 3.4 mm. This respresents a multiplication factor of 288. The system needs a normal power supply of 5 V with a power consumption of approximately 3 W. The final output power is about 5 dBm (Weber et al., 2011, Tessmann et al., 2014). This very low transmission power limits the system applicability to short and mid ranges. A further key component of the system is the fundamental 300 GHz heterodyne receiver module from Fraunhofer IAF (Tessmann et al., 2011). The down-conversion receiver achieves a conversion gain of more than 11 dB in the fre-quency range from 270 GHz to 310 GHz with LO-power of only -12 dBm, which is very important for radar applications with low transmit power. In the receiver module the incoming RF-signal is amplified by a four-stage low-noise amplifier (LNA) and subse-quently down converted by a single ended resistive HEMT mixer circuit. The excellent flat frequency response of the radar was demonstrated by corner reflector measurements in (Pohl et al., 2015).
3.2 Radar Back-End
Real-time SAR capability requires instant access to sampled radar data and continuous information of sensor movements. These
Frequency 300GHz
Bandwidth 44GHz
Sensor Dimensions 20x10x10cm Antenna Dimensions 4.5x3.5mm Weight Front-end 1.5kg Weight SAR System 5kg Power Consumption 5V /3W
Output Power 5dBm
Noise equivalentσ −40dB
Table 1: Sensor Parameter
(a) (b)
(c)
Figure 2: MIRANDA-300 radar system: (a) Photograph of the high frequency view. (b) Photograph of the chirp generation view. (c) Block diagram of the front-end design. Dimensions are 20x10x10 cm with a weight of 1.5 kg.
data are measured with an inertial measuring unit with real-time capacity. Due to the FMCW principle, the back-end must sample and record a continously coming data stream of down converted radar echoes and store it disruptively on disk. Data from GPS and from the inertial measuring unit (IMU) are continously re-ceived at a different, much lower data rate on a different channel. To achieve a first and fast synchronization of both data sets, both data are processed into one data stream and then transmitted as records.
The incoming GPS/INS packages can further be encoded onto an FM encoded signal on a 5 MHz carrier, which is then down sam-pled by the second IF input channel of the radar data acquisition unit. This allows the complete signal chain of radar and GPS/INS data to be transmitted via an analog or digital transmission unit. A real-time SAR processing chain can then be started and per-formed several kilometers away from the SAR sensor. This capa-bility has proven itself especially in the use of airborne systems with payload restrictions (Palm et al., 2014).
3.3 SAR System
real time SAR processing chain of the continuous data. Together with the radar front-end the whole SAR system configuration has a weight of less than 5 kg and can easily be installed inside any car.
(a)
(b)
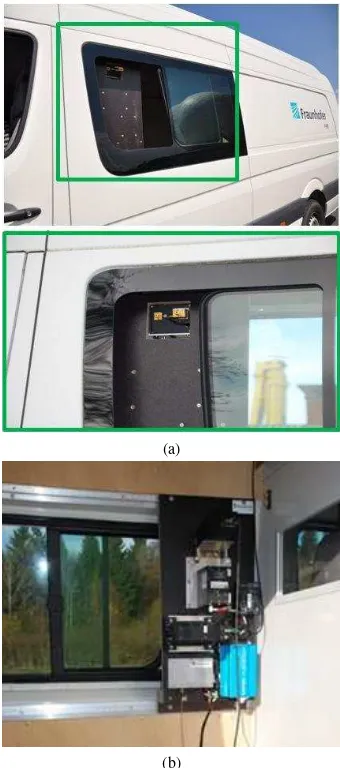
Figure 3: MIRANDA-300 SAR system: Operation and installa-tion of SAR sensor in van. The radar is mounted on a platform inside the van behind the window. While operating the system the window is opened. The radar is pointing to the left side with a variable depression angle of usually 30 degrees.(a) Exterior of van: Only antennas are visible behind open window. (b) Interior of van: Integration of sensor front- and back-end.
4. EXPERIMENTS
The complete Miranda-300 SAR system was mounted on a plat-form inside a van as shown in Fig.3. It consists of the radar front-end, an RF amplifier, a data recording unit, an IMU and a GPS antenna placed on the top of the van. The transmitting and re-ceiving antennas of the front-end are installed behind the open window of the van in a height of about 2 m above the street with a variable depression angle of usually 20 to 30 degrees. With this configuration the radar can illuminate a range of 15 m beneath the moving platform in a side looking geometry. Due to the high bandwidth which has to be handled and the limited data record-ing, only a stripmap depth of 5 m in range direction can currently be handled. Further, the limited sweep repetition frequency actu-ally allows the van not to drive faster than 20 km/h. Otherwise
the doppler spectrum of the received echoes is ambiguous. Both constrictions will be reduced significantly by a next generation data recording system which is in the development.
Sensor Height above Ground 2m Maximum Measuring Distance 20m
Measuring Depth 5m
Velocity of Van 20km/h
Sweep Repitition Frequency 5.2kHz
Sweep DurationT 180µs
Processed Bandwidth 30GHz Processed Resolution 5mm
Pixel Spacing 2mm
Table 2: Parameter for SAR processing and mapping geometry
An operator beside the driver or even outside the van can then remotely control the radar system by a laptop and WiFi connec-tion. The range compressed radar data of the current illuminated scene can be watched on the display of the laptop in real time. Together with the navigational data the operator can thus easily intervene in the system if parameters are wrong. We performed several operational tests of the system by driving on conventional roads illuminating the opposite roadway or parking lane. These drives had a length of several hundred meters up to some kilome-ters. To demonstrate the resolution of very fine-scaled signatures we put several small objects with different characteristics on a parking area. These were different metallic bearing balls ranging from a size of 8 mm to 22 mm diameter and various tools and screws. These objects were laid in the center of the scene in a typical distance of 10 m beneath the van.
5. RESULTS
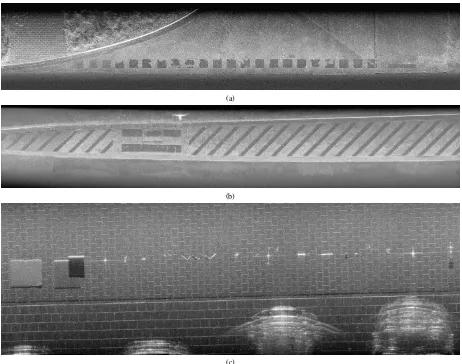
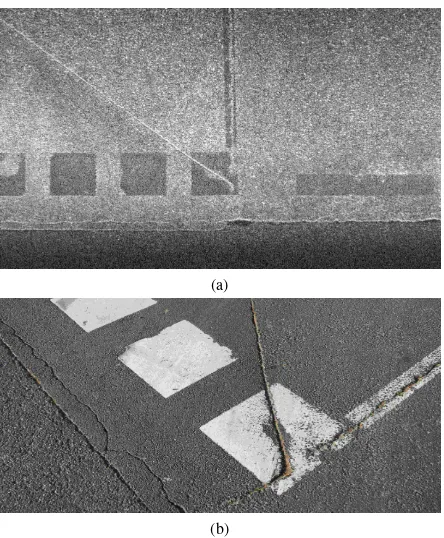
Street distances of up to a few kilometers were mapped in the close range geometry. The height adaption of the focusing plane for each synthetic aperture with a typical length of0.5m was far sufficient for reaching a constant focusing depth of the illumi-nated streets. The final postprocessed SAR images reach a reso-lution of5mm in both dimensions. A bandwidth of 30 GHz (285-315 GHz) is taken for the range compression of the data. Fig. 4 shows the imaging results for three different streets and parking lanes which were passed by at a distance of10m from the van. The images are sections of longer stripes and show the begin of a street crossing (Fig. 4a), a side verge of a bus lane with striped markings (Fig. 4b) and a parking lane where several experimental objects of different size and characteristics were placed on (Fig. 4c). The strong echo from the curbside as well as the the pat-tern and the edges of each paving stone is recognissable. The pattern of clean and newly laid paving stones from Fig. 4c ap-pear particularly clear in the SAR images. In contrast, older and covered with sand areas on the left side of Fig. 4a are already less recognizable. The echo of the stone edges is then already lower. Weed in between the paving stone and bounding grasses and plants above the curbside show different characteristics and already foreshortening effects.
(a)
(b)
(c)
Figure 4: Street Mapping SAR imaging results: The images are sections of considerably longer strips. The streets and parking lanes were passed by at a distance of 5-10 m with a velocity of 20 km/h. The resolution of the SAR images is 5 mm, the stripmap depth about 5 m. (a) Sidewalk (left) and street inter-section (right) with road markings (stop marker of priority road) and small cracks in the asphalt. (b) Bus parking lane with striped ground marking. (c) Experimental setup of different metallic ob-jects placed on a parking lane to test for the resolution and pen-etration capacity of the sensor. On the bottom of the image the front side of parking cars is visible.
orientation of the gully covers can be relatively easily carried out by the viewer. Fraying or missing elements of the white road markings are clearly visible.2cm cracks in the asphalt and holes are identifiable but even finer cracks down to some millimeters are still visuable. A limitation of course is the orientation of the cracks. Best detection is obtained if they are parallel to the sen-sors trajectory. This guarantees a strong echo from the border of the crack. Asphalt itself, however, has a relatively strong echo resulting in the assumption, that the surface is already rough com-pared to the used wavelength of1mm.
Fig. 4c shows an experimental assembly of different metallic ob-jects placed in the scenario to test for the resolution and pene-tration capacity of the sensor. On the bottom of the image the front side of parking cars is visible. As one example we want to discuss the objects in the center of Fig. 4c. These are different screws and threaded rods laid into the scene. A zoom of this area is shown in Fig. 7. Again, the pattern of the paving stone and the metallic objects are well recognizable. The possibility of the high
zoom mode also allows for measuring objects in the SAR image very accurately which is performed in Fig. 7d. With a defined pixel spacing of2mm the length of the threaded rod can be es-timated from the image to√12.482+ 6.242cm≈13.95cm by
simply counting the pixels, see Fig. 7d. This is very close to the true value of14cm as shown in Fig. 7c. The same is true for the second, slightly smaller object in the scene, which is estimated from the SAR image to be≈11cm. The validation of very fine scale signatures with metallic bearing balls of 16 mm diameter and a radar cross section of -43 dBm has been demonstrated in (Palm et al., 2016). None of the displayed SAR images use auto-focus or image enhancements algorithms, which could probably further increase the image quality for subsequent image process-ing and classification steps.
6. CONCLUSION
(a)
(b)
Figure 5: Zoom (4m x4m) of gully covers and street intersec-tion: (a) SAR image zoom of the center of Fig. 4a. Orientation and texture of the gully covers is clearly observable in the zoom. Also fraying or missing elements of the white road markings and cracks in the asphalt are detectable. (b) Photograph of the scene.
(a)
(b)
Figure 6: Zoom (4m x4m) of street intersection. (a) SAR image zoom of the center of Fig. 4a. Cracks in the asphalt of2cm down to several millimeters are recognisable. Best detection of cracks, however, if these are parallel to the movement of the sensor. (b) Photograph of the scene.
(a) (b)
(c) (d)
Figure 7: SAR measurements of metallic objects (screws and threaded rod) on car parking with 5 mm resolution. Zoom from the center of Fig. 4c. (a) Photograph of the scene. (b) SAR image of these objects on paving stones. (c) Validation of the object’s length. (d) Zoom (∼ 30cm x30cm) of Fig. 7b. Using the defined pixel spacing of2mm the length of the object can be determined to13.95cm.
gully covers or narrow cracks in roads are visible and measur-able in the SAR images. The use of the continuously received GPS/INS data to directly estimate the height of the illuminated street level works as a straight forward strategy and may be also implemented for a real-time SAR solution.
7. OUTLOOK
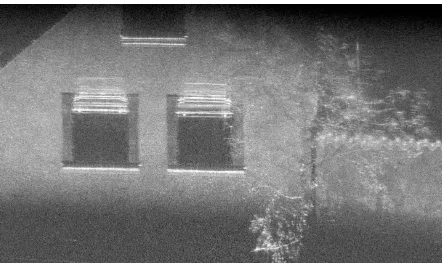
By a modification of the described geometry in chapter 2 the il-lumination and SAR processing of vertical structures like house facades or trees in urban areas is a next possible application in the future. First experiments in this directions have already been
Figure 8: SAR image result of house facade. The sensor is look-ing upwards with an incidence angle of∼30 degrees. The first and second floor of a house front with plastered walls is visible. A tree tied to the rain pipe is beneath the right window. Multipath effects and strong echoes from the window benches and roller shutters show strong characteristics. The resolution is 5 mm with a pixel spacing of 2 mm. The perpendicular distance of the house to the moving radar sensor was about 7 m.
made, where the sensor was turned upwards to illuminate facades from the first level up to the roof. Again, we used the described van and configuration of Fig. 3 and drove down a road in an urban scenario. Fig. 8 shows first results of these experiments. Presented is the first and second floor of a facade with plastered walls. Right of the building is a plastered gateway with a height up to the first level and a completion of the wall consisting of tiles. Placed directly in front of the building and tied to the rain pipe a tree is observable. Due to foreshortening effects the leaves of the tree which are aligned towards the street are closer to the radar sensor and thus appear in short range of the SAR image (bottom). Obviously, the leaves are slightly moving in the wind and therefore show some smearing. The strong echoes from the window region are caused by multipath effects. Due to the fact that the radar sensor is looking upwards, strong echoes are re-ceived from window benches and roller shutters as they appear as square edges. Especially the window bench in the second floor shows two strong echos. The first is obviously the edge of the bench aligned towards the sensor, the second echo can be associ-ated to the double bounce of the square edge. The area directly above the benches is located in the radar shadow while the win-dows appear dark.
REFERENCES
Ellum, C. and El-Sheimy, N., 2002. Land-based mobile mapping systems. Photogrammetric engineering and remote sensing 68(1), pp. 13–17.
Frey, O., Werner, C., Wegmuller, U., Wiesmann, A., Henke, D. and Magnard, C., 2013. A car-borne SAR and InSAR ex-periment. In: Geoscience and Remote Sensing Symposium (IGARSS), 2013 IEEE International, pp. 93–96.
Kinghorn, A. and Nejman, A., 2009. PicoSAR- an advanced lightweight SAR system. In: Radar Conference, 2009. EuRAD 2009. European, pp. 168–171.
Otten, M., Rossum, W. v., Graaf, M. v. d., Vlothuizen, W. and Tan, R., 2014. Multichannel imaging with the AMBER FMCW SAR. In: EUSAR 2014; 10th European Conference on Synthetic Aperture Radar; Proceedings of, pp. 1–4.
Palm, S., Sommer, R., Caris, M., Pohl, N., Tessmann, A. and Stilla, U., 2016. Ultra-High Resolution SAR in Lower Terahertz Domain for Applications in Mobile Mapping. In: The 10th Ger-man Microwave Conference (GeMiC), Bochum.
Palm, S., Wahlen, A., Stanko, S., Pohl, N., Wellig, P. and Stilla, U., 2014. Real-time Onboard Processing and Ground Based Monitoring of FMCW-SAR Videos. In: EUSAR 2014; 10th Eu-ropean Conference on Synthetic Aperture Radar; Proceedings of, pp. 1–4.
Paparoditis, N., Papelard, J.-P., Cannelle, B., Devaux, A., So-heilian, B., David, N. and Houzay, E., 2012. Stereopolis II: A multi-purpose and multi-sensor 3D mobile mapping system for street visualisation and 3D metrology. Revue franc¸aise de pho-togramm´etrie et de t´el´ed´etection (200), pp. 69–79.
Pohl, N., Stanko, S., Caris, M., Tessmann, A. and Schlechtweg, M., 2015. An ultra-high resolution radar-system operating at 300 GHz. In: Wireless Sensors and Sensor Networks (WiSNet), 2015 IEEE Topical Conference on, pp. 62–64.
Ribalta, A., 2011. Time-Domain Reconstruction Algorithms for FMCW-SAR. Geoscience and Remote Sensing Letters, IEEE 8(3), pp. 396–400.
Stanko, S., Johannes, W., Sommer, R., Wahlen, A., Wilcke, J., Essen, H., Tessmann, A. and Kallfass, I., 2011. SAR with MIRANDA - Millimeterwave Radar using Analog and new dig-ital Approach. In: Radar Conference (EuRAD), 2011 European, pp. 214–217.
Tessmann, A., Leuther, A., Hurm, V., Massler, H., Wagner, S., Kuri, M., Zink, M., Riessle, M., Stulz, H.-P., Schlechtweg, M. and Ambacher, O., 2014. A Broadband 220-320 GHz Medium Power Amplifier Module. In: Compound Semiconductor Inte-grated Circuit Symposium (CSICs), 2014 IEEE, pp. 1–4.
Tessmann, A., Massler, H., Lewark, U., Wagner, S., Kallfass, I. and Leuther, A., 2011. Fully Integrated 300 GHz Receiver S-MMICs in 50 nm Metamorphic HEMT Technology. In: Com-pound Semiconductor Integrated Circuit Symposium (CSICS), 2011 IEEE, pp. 1–4.