NON-DESTRUCTIVE MONITORING OF RICE BY HYPERSPECTRAL IN-FIELD
SPECTROMETRY AND UAV-BASED REMOTE SENSING: CASE STUDY OF
FIELD-GROWN RICE IN NORTH RHINE-WESTPHALIA, GERMANY
M. Willkomm a *, A. Bolten a, G. Bareth a
a Institute of Geography, University of Cologne, Germany - (m.willkomm, andreas.bolten, g.bareth)@uni-koeln.de
Commission I, ICWG I/Vb
KEY WORDS: UAV, agriculture, rice, DEM, CSM, plant height, vegetation index, hyperspectral data
ABSTRACT:
In the context of an increasing world population, the demand for agricultural crops is continuously rising. Especially rice plays a key role in food security, not only in Asia. To increase crop production of rice, either productivity of plants has to be improved or new cultivation areas have to be found. In this context, our study investigated crop growth of paddy rice (Oryza Sativa J.) in Germany. An experimental field in the vegetation period of 2014 with two nitrogen treatments was conducted using remote sensing methods. The research project focussed on two main aspects: (1) the potential of UAV-based and hyperspectral remote sensing methods to monitor selected growth parameters at different phenological stages; (2) the potential of paddy rice cultivation under the present climate condition in western Germany. We applied a low-cost UAV-system (Unmanned Aerial Vehicle) to generate high resolution Crop Surface Models (CSM). These were compared with hyperspectral in-field measurements and directly measured agronomic parameters (fresh and dry aboveground biomass (AGB), leaf-area-index (LAI) and plant nitrogen concentration (PNC)). For all acquisition dates we could determine single in-field structures in the CSM (e.g. distribution of hills) and different growth characteristics between the nitrogen treatments. Especially in the second half of the growing season, the plants with higher nitrogen availability were about 25 – 30 % larger. The plant height in the CSM correlates particularly with fresh AGB and the LAI (R2 > 0.8). Thus, the conducted methods for plant growth monitoring can be a contribution for precision agriculture approaches.
* Corresponding author
1. INTRODUCTION
The increasing world population leads to a rising demand for agricultural products. This demand was expected to double globally until the year 2015 in comparison to 2000 (FAOSTAT, 2013). To ensure the global food supply, the investigation of agronomic parameters of crops using precision agriculture is a necessary task (Mulla, 2013). Rice especially is one of the most important cereal grains in the world. In Asia, South America and Africa the consumption of rice delivers about 35 – 60 % of the daily amount of calories taken by the population (Fageria et al., 2003). In addition, the total amount of rice production is second worldwide behind wheat.
To increase crop production of rice, either productivity of plants has to be improved or new cultivation areas have to be found. Against this background, precision agriculture is valuable to increase grain yield. Remote sensing methods can contribute to this task delivering important data to monitor crop growth during different phenological stages (Hansen & Schjoerring, 2003). The application of multi-temporal Crop Surface models (CSM) is seen as a part of such monitoring systems (Bendig et al., 2013a; Geipel et al., 2014). In the recent past, Unmanned Aerial Vehicles (UAV) carrying light weight sensors became popular systems for the collection of 3D data (Van der Wal et al., 2013). These systems can close the gap between hand-held and large scale remote sensing approaches (Berni et al., 2009; Watts et al., 2012). The detection of plant heights in spatially high resolution dimensions is an important contribution for
growth monitoring and yield estimations. In addition, it can help to find optimal fertilizer treatments to maximize economic outputs and reduce environmental pollution (Stroppiana et al., 2012).
In the context of monitoring paddy rice fields, an experimental field in western Germany (North Rhine-Westphalia) in the vegetation period of 2014 was conducted. The aim of this research project is to focus on two main aspects: (1) the potential of remote sensing methods to monitor selected agronomic parameters at different phenological stages; (2) the potential of paddy rice cultivation under the present climate condition in western Germany. A crop monitoring of the experimental rice field using CSM from very high resolution stereo images captured by a low-cost UAV-system is conducted. In addition, destructive sampling of fresh and dry aboveground biomass (AGB), leaf area index (LAI), plant nitrogen concentration (PNC), non-destructive sampling of plant height and vegetation indices (VI) from hyperspectral hand-held data were measured to investigate its correlation to plant height.
2. DATA AND METHODS
2.1 Study area and experimental design
The experimental field is located in Langerwehe in the west of Germany (fig. 1). The rice cultivar Kongyu131 (Oryza Sativa J.) was transplanted in late April 2014. 5 - 8 single plants were planted together forming one hill. The field structure consists of two nitrogen treatments (30 kg N/ha and 80 kg N/ha) and three plot replications with a size of 1.25 x 2 m each. To avoid water percolation, a plastic sheet was installed 40 cm under the soil. The experiment consists of a drainage system. Irrigation was only conducted with rain water. The total field size is about 25 m2.
Figure 1: Location and structure of the experiment field
2.2 Data acquisition
Data acquisition of the experimental field can be divided into CSM calculations based on UAV stereo images and destructive and non-destructive in-field measurements. Both sampling methods are presented in the following sections.
2.2.1 UAV data collection: The used UAV-platform (fig. 2)
is a DJI Phantom 2 (SZ DJI Technology Co., Shenzhen, China). The system including four electrical engines and rotors, an Inertial Measurement Unit (IMU), a compass- and GPS-module has a total weight of less than 1000 g. Maximum payload is about 300 g. Due to a lithium polymer battery with 5200 mAh capacity maximum flight times up to 25 minutes are possible. For data collection in this study, predefined GPS-controlled flight routes were not necessary due to the small field size.
The UAV carried a GoPro Hero 3+ Black Edition (GoPro, Inc., San Mateo, USA), which captures high resolution (3000 x 4000 pixel) stereo images. The sensor equipped with a fisheye-lens and a DJI Zenmuse H3-2D gimbal have a total weight of 230 g. The total costs of the whole system are about 1300 €.
For UAV image acquisition nine highly visible Ground Control Points (GCP) were applied at the boarders of the experimental field (fig. 1). The GCP were measured by a HiPer Pro Topcon DGPS (Topcon Co., Tokyo, Japan), which has an accuracy of less than 0.01 m in all directions. About 60 – 80 images in nadir position were captured at each of the seven acquisition dates (22/05, 13/06, 03/07, 17/07, 26/07, 12/08 and 18/09/2014). Due to a flight altitude of 7 – 10 m above the plant canopy a picture overlap of about 95 – 100 % was reached.
2.2.2 In-field measurements: A control survey for plant
height modelling was conducted on every UAV acquisition date with a ruler at four randomly chosen hills per plot. In addition to the UAV campaigns, destructive and non-destructive in-field measurements were taken on 04/07, 12/08 and 11/09/2014. Biomass samples consisting of three Hills per Plot were taken to measure fresh and dry aboveground biomass (AGB), leaf area index (LAI) and plant nitrogen concentration (PNC) in the laboratory. Before, hyperspectral datasets were collected from the chosen samples. Canopy spectral reflectance was captured with a non-imaging passive ASD QualitySpec® Pro (Analytical Spectral Devices, Inc., Boulder, USA) between 11 am and 1 pm. It is sensitive in the wavelength domain of 350 – 1800 nm and has a sampling interval of 1.4 nm in the VNIR and 2 nm in the SWIR. Calibration measurements were taken at least every ten minutes with a BaSO4-reference panel. In every plot nine reflection curves were taken per acquisition date. Figure 2: Platform and sensor used in this study
The biomass samples were rinsed with water and divided in leafs, stems and heads. The roots of every sample were clipped. Afterwards fresh AGB of the single organs were measured. LAI were captured by a LI-COR LI-3000 scanner (LI-COR, Lincoln, USA). After drying the samples at 105 °C for 60 minutes and 70 °C for one week, they were weighed to determine dry AGB. PNC was measured from leaf and head samples with a vario EL cube (elementar Analysesysteme GmbH, Hanau, Germany) after fine grinding.
2.3 Data processing
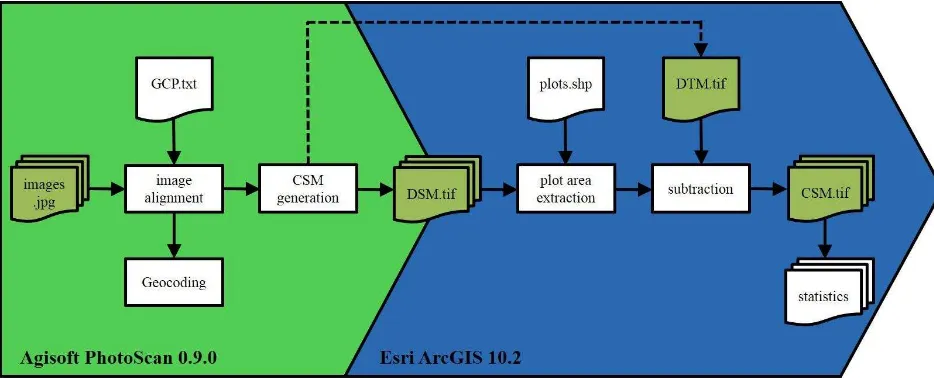
2.3.1 Plant height estimation:
Figure 3 shows the processing steps conducted to calculate absolute plant height values for the experimental field. The approach is geared to the study of Bendig et al. (2013b), who did similar CSM calculations for a barley experiment on a larger scale with a different UAV-system. In our study we used the software Agisoft PhotoScan 0.9.0 (www.agisoft.com) for point cloud building. ArcGIS 10.2 (www.esri.com) was used for post-processing and calculation of absolute height values.
The determination of 3D information from stereo images in Agisoft Photoscan is based on the Structure from Motion approach (SfM; Snavely, 2008). In every single image SfM detects characteristic pixels (e.g. edges of objects) and can thus, following the concept of traditional stereographic systems, reconstruct the camera positions. Consequently, three-dimensional relations between objects can be predicted. The positions of the GCP are identified manually in every image to support a detailed alignment and implement a geocoding of the models. Detailed information about the calculation process of SfM can be found in Tomasi & Kanade (1992).
The fisheye-effect, which result in increasing image distortion to the edges of the pictures, is not transformed due to satisfactory results of the models. After the calculation process, the CSM is available as point cloud information in Agisoft PhtoScan. Afterwards, they were exported as raster files with a spatial resolution of 0.005 m.
Postprocessing in ArcGIS started with masking the field boundaries. To determine the absolute z-value of each pixel a Digital Terrain Model (DTM) was established which does not contain plant structures. By subtracting every single DTM from the Digital Surface Model (DSM) of the different phenological growth stages, absolute heights could be extracted. Statistical information about single pixel areas, but also about average plot heights were calculated by the Zonal Statistics as Table tool. Thus, the calculation of absolute plant height and growth dynamics between the acquisition dates were conducted.
2.3.2 Vegetation indices:
To analyse the relation between absolute plant height values and hyperspectral data, the measures reflection curves were transformed into spectral VI. In this study, we evaluated the performance of Normalized Difference Vegetation Index (NDVI), Red-Edge-Index and Modified Soil-Adjusted Vegetation Index (MSAVI2). The selection of these VI is based on their common implementation in similar studies (Gnyp et al., 2013; Thenkabail et al., 2004; Goetz, 2009). In addition, their calculations are based on different approaches and rates of complexity. While the Red-Edge-Index contains of spectral reflectance in fixed wavelengths, NDVI and MSAVI2 contain maximum and minimum reflectance bands of physiological influenced wavelength regions. Detailed equations for calculation and authors are presented in appendix 1.
3. RESULTS
The presentation of the results is structured into the description of the CSM, the validation with in-field data and the correlation to determined agronomic parameters.
3.1 Crop surface models
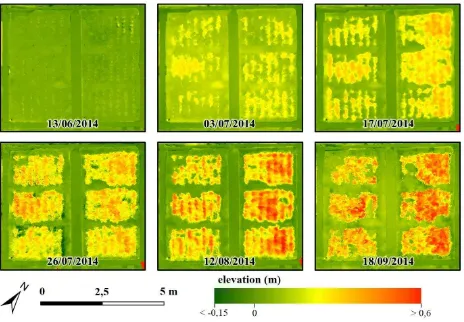
Using Agisoft PhotoScan it was possible to calculate CSM for all acquisition dates. Due to the given camera resolution and the chosen software settings all raster models have a spatial resolution of 0.005 m. However, detailed structures of single plants (e.g. single leafs) are not detectable, because of plant movements during the acquisition and data export in raster format. The calculated CSM are shown in figure 4 (for plot numbering see figure 1). The distribution of height values in all models enables a general determination of the plot extents. Differing plant height variabilities and single hill structures into the plots are detectable as well. In addition, the models provide information about the water level and single erosion pattern at the surface of the soil.
Table 1 presents general output statistics of the CSM for all acquisition dates. We exported minimum, maximum and range values, mean model height and standard deviation from plot extents. Over all dates CSM heights range from -0.39 to 1.07 m (both extrema at 26/07). All minimum values are negative, which indicates a general lowering of the soil. In addition, single erosion structures due to permanent water circulation occurred. Maximum values are generally increasing over the vegetation period. However, an exception is shown by the heights of the CSM from 26/07 with a maximum pixel value of 1.07 m. This has an effect on the range, which varies from 0.36 m (03/07) to 1.47 m (26/07). Mean CSM heights indicate the general growth of paddy rice plants over the period under observation. At the end of vegetation period the plant growth saturates, which is indicated by similar mean values of the last two acquisition dates (both about 0.28 m). The calculation of standard deviation shows that minimum and maximum values are generally exceptions. Standard deviation in increasing lightly with growing plant height and does not represent the variations of range values at 03/07 and 26/07.
Date 13/06 03/07 17/07 26/07 12/08 18/09
min -0,14 -0,03 -0,02 -0,39 -0,05 -0,10
max 0,24 0,33 0,43 1,07 0,65 0,83
range 0,38 0,36 0,46 1,47 0,71 0,94
mean 0,03 0,15 0,19 0,21 0,28 0,28
std. 0,01 0,04 0,08 0,10 0,13 0,14
Table 1: Descriptive statistics of derived plant heights in meter (std. = standard deviation)
In a comparison of plant heights between the nitrogen treatments, differences are detectable with the CSM-approach as well. As figure 4 indicates, plant height in both treatments is generally increasing. However, in later phenological stages this growth is less pronounced. At the first and second acquisition date no significant differences between 30 kg N/ha and 80 kg N/ha treatment are detectable. From 13/05 to 03/07 the plants of both field areas grow on average from 0.03 m to 0.15 m. Until 17/07 the CSM show a further increasing about
15 %, whereas plants of the 80 kg N/ha treatment are slightly higher. At 12/08 and 18/09 the average differences between the nitrogen treatments are about one third (30 kg N/ha: 0.23 m; 80 kg N/ha: 0.35 m).
3.2 Accuracy assessment
To validate the calculated plant heights of all CSM, in-field measurements were conducted for every acquisition date. Per plot four sample hills were chosen to measure plant height with a ruler. The results were compared with mean CSM raster values of a 3 cm buffer around the sample points. A diagram containing the validation results is shown in figure 5. At a sample size of 144 measurements R2 is about 0.75. The y-intercept of the linear regression model is about -7.5 cm, which indicates generally lower values in the CSM compared to the in-field measurements.
Figure 5: Regression of plant heights from CSM and in-field measurements (n = 144)
3.3 Correlation to other agronomic parameter
Agronomic parameters: In the course of the vegetation period
fresh AGB of the 30 kg N/ha treatment generally increased from about 400 g/m2 (04/07) over 1600 g/m2 (12/08) to 1950 g/m2 (11/09). The measured values for the 80 kg N/ha treatment are about 20 % higher. Water content calculated from the difference between fresh and dry AGB varies between 10 to 20 % in average. The LAI increases from about 0.5 in both treatments (04/07) to 1.5 at 30 kg N/ha and 2.3 at 80 kg N/ha (12/08). At 11/09 the LAI decreases in both cases about 15 %.
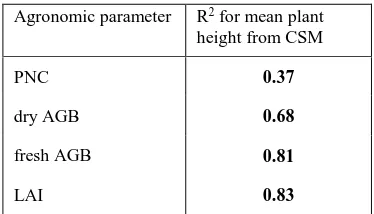
Agronomic parameter R2 for mean plant height from CSM
PNC 0.37
dry AGB 0.68
fresh AGB 0.81
LAI 0.83
PNC of the leaves is generally 10 % higher at the 80 kg N/ha treatment and increased in the course of the acquisition dates (30 kg N/ha: 3.8 % at 04/07 to 2.4 % at 11/09; 80 kg N/ha: 5.0 % at 04/07 to 3.0 % at 11/09). PNC in the heads varied in all cases from 1.6 to 1.8 %. R2 values for the regression models between the agronomic parameters and mean plant height from CSM are presented in table 2. Whereas the correlation to PNC has a very low R2 of 0.37, AGB and LAI performed much better in this study.
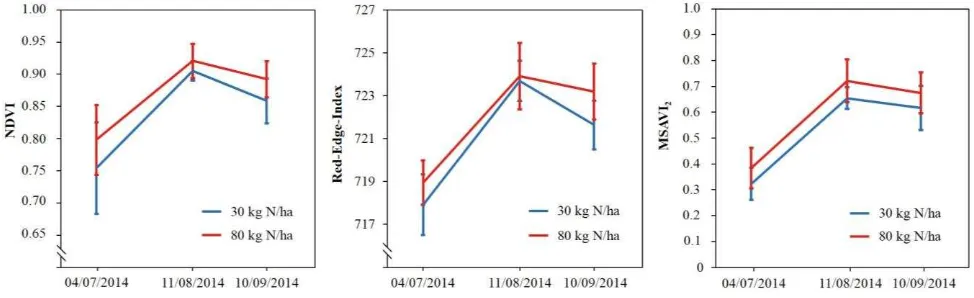
3.3.1 Vegetation indices: Averaged values and the standard
deviation of all VI are shown in figure 6. The temporal course of NDVI, Red-Edge-Index and MSAVI2 are very similar. On the one hand there are clear differences in the nitrogen treatments. In all cases a higher amount of fertilizer leads to higher values of the VI. Whereas the treatment differences of MSAVI2 are constantly about 20%, they are for NDVI and Red-Edge-Index smaller (about 5 %) and more heterogeneous. On the other hand also the temporal changes between the dates are similar. All VI show a strong increase between 04/07 and 12/08 and a light decrease to 11/09. The correlation analysis of the VI and the mean plant height from the CSM results in R2 values of 0.67 for NDVI, 0.77 for Red-Edge-Index and 0.81 for MSAVI2.
4. DISCUSSION
The study showed that rice production in Germany is generally possible under the given agro-climatic conditions. In comparison to rice plants in common cultivation areas e.g. in Asia, agronomic parameters in this study show very similar values per unit area in the different phenological stages (Katsura et al., 2010; Fageria, 2007; Yoshida, 1981). This may also be due to a high number of plants per unit area in the given experiment. However, against the background that open land cultivation of paddy rice in Germany was never focussed in a research approach before, the results show a great promise for further research.
Using a customary UAV-system consisting of a DJI Phantom 2 and a GoPro Hero 3+ sensor is suitable for CSM generation of paddy rice fields. In this study it was possible to derive high resolution three-dimensional information of the conducted experimental field. Due to the small field size, the low flying altitude and the very high picture overlap a spatial resolution of 0.005 m was achieved. Comparable studies worked with similar spatial resolutions (Bendig et al., 2013a; Aber et al., 2010; Geipel, 2015), but they mostly used cameras with higher resolutions.
In comparison of the applied nitrogen treatments, differences in agronomic parameters are not as large as in other studies (Stroppiana et al., 2009; Gnyp et al. 2013). Especially in AGB and PNC, differences between the treatments were small. In contrast, averaged values of the CSM and the VI are greater at higher nitrogen availability. These only slightly differences possibly appear due to an already high nitrogen content of the used soil. It contained a high proportion of fresh compost which was possibly oversaturated with organic nitrogen.
As the accuracy assessment show, modelled plant heights were in average 10 to 20 cm smaller compared to the measured heights. We figured out the following reasons for this underestimation:
-Due to a movement of plants during image acquisition, single leafs which might emerge from the general canopy could not be detected.
-The ground level of the experimental field let down slightly after DTM-modelling. This is indicated by negative heights of open soil surfaces in the CSM. -Wind fields caused by the movement of UAV rotors may
effected a depression of the plant canopy.
-In-field measurements with a ruler cannot be seen as a general standard for plant height determination due to different challenges (e.g. fixing of maximum heights of single plants or leaves).
-The transformation of 3D point clouds to raster models leads to average calculation for each pixel and smoothing effects.
The correlation analysis resulted in similar findings of comparable studies (e.g. Stroppiana et al., 2009). In this context we address a general problem of the conducted study. From the fact that the area of the field experiment is comparatively small (see Bendig et al., 2013a), the overall sample size for hyperspectral VI and other agronomic parameters is small as well (n = 54). Thus, statistical analysis has to be seen with particular caution. Nevertheless, against the background of rice cultivation in a not examined environment so far, the results open up new vistas for further research in rice cultivation in Central Europe.
5. CONCLUSION
The presented approach enables multi-temporal data acquisition using a very low cost and highly flexible UAV-system for small-scale crop monitoring of paddy rice. For all acquisition dates we could determine single in-field structures in the CSM (e.g. distribution of hills) and different growth characteristics
between the nitrogen treatments. Especially in the second half of the growing season, the plants with higher nitrogen availability were about 25 – 30 % larger. The plant height in the CSM correlates particularly with fresh AGB and the LAI (R2 > 0.8). The findings can help inexperienced users, like farmers, to improve real-time crop monitoring. Especially the low costs, but also the simple operation opportunities of the system enable an easy and flexible application.
In summary, the study showed as well, that rice farming in Central Europe is generally possible. Although the cultivation performed well, some potential improvements could be investigated and applied in further studies. These include, inter alia, an adjustment of the density of plants and an expansion of the field size.
REFERENCES
Aber, J.S., Marzloff, I., Ries, J. B., 2010. Small-Format Aerial Photography. Principles, Techniques and Gesoscience Applications. Elsevier, Amsterdam.
Bendig, J., Willkomm, M., Tilly, N., Gnyp, M.L., Bennertz, S., Qiang, C., Miao, Y., Lenz-Wiedemann, V.I.S. & Bareth, G., 2013a. Very high resolution crop surface models (CSMs) from UAV-based stereo images for rice growth monitoring in Northeast China. In: The International Archives of the Photogrammetry, Remote Sensing and Spatial Information Sciences, Rostock, Germany, Vol. XL-1/W2, pp. 45-50.
Bendig, J., Bolten, A. & Bareth, G., 2013b. UAV-based Imaging for Multi-Temporal, very high Resolution Crop Surface Models to monitor Crop Growth Variability. PFG Photogrammetrie, Fernerkundung, Geoinformation, 2013(6), pp. 551-562.
Berni, J.A.J., Zarco-Tejada, P.J., Suárez, L., González-Dugo, V., & Fereres, E., 2009. Remote sensing of vegetation from UAV platforms using lightweight multispectral and thermal imaging sensors. The International Archives of the Photogrammetry, Remote Sensing and Spatial Information Sciences, 38(6).
Fageria, N.K., Slaton, N.A. & Baligar, V.C., 2003. Nutrient Management for Improving Lowland Rice Productivity and Sustainability. Advances in Agronomy, 80(1), pp. 63-152.
Fageria, N.K., 2007. Yield physiology of rice. Journal of Plant Nutrition, 30(4-6), pp. 843-879.
FAOSTAT, 2013. Food and Agricultural Organization of the United Nations. FAO Statistical Database, http://faostat3.fao .org/download/Q/*/E (26 Jan. 2015).
Geipel, J., Link, J. & Claupein, W., 2014. Combined Spectral and Spatial Modeling of Corn Yield Based on Aerial Images and Crop Surface Models Acquired with an Unmanned Aircraft System. Remote Sensing, 6(11), pp. 10335-10355.
Gnyp, M. L., Yu, K., Aasen, H., Yao, Y., Huang, S., Miao, Y. & Bareth, G., 2013. Analysis of Crop Reflectance for Estimating Biomass in Rice Canopies at Different Phenological Stages. Photogrammetrie - Fernerkundung – Geoinformation, 2013(4), pp. 351-365.
Goetz, A.F.H., 2009. Three decades of hyperspectral remote sensing of the Earth: A personal view. Remote Sensing of Environment, 113(1), pp. 5-16.
Guyot, G. & Baret, F., 1988. Utilisation de la Haute Resolution Spectrale pour Suivre L'etat des Couverts Vegetaux. Spectral Signatures of Objects in Remote Sensing, 287(1), pp. 279-286.
Hansen, P.M. & Schjoerring, J.K., 2003. Reflectance measurement of canopy biomass and nitrogen status in wheat crops using normalized difference vegetation indices and partial least squares regression. Remote Sensing of Environment, 86(4), pp. 542-553.
Katsura, K., Okami, M., Mizunuma, H. & Kato, Y., 2010. Radiation use efficiency, N accumulation and biomass production of high-yielding rice in aerobic culture. Field Crops Research, 117(1), pp. 81-89.
Mulla, D.J., 2013. Twenty five years of remote sensing in precision agriculture: Key advances and remaining knowledge gaps. Biosystems Engineering, 114(4), pp. 358-371.
Snavely, K.N., 2008. Scene Reconstruction and Visualization from Internet Photo Collections. Dissertation, University of Washington, USA.
Stroppiana, D., Boschetti, M., Brivio, P.A. & Bocchi, S., 2009. Plant nitrogen concentration in paddy rice from field canopy hyperspectral radiometry. Field Crops Research, 111(1-2), pp. 119-129.
Thenkabail, P.S., Enclona, E.A., Ashton, M.S. & van der Meer, B., 2004. Accuracy assessments of hyperspectral waveband performance for vegetation analysis applications. Remote Sensing of Environment, 91(3–4), pp. 354-376.
Tomasi, C. & Kanade, T., 1992. Shape and motion from image streams under orthography: a factorization method. International Journal of Computer Vision, 9(2), pp. 137-154.
Van der Wal, T., Abma, B., Viguria, A., Previnaire, E., Zarco-Tejada, P., Serruys, P., Van Valkengoed, E. & van der Voet, P. F., 2013. Unmanned aerial systems for crop monitoring services. Precision Agriculture, 13(1), pp. 169-175.
Watts, A.C., Ambrosia, V.G. & Hinkley, E.A., 2012. Unmanned aircraft systems in remote sensing and scientific research: Classification and considerations of use. Remote Sensing, 4(6), pp. 1671-1692.
APPENDIX
VI Formula Reference
NDVI Rouse et al., 1974
Red-Edge-Index
Linear Method: Guyot & Baret, 1988
MSAVI2 Qi et al., 1994