ON THE USE OF DUAL-CO-POLARIZED TERRASAR-X DATA
FOR WETLAND MONITORING
A. Schmitt, T. Leichtle, M. Huber, A. Roth
German Aerospace Center (DLR), Earth Observation Center (EOC), Oberpfaffenhofen, D-82234 Wessling, Germany -
(andreas.schmitt, tobias.leichtle, martin.huber, achim.roth)@dlr.de
KEY WORDS: Environment, Land Cover, Dynamic, Change Detection, SAR, Algorithms, Multitemporal, Value-Added
ABSTRACT:
Today’s SAR sensors provide a variety of different image modes particularly with regard to multipolarised acquisitions. Until now, each polarisation mode requires a special decomposition which is a severe drawback when designing processing chains. Therefore, a new description for multipolarized SAR data based on the well-known Kennaugh matrix was developed that enables the uniform description and processing of SAR data independent of its polarisation by separating backscattering strength from polarimetric information. This mathematical approach subsequently is extended to the processing of multitemporal SAR data in order to stabilize the polarimetric information over longer periods of time and to enhance temporal changes in the polarimetric backscattering. Because of the high sensitivity of the Kennaugh elements a novel multilooking technique based on the Gaussian pyramid is used that locally adapts the look factor and thus selects the optimal balance between radiometric accuracy and geometric resolution. This methodology is applied to two dual-co-polarized TerraSAR-X acquisitions over the RAMSAR testsite “Upper Rhine” in order to generate value-added products that help to map land cover and land cover changes in consequence of water level changes. The first results are very promising although the interpretation of the observed polarimetric changes is not yet validated. The aim of this paper is to present a further application of the (Differential) Kennaugh matrix which will be the kernel of a polarimetry and change detection processor to be implemented in the coming years.
1. INTRODUCTION
This paper addresses the use of TerraSAR-X data in order to determine the extent and the spatial as well as the temporal variability of open water and flooded vegetation surfaces in wetlands.
1.1 Background
Previous studies use either single- or quad-polarized (Brisco, 2011) data for wetland mapping. Single-polarized data is always available because it is still the standard mode of the common space-borne SAR sensors. Open water surfaces can be identified in SAR images by their low backscattering like it is done generating the water indication mask of the TanDEM-X mission (Wendleder, 2011). Flooded vegetation is expected to show a strong double-bounce backscattering. Unfortunately, the backscattering mechanism cannot be identified in single-polarized data sets. Therefore, the extent of flooded vegetation areas can only be estimated by their stronger backscattering in each (co-pol) channel (Hess, 1990). Quad-pol data enables the identification of several backscattering mechanisms. But, quad-pol data is not easy to acquire. Most SAR satellite sensors do not support the polarimetric mode at any user-defined time. As the quad-pol mode always effects a reduction of the imaged area and the resolution as well, this method is not suitable yet for large-area applications. Hence, we focus on dual-co-polarized data. The combination of the complex HH and VV allows the identification of two scattering mechanisms: surface and double-bounce. The reduction of image size and resolution is lower than using quad-pol data. Additionally, dual-co-polarized data is available at any time and in almost any mode with TerraSAR-X and several other sensors.
1.2 Methodology
The two complex layers of the TerraSAR-X dual-polarized SSC product cannot directly be interpreted and have to be decomposed and geocoded. As all common polarimetric decompositions only concern quad-polarized data, a new Kennaugh matrix like decomposition has been developed (Schmitt, 2012). The decomposition produces four layers. The first comprises the total intensity of both layers, which is very low over open water surfaces. The second layer gives the intensity difference between surface and double-bounce scattering. Thus, high values in the second layer indicate a dominant double-bounce scattering while low values indicate a dominant surface scattering. The third layer includes the co-pol diattenuation which is represented by the intensity difference between the two measured channels. The fourth layer is negligible only holding complementary correlation information. All layers are normalized by the total intensity or the so-called Hyperbolic-Tangent-Normalization respectively so that their value range is reduced to ]-1,1[. Having a closed range the values can be saved in an integer format without clipping information at the upper or lower end. The chosen bit depth then only fixes the sampling which reaches its maximum near the centre and decreases towards higher deviations in both negative and positive direction. For display and interpretation reasons the Hyperbolic-Tangent-Scaling of Kennaugh elements can directly be transferred to the common unit decibel via the Inverse Hyperbolic Tangent function. The first layer represents the total intensity independent of the polarization state while the other layers represent the polarized contribution to the total intensity. Hence, intensity and polarimetric information can be evaluated separately.
International Archives of the Photogrammetry, Remote Sensing and Spatial Information Sciences, Volume XXXIX-B7, 2012 XXII ISPRS Congress, 25 August – 01 September 2012, Melbourne, Australia
A new multilooking approach based on the Gaussian pyramid is used in order to suppress noise and to preserve the images geometric resolution because multiscale approaches have shown a high potential in previous studies (Schmitt, 2009). Instead of filtering the image with a constant number of looks this method locally adapts the number of looks to the image content by selecting the suitable image scale out of the Gaussian pyramid. Starting from the coarsest scale, i.e. the largest number of looks and hence, the best radiometry, the intensity values of the finer scales only are adopted if their value deviates significantly from the value with a higher look factor. The decision between better radiometric accuracy and geometric resolution is made by evaluating a stochastic model for the comparison of multilook intensities that is based on the beta distribution. Large homogeneous areas are smoothed with a large number of looks while fine structures showing deterministic scatterers remain unsmoothed. The decision pyramid derived from the intensity layer is subsequently applied to all available polarimetric layers.
The resulting layers are geocoded via the TerraSAR-X geocoding routines and normalized as described above. As this algorithm is not restricted to single-pass acquisitions, it also can be used to compare the polarimetric scattering behaviour reported by several repeat-pass images. Two image acquisitions can be merged by adopting both as independent looks for one resulting “mean” image. Beside that they can be merged as well by establishing the so-called differential Kennaugh matrix (Schmitt, 2012) that comprehends the change in intensity and polarimetry in separate layers similar to the Kennaugh matrix
for single pass acquisitions. Even the pyramidal multilooking can be used to enhance the information content. The decision pyramid is drawn from the total intensity of both images – equivalent to the first laser of the “mean” image – and then applied to all differential Kennaugh layers. Finally, the normalization step converts the changes to the Hyperbolic-Tangent-Scaling and enables further conversion to the usual unit decibel.
In summary, a combined description of single- and multi-pass acquisitions for all common polarimetric SAR data modes from single- via dual- to quad-polarization was developed. Additionally, the new multilooking approach guarantees robust and reliable radiometric results without losing geometric resolution. Consequently, simple thresholding whether by empirically or statistically derived thresholds delivers clear and smooth classification results. The final value-added product displays clearly open water surfaces and flooded vegetation for single-pass images and the change in open water and flooded vegetation for repeat-pass images.
1.3 Testsite
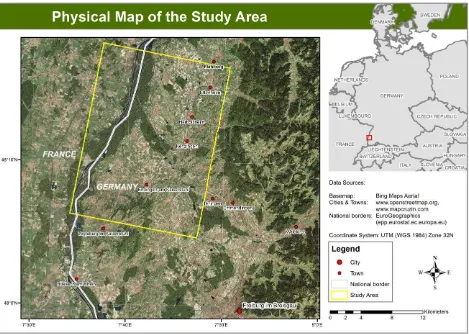
As test area the RAMSAR site “Upper Rhine” in southern Germany is chosen which is a wooded flood plain near the river Rhine, see Fig. 1. Because of its very small extension and its fine structures high resolution SAR data is absolutely required. The test site covers large areas of the nature reserve “Taubergießen”, which is an important bird area and thus belongs to the Natura 2000 network. The wetland itself is dominated by freshwater swamp forests and wooded swamps,
Figure 1: Physical Map of the Study Area “Taubergießen” in south-west Germany
International Archives of the Photogrammetry, Remote Sensing and Spatial Information Sciences, Volume XXXIX-B7, 2012 XXII ISPRS Congress, 25 August – 01 September 2012, Melbourne, Australia
which can be flooded seasonally. Especially, changes of the water level are an important factor for the unique fauna (fishes, amphibians, waterbirds) and flora of the nature reserve. These fluctuating and mostly falling water levels result from inappropriate farming practices and drainage impacts. Furthermore, falling water levels also affect human activities on the river Rhine, which is an important shipping route. Besides the monitoring of water levels, general changes of land use are also important because of the land consumption at the expense of natural areas (RAMSAR, 2012).
The time series of TerraSAR-X data cover the period of half a year from autumn 2011 to spring 2012. Out of the database two acquisitions are chosen in order to demonstrate the new methodology: 2011-11-17 and 2011-12-09. Both images are taken in the dual-co-pol strip map mode.
2. APPLICATION
The new SAR change detection method roughly described above now is applied on the mentioned data sets acquired by TerraSAR-X over the Testsite “Upper Rhine”. The complex data is decomposed into Kennaugh elements, multilooked and geocoded with a pixel spacing of 4m, which corresponds to a look factor of about 4.3 nominal looks. The geocoded Kennaugh elements are combined to the sum and the difference of the image pair. In the first case the result is the mean reflectance for both acquisitions, in the ladder case the temporal changes between both acquisition times are emphasized. Finally all images are enhanced by the help of the pyramidal multilooking with an enhancement factor of -5dB – i.e. a threshold of nearly 32% is introduced to the statistical modelling – and normalized in relation to the total intensity.
2.1 Single Images
Figs. 2 and 3 show quicklooks (QL) of the single image Kennaugh elements. The colours are composed as follows: R: K0 – total intensity
G: K3 – difference double bounce and surface scattering B: K4 – difference HH and VV intensities
The TANH-scaled elements are brought to an 8bit image format in order to give a first impression of the image content.
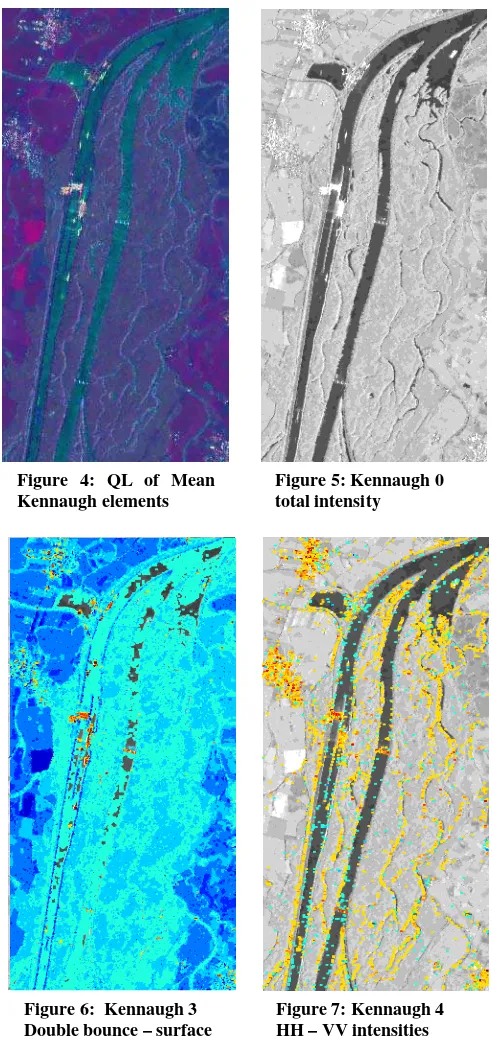
2.2 Sum Images
If the scattering information of both images is summed up, the mean reflectance is achieved, see quicklook in Fig. 4. Stable objects become sharper while the influence of non-stable objects is reduced. Fig. 5 shows the total intensity of the sum image. The polarimetric layers are depicted in Figs. 6 and 7. The colour coding starts from dark blue at -10dB, passes lighter colours – even gets transparent around zero – and reaches dark red for values around +10dB. The blue colours in Fig. 6 mark a dominant surface scattering in the natural land whereas double-bounce scattering dominates over man-made objects.
Figure 2: 2011-11-17 Kennaugh elements QL
Figure 3: 2011-12-09 Kennaugh elements QL
Figure 4: QL of Mean Kennaugh elements
Figure 5: Kennaugh 0 total intensity
Figure 7: Kennaugh 4 HH – VV intensities Figure 6: Kennaugh 3
Double bounce – surface
International Archives of the Photogrammetry, Remote Sensing and Spatial Information Sciences, Volume XXXIX-B7, 2012 XXII ISPRS Congress, 25 August – 01 September 2012, Melbourne, Australia
Swamp forest can be distinguished from agricultural land by its brighter blue colour. Fig. 7 shows that HH and VV have similar intensities in most parts of the image. The small arms of the river at the right as well as settlements stick out because of a higher reflectance in HH than in VV. Some smaller areas in the larger river arms that are characterized by a higher backscattering in VV than in HH are supposed to be covered by flooded vegetation. Comparing these areas to K3 in Fig. 6 approves this hypothesis because those areas additionally show a dominant double-bounce contribution attached to vegetation standing in water (Brisco, 2011).
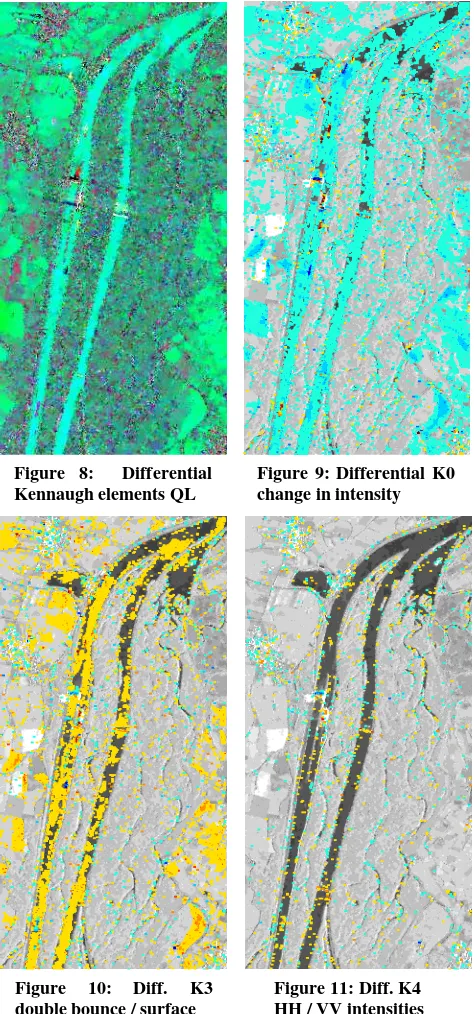
2.3 Difference Images
In order to enhance the temporal changes the Kennaugh elements of both acquisitions are differentiated (Figs. 8-11).
Fig. 8 depicts the quicklook of the differential Kennaugh elements in the same colour coding as the single acquisitions above. The change in the backscattering strength is captured in Fig. 9. Blue stands for a decrease in the total intensity of about 3dB. Over open water surfaces this behaviour can be referred to the influence of wind that roughens the surface and thus, increases the backscattering during the first image acquisition. The yellow coloured areas in Fig. 10 report an increase in the relation of double bounce to surface scattering. This can be caused by an increase of the double bounce component or a decrease of the surface scattering. As these areas coincide with the negative changes in the total intensity it is reasonable that the dominant surface scattering – apparent in Fig. 6 as large dark blue region – is slightly reduced and hence causes the increase in K3. The relation between HH and VV intensities only exhibits minor changes particularly attached to man-made objects that probably have been moved in the meantime.
3. CONCLUSION
For the first time a closed formalism is presented that enables a uniform description of (partial-) polarimetric SAR data for single image acquisitions as well as for time series. Because of the high sensitivity of the Kennaugh elements speckle filtering is absolutely required, and is done by a multiscale approach – called pyramidal multilooking that trades radiometric accuracy against geometric resolution. Especially in the context of wetland monitoring this approach reveals a high potential even though the polarimetric interpretation still is subject to further investigations. This methodology was designed to be the kernel of the future polarimetry and change detection processor implemented at the German Aerospace Center.
4. REFERENCES
Brisco, B., Schmitt, A., Murnaghan, K., Kaya, S. and Roth, A., 2011. SAR Polarimetric Change Detection for Flooded Vegetation. International Journal of Digital Earth.
Hess, L.L., Melack, J.M. and Simonett D.S. 2000. Radar detection of flooding beneath the forest canopy: a review. International Journal of Remote Sensing, 11:7, 1313-1325.
Schmitt, A., Wessel, B., Roth, A., 2012. Curvelet Approach for SAR Image Denoising, Structure Enhancement, and Change Detection. In: The International Archives of the Photogrammetry, Remote Sensing and Spatial Information Sciences, Paris, France. Vol. XXXVIII, Part 3/W4.
Schmitt, A., 2012. Aenderungserkennung in multitemporalen und multipolarisierten Radaraufnahmen, Dissertation Karlsruhe Institute of Technology.
http://digbib.ubka.uni-karlsruhe.de/volltexte/1000025955 (13 Apr. 2012)
Wendleder, A., Breunig, M., Martin K., Wessel, B. and Roth, A., 2011. Water body detection from TanDEM-X data: concept and first evaluation of an accurate water indication mask. In: IEEE International Geoscience and Remote Sensing Symposium. Vancouver, Canada.
RAMSAR – Convention on Wetlands, Ramsar, Iran, 1971, http://www.ramsar.wetlands.org, last visited 04/13/2012.
5. ACKNOWLEDGEMENTS
TerraSAR-X images from proposal LAN1403 © DLR 2011
Figure 8: Differential Kennaugh elements QL
Figure 9: Differential K0 change in intensity
Figure 10: Diff. K3 double bounce / surface
Figure 11: Diff. K4 HH / VV intensities
International Archives of the Photogrammetry, Remote Sensing and Spatial Information Sciences, Volume XXXIX-B7, 2012 XXII ISPRS Congress, 25 August – 01 September 2012, Melbourne, Australia