KALMAN FILTER BASED FEATURE ANALYSIS FOR TRACKING PEOPLE FROM
AIRBORNE IMAGES
Beril Sirmacek, Peter Reinartz
German Aerospace Center (DLR), Remote Sensing Technology Institute PO Box 1116, 82230, Wessling, Germany
(Beril.Sirmacek)@dlr.de
Commission III/5
KEY WORDS:Image sequences, Airborne images, People tracking, Tracking multiple objects, Feature extraction, Feature tracking, Kalman filtering, Object detection
ABSTRACT:
Recently, analysis of man events in real-time using computer vision techniques became a very important research field. Especially, understanding motion of people can be helpful to prevent unpleasant conditions. Understanding behavioral dynamics of people can also help to estimate future states of underground passages, shopping center like public entrances, or streets. In order to bring an automated solution to this problem, we propose a novel approach using airborne image sequences. Although airborne image resolutions are not enough to see each person in detail, we can still notice a change of color components in the place where a person exists. Therefore, we propose a color feature detection based probabilistic framework in order to detect people automatically. Extracted local features behave as observations of the probability density function (pdf) of the people locations to be estimated. Using an adaptive kernel density estimation method, we estimate the corresponding pdf. First, we use estimated pdf to detect boundaries of dense crowds. After that, using background information of dense crowds and previously extracted local features, we detect other people in non-crowd regions automatically for each image in the sequence. We benefit from Kalman filtering to track motion of detected people. To test our algorithm, we use a stadium entrance image data set taken from airborne camera system. Our experimental results indicate possible usage of the algorithm in real-life man events. We believe that the proposed approach can also provide crucial information to police departments and crisis management teams to achieve more detailed observations of people in large open area events to prevent possible accidents or unpleasant conditions.
1 INTRODUCTION
Recently automatic detection of people and understanding their behaviors from images became a very important research field, since it can provide crucial information especially for police de-partments and crisis management teams. Tracking people, un-derstanding their moving directions and speeds can be used for detecting abnormal situations. Besides, it can also help to esti-mate locations where a crowd can congregate which gives idea about future states of underground passages, shopping center like public entrances, or streets which can also affect the traffic.
Due to the importance of the topic, many researchers tried to monitor behaviors of people using street, or indoor cameras which are also known as close-range cameras. However, most of the previous studies aimed to detect boundaries of large groups, and to extract information about them. The early studies in this field were developed from closed-circuit television images (Davies et al., 1995), (Regazzoni and Tesei, 1994), (Regazzoni and Tesei, 1996). Unfortunately, these cameras can only monitor a few square meters in indoor regions, and it is not possible to adapt those algorithms to street or airborne cameras since the human face and body contours will not appear as clearly as in close-range indoor camera images due to the resolution and scale dif-ferences. In order to be able to monitor bigger events researchers tried to develop algorithms which can work on outdoor cam-era images or video streams. Arandjelovic (Arandjelovic, Sep. 2008) developed a local interest point extraction based crowd de-tection method to classify single terrestrial images as crowd and non-crowd regions. They observed that dense crowds produce a high number of interest points. Therefore, they used density of SIFT features for classification. After generating crowd and non-crowd training sets, they used SVM based classification to detect
ex-tract information from these images. In a previous study Hinz et al. (Hinz, 2009) registered airborne image sequences to estimate density and motion of people in crowded regions. For this pur-pose, first a training background segment is selected manually to classify image as foreground and background pixels. They used the ratio of background pixels and foreground pixels in a neigh-borhood to plot density map. Observing change of the density map in the sequence, they estimated motion of people. Unfortu-nately, their approach did not provide quantitative measures about crowds. In a following study (Burkert et al., Sep. 2010), they used previous approach to detect individuals. Positions of de-tected people are linked with graphs. They used these graphs for understanding behaviors of people.
In order to bring an automated solution to the problem, herein we propose a novel automatic framework to track people and to understand their behaviors from airborne images. For this pur-pose, first we introduce our automatic crowd and people detec-tion approach which is based on local features extracted from chroma bands of the input image. After detecting dense crowd regions and people in sparse groups, we apply tracking using Kalman filter. Our experiments on registered color airborne im-age sequences indicate possible usim-age of the proposed framework in real-life applications. We believe that proposed dense crowd detection, people detection, and people tracking approaches can provide crucial information to police departments and crisis man-agement teams to prevent possible accidents or unpleasant condi-tions.
2 DETECTING PEOPLE FROM AIRBORNE IMAGES
For each airborne image in the input sequence, before tracking process, we apply dense crowd detection and people detection approach. Next, we introduce steps of the approach in detail.
2.1 Local Feature Extraction
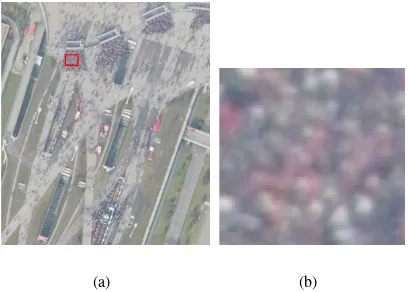
In order to illustrate the algorithm steps, we pickStadium1 im-age from ourStadium1−43test image sequence. In Fig.1.(a), we representStadium1test image, and in Fig.1.(b), we represent a subpart of the original image in order to give information about real resolution of the image. As can be seen here, airborne image resolutions do not enable to see each single person with sharp de-tails. However, we can still notice a change of color components in the place where a person exists. Therefore, our dense crowd and people detection method depends on local features extracted from chroma bands of the input test image.
For local feature extraction, we use features from accelerated seg-ment test (FAST). FAST feature extraction method is especially developed for corner detection purposes by Rosten et al. (Ros-ten et al., Nov. 2010), however it also gives high responses on small regions which are significantly different than surrounding pixels. The method depends on wedge-model-style corner detec-tion and machine learning techniques. For each feature candidate pixel, its16neighbors are checked. If there exist nine contigu-ous pixels passing a set of pixels, the candidate pixel is labeled as a feature location. In FAST method, these tests are done using machine learning techniques to speed up the operation.
For FAST feature extraction from invariant color bands of the image, we first start with converting our RGB test image into CIELab color space. In many computer applications, the CIELab color space is used since it mimics the human visual system. CIELab color space bands are able to enhance different colors best and minimize color variances (Fairchild, 1998). After trans-forming the RGB color image into CIELab color space, again we
(a) (b)
Figure 1: (a)Stadium1test image from our airborne image se-quence including both crowded and sparse people groups, (b) Closer view of a crowded region inImage1.
obtain three bands asL,a, andb(Paschos, 2001). Here,Lband corresponds to intensity of the image pixels. a,bbands contain chroma features of the image. These two bands give information about the color information independent of illumination. For il-lumination invariance, in this study we use onlyaandbchroma bands of image for local feature extraction. To detect small re-gions which have significantly different color values than their surroundings, we extract FAST features froma and bchroma bands of the image. For detailed explanation of FAST feature extraction method please see (Rosten et al., Nov. 2010).
We assume(xa, ya)a∈[1,2, ..., Ka]and(xb, yb)b∈[1,2, ..., Kb]
as FAST local features which are extracted fromaandbchroma bands of the input image respectively. Here, Ka and Kb in-dicates the maximum number of features extracted from each chroma band. As local feature, in our study we use (xi, yi)
i∈[1,2, ..., Ki]features which holds features coming from two chroma bands. However, if two features from different bands are extracted at the same coordinates, it is held only for one time in
(xi, yi)i∈[1,2, ..., Ki]array. Therefore, we expectKinumber to be less than or equal toKa+Kb.
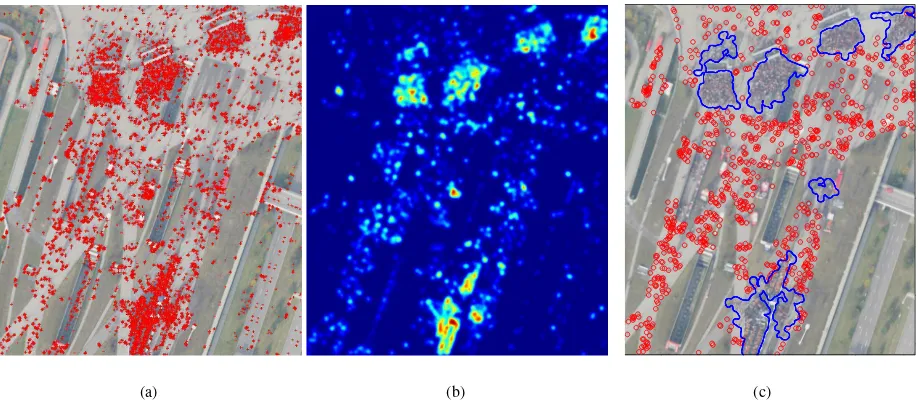
We represent locations of detected local features forStadium1 test image in Fig. 2.(a). Extracted FAST features behave as ob-servations of the probability density function (pdf) of the people to be estimated. In the next step, we introduce an adaptive kernel density estimation method, to estimate corresponding pdf which will help us to detect dense people groups and people in dense groups.
2.2 Detecting Dense Crowds Based on Probability Theory
Since we have no pre-information about the street, building, green area boundaries and crowd locations in the image, we formulate the crowd detection method using a probabilistic framework. As-sume that(xi, yi)is theith FAST feature wherei∈[1,2, ..., Ki]. Each FAST feature indicates a local color change which might be a human to be detected. Therefore, we assume each FAST fea-ture as an observation of a crowd pdf. For crowded regions, we assume that more local features should come together. Therefore knowing the pdf will lead to detection of crowds. For pdf estima-tion, we benefit from a kernel based density estimation method as Sirmacek and Unsalan represented for local feature based build-ing detection (Sirmacek and Unsalan, 2010).
(a) (b) (c)
Figure 2: (a) Detected FAST feature locations onStadium1 test image are represented with red crosses, (b) Estimated probability density function (color coded) forStadium1image generated using FAST feature locations as observations, (c) Automatically detected dense crowd boundaries and detected people in sparse groups forStadium1image.
X
x X
y
N(x, y) = 1 (1)
N(x, y)≥0,∀(x, y) (2)
The pdf estimator with kernelN(x, y)is defined by,
p(x, y) = 1
nh n X
i=1
N(x−xi
h , y−yi
h ) (3)
wherehis the width of window which is also called smoothing parameter. In this equation,(xi, yi)fori= 1,2, ..., nare obser-vations from pdf that we want to estimate. We takeN(x, y)as a Gaussian symmetric pdf, which is used in most density estima-tion applicaestima-tions. Then, the estimated pdf is formed as below;
p(x, y) = 1
R Ki
X
i=1
1
√
2πσexp(−
(x−xi)2+ (y −yi)2
2σ ) (4)
whereσis the bandwidth of Gaussian kernel (also called smooth-ing parameter), andRis the normalizing constant to normalize pn(x, y)values between[0,1].
In kernel based density estimation the main problem is how to choose the bandwidth of Gaussian kernel for a given test image, since the estimated pdf directly depends on this value. For in-stance, if the resolution of the camera increases or if the altitude of the plane decreases, pixel distance between two persons will increase. That means, Gaussian kernels with larger bandwidths will make these two persons connected and will lead to detect them as a group. Otherwise, there will be many separate peaks on pdf, but we will not be able to find large hills which indicate crowds. As a result, using a Gaussian kernel with fixed bandwidth will lead to poor estimates. Therefore, bandwidth of Gaussian kernel should be adapted for any given input image.
In probability theory, there are several methods to estimate the bandwidth of kernel functions for given observations. One well-known approach is using statistical classification. This method is based on computing the pdf using different bandwidth parame-ters and then comparing them. Unfortunately, in our field such a framework can be very time consuming for large input im-ages. The other well-known approach is called balloon estima-tors. This method checks k-nearest neighborhoods of each obser-vation point to understand the density in that area. If the density is high, bandwidth is reduced proportional to the detected den-sity measure. This method is generally used for variable kernel density estimation, where a different kernel bandwidth is used for each observation point. However, in our study we need to com-pute one fixed kernel bandwidth to use at all observation points. To this end, we follow an approach which is slightly different from balloon estimators. First, we pickKi/2number of random observations (FAST feature locations) to reduce the computation time. For each observation location, we compute the distance to the nearest neighbor observation point. Then, the mean of all dis-tances give us a numberl(calculated 105.6 forStadium1). We assume that variance of Gaussian kernel (σ2
) should be equal or greater thanl. In order to guarantee to intersect kernels of two close observations, we assume variance of Gaussian kernel as5l in our study. Consequently, bandwidth of Gaussian kernel is esti-mated asσ=√5l. For a given sequence, that value is computed only one time over one image. Then, the sameσvalue is used for all observations which are extracted from images of the same sequence. The introduced automatic kernel bandwidth estima-tion method, makes the algorithm robust to scale and resoluestima-tion changes.
image, boundaries of detected crowd regions are represented on original input image with blue borders in Fig. 2.(c). After de-tecting very dense people groups, in the next step we focus on detecting other people in sparse groups.
After detecting dense crowds automatically, we also extract quan-titative measures from detected crowds for more detailed analy-sis. Since they indicate local color changes, we assume that de-tected features can give information about number of people in crowded areas. Unfortunately, number of features in a crowd re-gion do not give the number of people directly. In most cases, shadows of people or small gaps between people also generate a feature. Besides, two neighbor features might come from two different chroma bands for the same person. In order to decrease counting errors coming from these features, we follow a different strategy to estimate the number of people in detected crowds. We use a binary maskBf(x, y)where feature locations have value 1. Then, we dilateBf(x, y)using a disk shape structuring el-ement with a radius of 2 to connect close feature locations. Fi-nally, we apply connected component analysis to mask, and we assume the total number connected components which are laying in a crowd area as the number of people (N). In this process, slight change of radius of structuring element does not make a significant change in estimated people numberN. However, an appreciable increase in radius can connect features coming from different persons, and that decreasesNwhich leads to poor num-ber of people estimates.
If the resolution of the input image is known, using estimated number of people in crowd, the density of people (d) can also be calculated. Lets assume,Bj
c(x, y)is thejth connected compo-nent inBc(x, y)crowd mask. We calculate crowd density forjth crowd asdj = N/(P are the numbers of pixels in the image in horizontal and vertical directions respectively, andais the area of one pixel asm2
.
2.3 Detecting People in Sparse Groups
Besides detecting dense crowd regions and extracting quantitative measures on them, detecting other people in non-crowd regions is also crucial. Since detecting people in non-crowd regions can help to develop people tracking or behavior understanding sys-tems.
In order to detect people in non-crowd regions, we apply con-nected component analysis (Sonka et al., 2007) toBf(x, y) ma-trix, and pick mass centers of the connected components(xp, yp)
p∈[1,2, ..., Kp]which satisfyBc(xp, yp) = 0as locations of individual people in sparse groups. Unfortunately, each(xp, yp)
p∈[1,2, ..., Kp]location satisfying this rule does not indicate a person appearance directly. Since the location might be coming from irrelevant local features coming of another object like a tree or chimney of a rooftop. In order to decide that, if a(xp, yp)
position is indicating a person appearance or not, we apply a background comparison test. At this step, in order to represent a person, background color of a connected component which is centered in(xp, yp)position should be very similar to the back-ground color of detected dense crowds.
In order to do background similarity test, first we pick all border pixels of the binary objects (crowd regions) inBc(x, y)binary crowd mask. We assumeLc,ac, andbcas mean ofL,a,bcolor band values of these pixels. For each(xp, yp)p∈[1,2, ..., Kp]
location which satisfyBc(xp, yp) = 0equation, we apply the same procedure and obtainLp, ap, bp values which indicates mean ofL,a,bcolor band values around connected component located at(xp, yp)center point. In order to test background simi-larity, we check if extracted values satisfy inequality given below,
p
(Lc−Lp)2+ (ac
−ap)2+ (bc
−bp)2< ξ (5)
In our study, we selectξas equal to10after extensive tests. Al-though slight changes ofξvalue does not effect detection result, large increase of this threshold might lead to false detections, on the other hand large decrease might lead to inadequate detections. In Fig.2.(c), we provide detected people in non-crowd regions of Stadium1test image.
3 PEOPLE TRACKING USING KALMAN FILTER
Tracking allows us to see how each person is behaving over time, which provides another very important information. Unfortu-nately, we cannot track people which appear in dense crowd re-gions. We try to track individual people in sparse groups that we detected in previous step.
In order to track and extract the motion path of detected people, we benefit from Kalman filter. The Kalman filter is an efficient re-cursive filter which estimates the state of a dynamic system from a series of incomplete and noisy measurements, developed by Rudolf Kalman (Kalman, 1960). The filtering process consists of two main steps; time update (prediction) step, and measurement update (correction) step. The time update step is responsible for projecting the current state forward in time to obtain the priori estimates for the next time step. The measurement update step deals with the feedback of the system to obtain improved a poste-riori values. In our study, we benefit from Kalman filter in order to connect person’s positions represented with(xn
p, ynp)fornth image with person’s positions represented with(xn+1
p , yn+1p )in n+ 1th image. Kalman filter helps us to predict location of a person in the next image of the sequence using the information obtained in the previous image. First, we define the state vector XnasXn= (xn location and velocity vectors of detected people respectively in nth image of the sequence. Observation vectorYnis defined to represent the location of the people innth image. The state vec-torXnand the observation vectorYnare related as the following basic system equation;
Xn=φXn−1+Gwn−1 (6)
Yn=HXn+vn (7)
whereφis known as the state transition matrix,Gis the driving matrix,H is the observation matrix, andwnis the system noise added to the velocity of the state vectorXn, andvnis the obser-vation noise which is the error between real and detected location. As in most of the human motion tracking studies, in our study we assume approximately uniform straight motion for a person in successive images. Then,φ,G,Hare defined as follows;
H=
Because of the short capturing time between input images, we assume∆t = 1. wnandvnare assumed as constant Gaussian noise with zero mean. Thus the covariance matrix forwnand vnbecomeσ2
wI2×2andσ2vI2×2, whereI2×2represent a2×2 identity matrix. Finally, we formulate Kalman filter as,
Kn= ¯PnHT(HPnH¯ T+I2×2)
p are estimated values ofx n pandy
n
p. Pn¯ equals toC/σ2
v,C represents the covariance matrix of estimated error ofx¯n
p. Kn is Kalman gain, andQequals toGGT. Then the predicted location of the feature inn+ 1th image is given as
(¯xp(n+1),yp¯ (n+1)). For more detailed explanation of Kalman filtering process please refer to related reference (Kalman, 1960).
After predicting next movement positions for each person us-ing their previous position information, we use this information for tracking. For jth person detected in (xn
p(j), ypn(j)) loca-tion innth image of the sequence, we calculate predicted posi-tion in the next step as(¯xn+1 inequality, in another saying if the person inn+ 1th image in
(xn
p(j), ynp(j))location is less than 5 pixels away from the pre-dicted position of the person in(xn
p(j), y n
p(j)), we assume that
(xn+1
p (l), yn+1p (l))is the next position of this person. Using this information, we can connect motion path of each individual per-son in input images.
In some cases, because of the low resolution of the airborne im-ages, we cannot detect the same person in each image of the sequence. In that case, forjth person in(xn ity. In order to continue to tracking process, we assume Kalman filter’s estimated position(¯xn+1
p (j),y¯n+1p (j))as the next posi-tion of the person. Therefore, besides enabling multiple object tracking, Kalman filter also help us to continue tracking process even if a person cannot be detected in some of the images of the sequence.
In Fig.3 and 4, we provide example tracking results for three dif-ferent conditions. In Fig.3, in sequence there is also one false person detection in the sequence which does not effect our track-ing process. In Fig.4.(a) we present detected motion paths for two persons walking in opposite directions, and in Fig.4.(b) two persons who are walking very close to each other are tracked cor-rectly.
4 EXPERIMENTS
To test our method, we use airborne images which are obtained using a new low-cost airborne frame camera system (named 3K
Figure 3: Tracking process of one person. (a) A sub-region from Stadium1test image, (b) A sub-region fromStadium6test im-age (includes also a false detected person location), (c) A sub-region fromStadium15test image, (d) Detected motion path of the person.
(a) (b)
Figure 4: (a) Detected motion paths for two persons walking in opposite directions, (b) Detected motion paths for two persons which are walking very close to each other.
camera) which has been developed at the German Aerospace Cen-ter (DLR). The spatial resolution and swath width of the camera system range between15cmto50cm, and2,5kmto8km re-spectively. Within two minutes an area of approximately10km×
8kmcan be monitored. That high observation coverage gives great advantage to monitor large events. Obtained image data are processed onboard by five computers using data from a real-time GPS/IMU system including direct georeferencing. In this study, our 3K airborne camera image data set consists of a sta-dium entrance data set (Stadium1−43) which includes 43 multi-temporal images. Because of manually focusing difficulties of the current camera system, unfortunately most of the images in our data set are blurred. Although this issue decreases detection capabilities of our system, obtained results can still provide im-portant information about states of the crowds and approximate quantitative measures of crowd and non-crowd regions. Besides, we can apply tracking operation to extract motion path of peo-ple in non-crowd regions. We believe that future airborne camera systems with correct focusing capabilities will help us to obtain more accurate estimations.
high performance of the proposed approach.
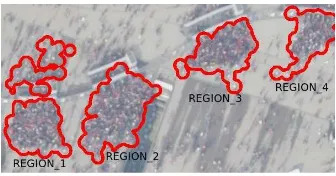
Figure 5: A small part ofStadium1 test image. Labels of de-tected crowds which are used for performance analysis are writ-ten on the image.
Table 1: Comparison of groundtruth and automatically detected people number and density estimation results for test regions in Stadium1.N anddstand fornumber of peopleandnumber of people per square meterrespectively.
REGI ON1 REGI ON2 REGI ON3 REGI ON4
N 139 211 115 102
Ngth 132 180 114 98
d 0.81 0.74 0.68 0.76
dgth 0.76 0.63 0.67 0.73
In order to measure performance of the tracking step, for each individual person we measure the Euclidean distance between
(¯xn
p,y¯np)position which is estimated atn−1th step, with the po-sition(xn
p, ynp)which is detected atnth step. Mean of difference measures which are calculated from each input image of the se-quence gives us information about the tracking performance. For jth person of the scene, we calculate the tracking performance with the following equation.
Err=
PN n=2
p
(xn
p(j)−x¯np(j))2+ (ynp(j)−y¯np(j))2 N−1
(14)
Here, smallerErrvalue indicates smaller error in the estima-tions of tracking process, or in other saying smallerErrindicates higher tracking performance. For instance, for the tracking opera-tion represented in Fig.3,Erris calculated as4,90. Despite very low image resolutions,283of365persons in non-crowd regions are detected and tracked automatically.
5 CONCLUSIONS AND FUTURE WORK
In order to solve crowd and people behavior analysis problem, herein we propose a novel and fully automatic approach using airborne images.
Although resolutions of airborne images are not enough to see each person with sharp details, we can still notice a change of color components in the place where a person exists. Therefore, we used local features which are extracted from illumination in-variant chroma bands of the image. Assuming extracted local features as observation points, we generated a probability den-sity function using Gaussian kernel functions with constant band-width which can adapt itself automatically regarding input im-age resolutions. Using obtained pdf function, first dense crowd boundaries are robustly detected and quantitative measures are extracted for crowds. For detecting other people, we have de-tected background color for crowd regions, and we searched for
feature locations with similar background color. Detected in-dividual people are tracked in the input image sequence using Kalman filtering. We have tested our algorithm on a stadium en-trance airborne image sequence. Our experimental results indi-cate possible usage of the algorithm in real-life events, also for on-board applications.
REFERENCES
Arandjelovic, O., Sep. 2008. Crowd detection from still images. British Machine Vision Conference (BMVC’08).
Burkert, F., Schmidt, F., Butenuth, M. and Hinz, S., Sep. 2010. People tracking and trajectory interpretation in aerial image sequences. Interna-tional Archives of Photogrammetry, Remote Sensing and Spatial Infor-mation Sciences (IAPRS), Commission III (Part A) XXXVIII, pp. 209– 214.
Davies, A., Yin, J. and Velastin, S., 1995. Crowd monitoring using image processing. IEEE Electronic and Communications Engineering Journal 7 (1), pp. 37–47.
Fairchild, M., 1998. Color appearance models. Addison-Wesley. Ge, W. and Collins, R., 2009. Marked point process for crowd counting. IEEE Computer Vision and Pattern Recognition Conference (CVPR’09) pp. 2913–2920.
Ge, W. and Collins, R., 2010. Crowd detection with a multiview sampler. European Conference on Computer Vision (ECCV’10).
Hinz, S., 2009. Density and motion estimation of people in crowded en-vironments based on aerial image sequences. ISPRS Hannover Workshop on High-Resolution Earth Imaging for Geospatial Information. Kalman, R., 1960. A new approach to linear filtering and prediction prob-lems. Journal of Basic Engineering 82 (1), pp. 35–45.
Lin, S., Chen, J. and Chao, H., Nov. 2001. Estimation of number of people in crowded scenes using perspective transformation. IEEE Transactions on Systems, Man, and Cybernetics - Part A: Systems and Humans 31 (6), pp. 645–654.
Otsu, N., 2009. A threshold selection method from gray-level histograms. IEEE Transactions on System, Man, and Cybernetics 9 (1), pp. 62–66. Paschos, G., 2001. Perceptually uniform color spaces for color texture analysis: an empirical evaluation. IEEE Transactions on Image Process-ing 10, pp. 932–937.
Regazzoni, C. and Tesei, A., 1994. Local density evaluation and track-ing of multiple objects from complex image sequences. Proceedtrack-ings of 20th International Conference on Industrial Electronics, Control and In-strumentation (IECON) 2, pp. 744–748.
Regazzoni, C. and Tesei, A., 1996. Distributed data fusion for real time crowding estimation. Signal Processing 53, pp. 47–63.
Rosten, E., Porter, R. and Drummond, T., Nov. 2010. Faster and better: A machine learning approach to corner detection. IEEE Transactions on Pattern Analysis and Machine Learning 32 (1), pp. 105–119.
Silverman, B., 1986. Density estimation for statistics and data analysis. 1st Edition.
Sirmacek, B. and Unsalan, C., 2010. A probabilistic framework to detect buildings in aerial and satellite images. IEEE Transactions on Geoscience and Remote Sensing.