Technology and farm performance:
paths of productive efficiencies over time
K.P. Kalirajan
∗, R.T. Shand
Department of Economics, Research School of Pacific and Asian Studies, Australian National University, Canberra, ACT 0200, Australia Received 28 April 1998; received in revised form 4 December 1999; accepted 10 April 2000
Abstract
The focus of this paper is the process of adjustment of farm performance to disequilibrium with new technology over time, which has been a subject of speculation till now. It shows that, left to learn from their own experience, farmers will be slow to realise the full technical potential of a new technology. Drawing on theories of intra-firm diffusion, the hypotheses tested in this paper using data from India are: (1) initial overall farm performances are characterised by modest and widely varying technical and allocative efficiencies, and (2) over time, average efficiencies rise. © 2001 Elsevier Science B.V. All rights reserved.
Keywords: Intra-firm diffusion; Technical efficiency; Allocative efficiency; Economic efficiency; Best practice techniques; Process of adjustment and time-path
1. Introduction
Barker et al. (1985), through the International Rice Research Institute’s Constraints Project, proved that farmers were not following uniformly the best practice techniques while adopting the new rice technology due to technical and/or socio-economic constraints. Thus, they concluded that there were efficiency dif-ferentials among farmers. The gap between the actual and the potential yields was attributed to three factors: profit-seeking behaviour, allocative efficiency and technical efficiency. About 67% of the yield gap were attributed to technical inefficiency of not following the best practice techniques of the technology. A num-ber of cross-sectional studies have demonstrated wide inter-firm variations in technical and allocative
effi-∗Corresponding author. Tel.:+61-26-249-3096;
fax:+61-26-249-3700.
E-mail address: [email protected] (K.P. Kalirajan).
ciencies many years after adoption (Huang and Bagi, 1984; Kalirajan, 1990; Squires and Tabor, 1991). But, there has been no systematic study of how these effi-ciencies change over time. This is surprising in view of the widespread interest in the impact of disequilib-ria caused by the introduction of new technology and in farm reactions to disequilibrium (Schultz, 1975). The literature indicates that the time dimension cannot be easily discarded with respect to farmers’ adjust-ments required to reach the optimum combination of the various components of the new technology after adoption, as Barker et al. (1985) argued with regard to optimum fertiliser use. The interesting question in this context is: what time-path does the adjustment to the best practice techniques of the technology follow? Theories of diffusion provide useful models of firm behaviour to answer the above question (Stoneman, 1983; Silverberg, 1991). Diffusion theories assume that a new technology has been already adopted, but those who have adopted, have not yet used the best
practice techniques fully to achieve the full potential of the technology. These theories then rationalise using psychological or economic principles, the time-path taken by farmers to reach the full potential of the tech-nology. Drawing heavily on the theories of technolog-ical diffusion, an attempt has been made in this paper to answer the above question of what time-path would farmers take to complete the adoption of the best practice techniques of the chosen technology.
It is important here to distinguish between the adop-tion of the constituent inputs in the new technology and the ways in which farmers perform in combin-ing these inputs after adoption. This paper concerns the latter issue. While adoption has led to substan-tial productivity gains (impressive in the aggregate), adoption measures give no satisfactory indication of the level of, and variation in, benefits which are avail-able if firms can realise their technical and allocative potential following the best practice techniques of the new technology. For this, an additional measure is required. Increasingly, the measure of farm-specific efficiency is being employed for such purposes, as in this paper. Thus, following the intra-firm theories of diffusion, the objective of this paper is to examine how do farm-specific efficiencies change over time.
Section 2 briefly reviews the theories of diffusion that are relevant to this paper. Section 3 discusses a conceptual model for this study based on the theories of intra-firm diffusion. Section 4 discusses data and methods of estimation. Section 5 presents results and Section 6 draws conclusions from the study.
2. Theories of diffusion: a brief review
In this paper, a main issue that is examined is what time-path will the farmers follow to reach the poten-tial of the technology. Theories of diffusion offer sev-eral economic models to answer the above question whether the technology studied concerns product or processes. In the latter case of the technology, which is the subject matter of this study, the decision-makers are farmers. Theories of diffusion of new processes assume that farmers have already started using the new technology, but have not yet used the best prac-tice techniques fully to achieve the full potential of the technology. These theories then rationalise, using psychological or economic principles, the time-path
taken by farmers to reach the full potential of the tech-nology. Following Stoneman (1983), these theories can be classified into the following three categories based on their unit of analysis: intra-firm diffusion, inter-firm diffusion, and economy-wide diffusion. To put it in simple terms, the theories of intra-firm diffu-sion can be explained as follows: with the assumption that a farmer has adopted the new technology, he pro-duces output Yit with a particular mix of techniques of the technology in time t. But, if the farmer uses all the best practice techniques of the technology, then he should be producing the full potential of the tech-nology achieving outputYi∗which is greater than Yi. The intra-firm theory of diffusion discusses why then the farmer is not using the best practice techniques of the technology in the first place and what time-path he takes to obtain Yi∗. Thus, theories of intra-firm diffusion provides a suitable modelling framework to examine the main question of this study.
Theories of intra-firm diffusion can be classi-fied into two groups: the psychological approach of Mansfield model (1968) and the Bayesian approach of learning model (Lindner et al., 1979; Stoneman, 1981). Both these models explain how a firm that has already used a new technology, proceeds in a particu-lar time-path until the diffusion of following the best practice techniques of the technology is achieved. Both these models argue that information and uncer-tainty are the two major factors explaining why it is rational for farmers not immediately to follow the best practice techniques of the new technology. The Mansfield model in our case can be written using our notation as follows:
uit=
Yit+1−Yit
Yi∗−Yit
where uit is the ratio of the best practice technique used actually to the full set of best practice techniques of the new technology,Yi∗the potential output of the technology that can be achieved by following the best practice techniques of the technology, and Yit is the output actually obtained by the ith farmer in time t. Mansfield then argues that uit is determined by the following factors:
uit=f (πi, rit, si)
technology, rit the risk involved in making such a change, si refers to farm-specific characteristics such as size of the farm which are assumed to be constant over time. Mansfield justified including these variables as determinant of uit by arguing that “there would ex-ist an important economic analogue to the classic psy-chological laws relating reaction time to the intensity of stimulus” (Mansfield, 1968, p. 190). Then the pre-diction of the model is as follows (Stoneman, 1983):
1. The diffusion curve will be sigmoid which will be the logistic curve in shape.
2. The level of use of the best practice technique of the technology in time t by the ith farmer will be positively influenced by πi and farm-specific characteristics.
3. The speed of diffusion is a linear function ofπiand farm-specific characteristics and will vary across farms.
What is appealing in Mansfield’s model is the technique choice aspects of his model that are more relevant to the analysis in this paper. The decision on choice of technique depends on risk and profitability. However, risk is more concerned with the uncertainty attached to the profitability of following all the best practice techniques of the technology. The contra-diction in this model is that with the reduction in uncertainty (uit) over time, the expected profitability (πi) does not change over time. As the farmer learns more about the best practice techniques of the tech-nology, he would reduce his perception of risk, which in turn should influence him to revise his expected profitability. Bayesian approach, which overcomes this limitation, provides an alternative to Mansfield model. Bayesian models of particular relevance to this study are models by Lindner et al. (1979) and Stoneman (1981).
Both these research works discuss a model of dif-fusion in which farmers learn in a Bayesian way from their experiences. The basic principles of the models can be explained as follows: at any particular point in time, a farmer has an anticipation of what profits and risks are involved in adopting all the best practice tech-niques of the technology. Mostly being risk-averse, the farmer chooses a particular mix of techniques of the technology which will maximise his profits (πi). This profit (πi), though maximum at this particular point in time, will not be the optimum (π*) that the
farmer will receive when all the best practice tech-niques are adopted. While using this particular mix of techniques, the farmer learns through experience, which will influence his perception of expected prof-its, and risks involved in the adoption of all the best practice techniques of the technology. In other words, he will revise his mean expected profits upwardly and risks involved downwardly. This in turn will lead to a change in the mix of techniques moving closer to the best practice techniques of the technology. The time taken to gain experience and to change the mix of techniques depends on farmer-specific characteristics such as education. As time proceeds, the farmer will understand the profits and risks of achieving the full potential of the technology and will then establish his post-diffusion use of the techniques, which will be the best practice techniques of the technology. Thus, the Bayesian model of learning, unlike the Mansfield model, is based on rational maximising be-haviour. Though there are some similarities between the Mansfield model and the Bayesian model, partic-ularly about the assumption that the choice of the mix of techniques is determined endogenously, the latter model is based on economic theory such as choice theory rather than relying on psychological laws.
Following the Lindner et al. (1979) and Stoneman (1981) models, the choice of a mix of techniques of the technology and its convergence to the best practice techniques over time can be represented empirically by the ratio of actually realised output (Yit) at a particu-lar point in time to the maximum possible output (Yi∗) that is feasible with the best practice techniques of the technology. The ratio of actual to maximum possible output is called technical efficiency in the literature (Aigner et al., 1977; Meeusen and van den Broeck, 1977). At the convergence, the ratio will be equal to 1 and this will indicate the post-diffusion level and use of the technology. By observing the farmers’ produc-tion behaviour and calculating the measures of tech-nical and allocative efficiencies over time, this paper attempts to empirically trace the time-path followed by farmers to reach the full potential of the technology.
3. Conceptual model
they may both increase. This might logically be ex-pected with the introduction of a new technology that raises physical productivity as farms adopt it. Second, technical efficiency could decline over time, again in-fluencing allocative in the same direction. The third possibility is that the two efficiencies could fluctuate over time without discernible trend. This could occur in situations in which technology is static or stagnant, where input/output relations are not stable over time and firms have to make educated guesses as to the best set of technical practices to apply and the most appro-priate decisions as to input levels. This may happen in agriculture where climatic variation is pronounced and risk parameters cannot be calculated, e.g. under marginal rainfed conditions.
Following the intra-firm theories of diffusion, it is rational to argue that as farms become more familiar with the technology over time, they are progressively able to improve their decision-making efficiency, and should also be capable of making increasingly accu-rate allocative decisions, as both production and mar-ket risks are reduced. Therefore, our first hypothesis is that mean levels of both technical and allocative efficiencies increase over time, though they may be at lower levels in the beginning of the time period. This raises the important question of the time pattern of in-creases in the two efficiencies, which is central to this study.
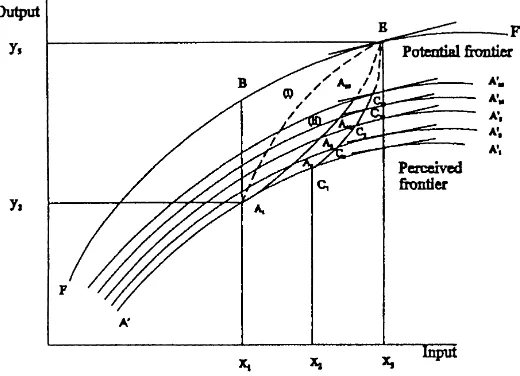
Fig. 1. Time paths of farm-specific efficiency with constant technology.
As the Mansfield’s model, Stoneman’s model and the Lindner, Fischer and Pardy’s model emphasise on the influence of risk on decision making, our sec-ond hypothesis is that technical and allocative, and thus, economic efficiencies will vary inversely with the degree of risk that farmers face. In this paper, two different production environments are consid-ered. Random samples of farmers were chosen from irrigated and non-irrigated conditions, respectively, to represent different degrees of risk.
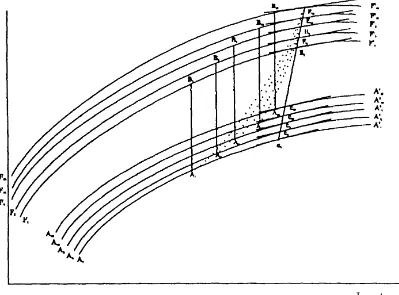
Fig. 2. Paths of efficiency with changing technical and allocative efficiencies with technological change over time.
programmes to identify best technical practices, when, as discussed in the Bayesian learning models, farm-ers are left to discover these in a learning-by-doing process and/or through interaction between farmers in this process. In practice, this latter situation has been the norm in agriculture, and for this study, it has led to our third hypothesis which is that the time path will be the second one, i.e. (ii) in Fig. 1.
As discussed by Silverberg (1991), technologies develop considerably during the diffusion process. Following Atkinson and Stiglitz (1969), it may be argued that a major component of the technological change emanates from learning on existing technolo-gies. One obvious reason is learning by doing and learning by using, on the part of researchers and farmers, respectively (Rosenberg, 1982). Thus, in the present study, the possibility of technological change occurring over the time period in which technical
efficiency is being measured cannot be ruled out. In such a case, technical efficiency is being measured against a moving technical frontier (see Fig. 2). Over time a farmer may shift from points A1 on A1A′1 to A20A20′ , while his true frontier may also be shift-ing from F1F1′ to F20F′20, and with it, the optimum point of economic efficiency from E1 to E20. Such situations would require different interpretations of efficiency improvement, and require decomposition of the changes due to the shifts in the farm’s efficiency and those due to technological change.
4. Data and estimation
and non-irrigated paddy farms from North Arcot dis-trict, India, were used. Within the region, farms with reasonably homogeneous land and equipment were sampled. The data covers the 10-year period from 1973 to 1982, and each year has two seasons of similar crops which give a total number of twenty periods.1 Sample farmers were following the high yielding seed technology which is otherwise called the ‘Green Revolution’ technology. They were cultivating the high yielding variety of paddy, IR20, since 1970. In each crop period, longitudinal data from 25 irrigated and 25 non-irrigated farmers were selected for the survey.
The following farm-specific stochastic Cobb-Douglas production frontier was separately estimated for each crop season:2
lnyit=α0+
X
αjtlnxijt+β1tlnx4t+uit+νit,
i=1,2, . . . , n (observations),
t=1,2, . . . , T (periods) (1)
where y is the observed paddy output in kg, x1 the pre-harvest labour in man-days, x2 the fertiliser in kg, x3 animal power pair-days, x4 the area operated in acres, multiplied by a soil fertility index. This is considered here as a fixed input, eu the firm-specific technical efficiency defined above, u the non-positive random variable representing the combined effects of farm-specific characteristics that influence technical efficiency andνis a statistical random variable.
It is assumed that u follows a truncated normal distribution with meanµand varianceσu2 andν fol-lows a normal distributionN (0, σν2). The maximum likelihood methods of estimation is used to obtain estimates of the parameters of the maximum possible
1Published data on later years are at aggregated level and firm-level data on inputs and outputs are not available. Permission from the Ministry of Agriculture to obtain firm-level data from the Tamil Nadu Agricultural University could not be obtained.
2Alternative functional forms such as translog and quadratic were tried, but because of high R¯2 values and the number of significant variables, the Cobb–Douglas form was preferred for further analysis. In addition, in the translog form, all null hypothe-ses of linear and non-linear separabilities could not be rejected at the 5% level. Apparently, complete global separability could not be rejected. Thus, the Cobb–Douglas function can be considered as an appropriate model describing the technology for the given data set.
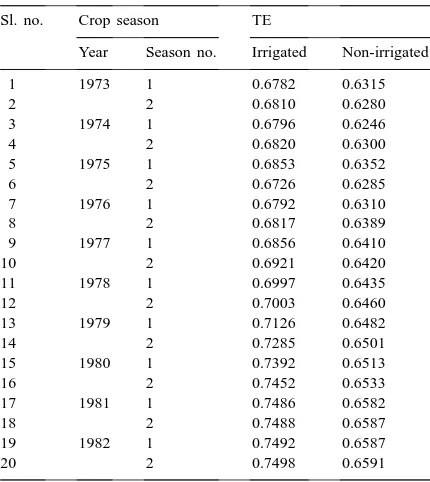
Table 1
Calculated mean technical efficiencies of sample farmers from North Arcot, Tamil Nadu, 1973–1982
Sl. no. Crop season TE
Year Season no. Irrigated Non-irrigated
1 1973 1 0.6782 0.6315
2 2 0.6810 0.6280
3 1974 1 0.6796 0.6246
4 2 0.6820 0.6300
5 1975 1 0.6853 0.6352
6 2 0.6726 0.6285
7 1976 1 0.6792 0.6310
8 2 0.6817 0.6389
9 1977 1 0.6856 0.6410
10 2 0.6921 0.6420
11 1978 1 0.6997 0.6435
12 2 0.7003 0.6460
13 1979 1 0.7126 0.6482
14 2 0.7285 0.6501
15 1980 1 0.7392 0.6513
16 2 0.7452 0.6533
17 1981 1 0.7486 0.6582
18 2 0.7488 0.6587
19 1982 1 0.7492 0.6587
20 2 0.7498 0.6591
output frontier of Eq. (1) and mean technical effi-ciencies (Kalirajan and Shand, 1994).3 The mean technical efficiency for each crop period is calculated as follows (Table 1): tribution function evaluated at the point given in the brackets.
Allocative efficiency for the output of each farmer for each crop season is derived first by simultaneously solving the firm-specific observed production function and the marginal productivity conditions yielding the optimum output and variable inputs, and second, by calculating the ratio of observed profit to the optimum
3 The mean parameter estimates of the frontier production func-tion for the sample participants in the irrigated and non-irrigated environments, respectively, are: (1) ln(paddy)=3.1628+0.2432 ln(labor)+0.1712 ln(fertiliser)+ln 0.0804 ln(animal power)+
maximum profit: andβ1are MLE estimates of Eq. (1). The calculated optimal output (y∗∗), along with the concerned opti-mal inputs x1∗, x2∗, x3∗, and their relevant prices are used to work out the maximum profit. The ratio of the observed to the above optimum profit for each observation is calculated for each crop season. A simple average of these ratios for each crop season is worked out which then serves as a measure of allocative efficiency for that particular crop season (Table 2).
Now, economic efficiency is calculated. First, the following equations representing the frontier produc-tion funcproduc-tion and the marginal productivity condiproduc-tions are simultaneously solved:
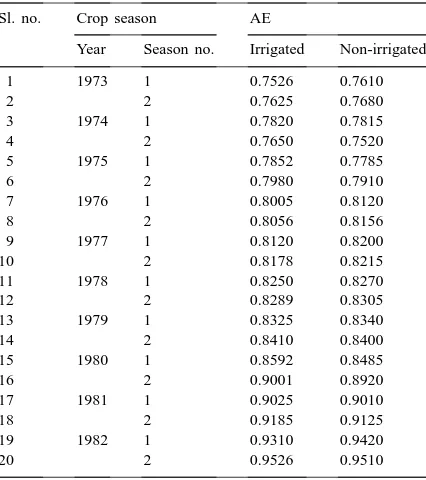
Table 2
Calculated mean allocative efficiencies of sample farmers from North Arcot, Tamil Nadu, 1973–1982
Sl. no. Crop season AE
Year Season no. Irrigated Non-irrigated
1 1973 1 0.7526 0.7610
2 2 0.7625 0.7680
3 1974 1 0.7820 0.7815
4 2 0.7650 0.7520
5 1975 1 0.7852 0.7785
6 2 0.7980 0.7910
7 1976 1 0.8005 0.8120
8 2 0.8056 0.8156
9 1977 1 0.8120 0.8200
10 2 0.8178 0.8215
11 1978 1 0.8250 0.8270
12 2 0.8289 0.8305
13 1979 1 0.8325 0.8340
14 2 0.8410 0.8400
15 1980 1 0.8592 0.8485
16 2 0.9001 0.8920
17 1981 1 0.9025 0.9010
18 2 0.9185 0.9125
19 1982 1 0.9310 0.9420
20 2 0.9526 0.9510
Table 3
Calculated mean economic efficiencies of sample farmers from North Arcot, Tamil Nadu, 1973–1982
Sl. no. Crop season EE
Year Season no. Irrigated Non-irrigated
1 1973 1 0.5008 0.4703
2 2 0.5072 0.4736
3 1974 1 0.5206 0.4792
4 2 0.5162 0.4636
5 1975 1 0.5216 0.4812
6 2 0.5269 0.4896
7 1976 1 0.5381 0.5013
8 2 0.5402 0.5185
9 1977 1 0.5486 0.5204
10 2 0.5530 0.5296
11 1978 1 0.5623 0.5318
12 2 0.5765 0.5386
13 1979 1 0.5828 0.5397
14 2 0.6010 0.5401
15 1980 1 0.6125 0.5462
16 2 0.6532 0.5737
17 1981 1 0.6612 0.5816
18 2 0.6785 0.5936
19 1982 1 0.6818 0.6182
20 2 0.6987 0.6206
These equations are similar to those in System (2). The only difference is that in the first equation in System (3), u=0, which implies that it represents the potential of the technology and not the actually realised pro-duction function as in Eq. (2). The solution to Eq. (3) gives the optimal output and inputs evaluated at the frontier using the price information. Then the optimal net returns or profit is calculated. Finally, the ratio of the realised profit to the above optimal profit evalu-ated at the frontier is calculevalu-ated to provide a measure of economic efficiency (Table 3).
5. Results
(Battese and Coelli, 1988). If the random variable
u is absent from the model, then the ordinary least
squares estimates of the remaining parameters of Eq. (1) are maximum likelihood estimates. Therefore, the negative of twice the logarithm of the generalised likelihood ratio has approximately χ2 distribution with parameter equal to 2. If the calculated ratio worked out to be greater than the tabulated value, then the null hypothesis is rejected. The calculated ratio worked out to be 12.76, which is significant at the 1% level. This implies that the model without the observation-specific technical efficiency related variable u cannot explain significantly the variations of outputs from the maximum possible levels.
Mean technical efficiencies shown in Table 1 in-dicate an increasing trend over time for the irrigated sample. From an initial sample average of around 68%, technical efficiency increased season by season with few fluctuations, but slowly over the whole 9-year period from 1973 to 1982 to around 75%, giving a 7% point rise over the period. In the non-irrigated sample, the increase over the 9 years was even slower, from 63 to 66%, or only 3% points for the period. The difference may well reflect the greater production risks in the absence of irrigation, and therefore, the greater difficulties for farmers in selecting optimum technical practices. However, the fact that both sam-ples improved in technical efficiency, albeit at slow rates, is a significant finding and suggests that there was a learning process as predicted by theories of intra-firm diffusion.
Mean allocative efficiencies in both environments showed more impressive gains over the same period (Table 2). Under irrigated conditions, sample farmers raised mean allocative efficiency from an initial 75 to 95%, an increase of 20% points over the 9 years from 1973. The performance under non-irrigated con-ditions was no less impressive. The initial mean, at 76%, matched that of the irrigated farmers and the gain of 19% points over the 9 years was also almost identical with the gain under irrigation. As with tech-nical efficiencies, the increases were achieved as the production frontiers were shifting outward over time. Mean economic efficiencies for both farm samples show the combined influence of the two component efficiencies (Table 3). Both samples showed low initial accomplishments. The improvement was quite rapid for both. The difference of 8% points between the two
samples in the final year of study reflected the margin between them in level of technical efficiency at the time, as it did throughout the period.
The above results offer a number of important in-sights into performance over time with the new tech-nology. First, they provide support for the intra-firm diffusion theories that in the early years after adop-tion of the new technology, performance, measured in terms of technical and allocative efficiencies is not high. Interestingly, it was higher for allocative than for technical efficiency. This could indicate that all North Arcot farmers faced a low level of market risk that enabled them to judge their allocative decisions more accurately than their technical decisions at that time. Or it could mean that farmers have used the technology on their perceived production functions long enough to be able to judge allocative decisions relatively accurately. Second, the improvements in technical and allocative efficiencies over the period of our study support our second hypothesis and sug-gest that a Bayesian learning-by-doing process was at work. Third and again as hypothesised, efficiencies were initially, and remained at, higher levels for irri-gated than for non-irriirri-gated farmers. This is consistent with a priori expectation based on the intra-firm dif-fusion theories that decision-making is more difficult under non-irrigated conditions because of the latter’s higher level of risk and uncertainty.
Fourth, the fact that allocative efficiency rose faster than technical efficiency over time suggests that, at least in this case study, the patterns of increasing eco-nomic efficiency follow the second time path discussed earlier, and therefore, support our fourth hypothesis.
farmers than that of achieving allocative efficiency on perceived production functions as they shift upwards over time with gradual improvements in technical efficiency. Notably, the time paths are similar for the irrigated and non-irrigated samples.
6. Conclusions
One conclusion is that the process of adjustment in performance over time is much more complex than is hypothesised by Ruttan (1977). Our study provides empirical support to theories of intra-firm diffusion which rationalise the process of adjustment in per-formance over time. Our results show that, even with more than a decade of experience with the new tech-nology, average farm performance measured in terms of technical and allocative efficiencies in 1982 was still not high. Quite clearly, performance does not depend simply upon the universality of adoption of technology as postulated by Ruttan (1977). The asser-tion of Barker et al. (1985, p. 263) that “after fertiliser has been used for some time, and assuming enough is available to meet market demand, farmers arrive at their own economic equilibrium levels”, may have some relevance to our findings that farmers’ capac-ity to make allocative decisions improves over time, but it does not account for the continuing variations between farmers in technical efficiency.
This study suggests that, in the achievement of high levels of performance over time, the allocative efficiency component is not a long run constraint. The principal difficulty appears to lie in raising tech-nical efficiency to high levels. This had still not been achieved in our samples after some 15 years of ex-perience with the new technology. This pattern is all the more unexpected in the irrigated area where at least broad recommendations as to best technical practices have been well researched and apparently firmly established for many years.
There are major drawbacks for farmers who are on time path (ii) like the sample farmers. The principal difficulty in the long run lies in the slow rate of increase in technical efficiency. Although some progress can be expected, as in this study, technical efficiency will be persistent, and thus, emerges as the most serious con-straint on economic performances over time. It implies that, left to learn from their own experience, farmers
will be slow to realise the full potential of a new tech-nology. This is reinforced by the finding that, once high levels of allocative efficiency have been achieved (as in this study), further improvements in economic efficiency depend almost exclusively on the achieve-ment of higher technical efficiency. This indicates that there is a growing urgency for sustained improve-ments in performance which require a more active role for the public sector and international agencies in research and extension activities in collaboration with farmers to raise technical efficiency significantly over time.
The slow rate of increase in technical efficiency in the two samples over time suggests that the constraint on technical efficiency has been lack of information about the best practice techniques of the technology. In the absence of this information, the shift in farmers’ perceived frontiers toward the true potential frontier is slow, consistent with a learning-by-doing process. In this situation, farmers can gain close to full knowl-edge of their perceived production functions and of market conditions, and so are able to achieve higher levels of allocative efficiency at a relatively rapid rate. But, in the long run, improvements in techni-cal efficiency are needed to sustain improvements in economic performance.
A final conclusion is that the pattern of performance found in this study clearly demonstrates the extent to which private and social returns from new technology may be restricted over time by inefficient performance. This has important implication for projections of returns from projects, which include new technology.
Acknowledgements
The authors gratefully acknowledge the comments and suggestions given by an anonymous referee of this Journal and Professor Stanley Johnson which helped improving the presentation of the paper.
References
Aigner, D.J., Lovell, C.A.K., Schmidt, P., 1977. Formulation and estimation of stochastic frontier production function models. J. Econ. 6, 1–37.
Atkinson, A., Stiglitz, J., 1969. A new view of technological change. Econ. J. 78, 573–578.
Barker, R., Herdt, R.W., Rose, B., 1985. The Rice Economy of Asia, Resources for the Future in Cooperation. International Rice Research Institute, Washington, DC.
Battese, G.E., Coelli, T.J., 1988. Prediction of firm-level technical efficiencies with a generalised frontier function and panel data. J. Econ. 38, 387–399.
Huang, C.J., Bagi, F.S., 1984. Technical efficiency on individual farms in northwest India. Southern Econ. J. 51, 108– 115.
Kalirajan, K.P., 1990. Rice Production: An Econometric Analysis. Oxford & IBH, New Delhi.
Kalirajan, K.P., Shand, R.T., 1994. Economics in Disequilibrium: An Approach from the Frontier. Macmillan, New Delhi. Lindner, R., Fischer, A., Pardy, P., 1979. The time to adoption.
Econ. Lett. 2, 187–190.
Mansfield, E., 1968. Industrial Research and Technological Innovation. W.W. Norton, New York.
Meeusen, W., van den Broeck, J., 1977. Efficiency estimation from Cobb Douglas production functions with composed error. Int. Econ. Rev. 18, 435–444.
Rosenberg, N., 1982. Inside the Black Box: Technology and Economics. Cambridge University Press, Cambridge, MA. Ruttan, V.W., 1977. The Green Revolution: seven generalisations.
Int. Dev. Rev. 19, 16–23.
Schultz, T.W., 1975. The value of the ability to deal with disequilibria. J. Econ. Lit. 13, 827–846.
Silverberg, G., 1991. Adoption and diffusion of technology as a collective evolutionary process. In: Nakicenovic, N., Grubler, A. (Eds.), Diffusion of Technologies and Social Behaviour. Springer, Berlin, pp. 209–230.
Squires, D., Tabor, S., 1991. Technical efficiency and future produ-ction gains in Indonesian agriculture. Dev. Econ. 24, 258–270. Stoneman, P., 1981. Intra-firm diffusion, Bayesian learning and
profitability. Econ. J. 91, 375–388.