Water quality implications of nitrate leaching from intensively grazed
pasture swards in the northeast US
W.L. Stout
a,∗, S.L. Fales
b, L.D. Muller
b, R.R. Schnabel
a, S.R. Weaver
aaPasture Systems and Watershed Management Research Laboratory, United States Department of Agriculture/Agricultural Research Service,
Curtin Road, University Park, PA 16802-3702, USA
bDepartment of Agronomy and Department of Dairy and Animal Science, The Pennsylvania State University, University Park, PA, 16802, USA
Received 11 August 1998; received in revised form 7 April 1999; accepted 17 June 1999
Abstract
High density animal production systems, such as management intensive grazing (MIG), can have a negative effect on water quality. Learning to manage such systems to minimize water quality impacts is essential for the environmental and economic sustainability of these types of animal production systems. Management intensive grazing is a grazing system in which animals at a high stocking density are rotated through several paddocks at short time intervals (12–24 h) so that animal performance is maximized. Although MIG has the potential to increase dairy farm profitability in the northeast US, recent work in this region has shown that a substantial amount of N applied as fertilizer is leached below the root zone of orchardgrass (Dactyls glomerataL., (cv.) ‘Pennlate’) managed as an intensive pasture. How much N is leached from other forage species managed as intensive pasture under the climatic conditions of the northeast US is not known. A field study was conducted using large drainage lysimeters to measure NO3–N leaching loss from six pasture swards: orchardgrass+N,
orchardgrass+alfalfa (Medicago sativaL., (cv.) Alfagraze), orchardgrass+Ladino type white clover (Trifolium repensL.), Ryegrass (Lolium perreneL, (cv.) Citadel)+N, ryegrass+alfalfa, and ryegrass+white clover. The study site was located in central Pennsylvania on a Hagerstown silt loam soil (fine, mixed, mesic Typic Hapludalf). Nitrate–N leaching losses were most consistent under N fertilized swards where the amount of N could be adjusted for yearly weather conditions. In a drought year, NO3–N leaching increased dramatically in swards containing alfalfa or white clover. Sward type and stocking density
need to be taken into consideration when developing an animal production system that will be both environmentally and economically sustainable. ©2000 Published by Elsevier Science B.V. All rights reserved.
Keywords:Alfalfa; Grazing; Orchardgrass; Ryegrass; Water quality; White clover
1. Introduction
The northeast region of the US contains about 3% of the farmland in the US, but accounts for about 20%
∗Corresponding author. Tel.: +814-863-0947; fax: + 814-863-0935.
E-mail address:[email protected] (W.L. Stout).
of the milk production nationwide, with New York and Pennsylvania being the 4th and 5th dairy produc-ing states in the country. Large portions of these states drain into the Chesapeake Bay and the runoff from agricultural land is a major source of non-point source pollution in the Bay. As a result, the Chesapeake Bay commission has targeted a 40% reduction of N in-put into the Bay by the year 2000 (Chesapeake Bay
Program, 1995). In light of these types of environmen-tal pressures, it is imperative that animal production systems are both environmentally and economically sustainable.
To maintain dairy farm profitability in the face of rising fuel and machinery costs, tighter environmental constraints, and decreasing Federal subsidies, man-agement intensive grazing (MIG) is being promoted for the northeast US (Fales et al., 1993). Management intensive grazing is a grazing system in which ani-mals at a high stocking density are rotated through several paddocks at short time intervals (12–24 h) so that animal performance is maximized. Management intensive grazing systems have been the mainstay of dairy production in the temperate oceanic climatic zones of Europe and New Zealand for many years. While MIG has the potential to increase farm prof-itability in the temperate continental climate of the northeast USA (Emmick and Toomer, 1991; Parker et al., 1992), the high rates of N from fertilizer or biological fixation in these grazing systems and the uneven recycling of this N through urine in pas-tures could increase N leaching and threaten water quality. Several studies in the temperate oceanic cli-mates of the UK, the Netherlands, and New Zealand have shown that intensive grazing of livestock can increase NO3–N leaching relative to mechanical for-age harvesting (Ball et al., 1979; Ryden et al., 1984; Garwood and Ryden, 1986; Steenvoorden et al., 1986). Recent work in the northeastern US has shown that even on areas not impacted by cattle excreta, a substantial amount of NO3–N can leach below the root zone (Stout et al., 1997, 1998) and contribute to groundwater NO3–N concentrations that exceed the 10 mg l−1 drinking water standard (US EPA, 1987).
Since MIG has the potential to increase NO3–N leaching, and MIG use is increasing in the northeast US, baseline data are needed to relate stocking densi-ties, soil properdensi-ties, N fertilization strategies, and for-age species to potential NO3–N leaching. The baseline data for each forage species can then be used in con-junction with animal induced leaching NO3–N loss to project water quality under specific forage types and stocking densities. Thus, the objective of this study was to determine the NO3–N leaching loss from six different forage swards that have potential for use in intensive pastures in the northeast US.
2. Materials and methods
2.1. Study site
The study was conducted in the Ridge and Val-ley physiographic province of central Pennsylvania (USDA, 1981a). The site was at The Pennsylvania State University Dairy Research Center located near State College, PA (40◦48′N. Lat., 77◦52′W. Long., 350 m Elev.). The predominant soil on this site is a Hagerstown silt loam (Chomic Luvisol; Typic Haplu-dalf, fine loamy, mixed, mesic). Hagerstown is a deep, well-drained soil formed in relatively pure limestone residuum. Although the subsoil texture of the Hager-stown series is a clay loam, drainage through the sub-soil is rapid because of a high degree of well-defined blocky structure (Shuford, 1975).
2.2. Lysimeters
The monolith lysimeters and collection system used in this study were constructed using the design devel-oped by Moyer et al. (1996) at the Rodale Research Farm. First, four intact cores were taken from each of the six pasture swards in the MIG study. The cores were taken first by identifying a representative sec-tion of each pasture, next driving a 100 cm long by 60 cm diameter section of schedule 40 steel well cas-ing 90 cm into the soil, and finally retrievcas-ing the core from the soil. 90 cm was assumed to be the bottom of the root zone.
Once the cores were retrieved, a steel bottom was welded to the well casing and the collection system attached to the bottom of each core. Finally, the cores were replaced into the soil adjacent to the MIG study. Steel corral panels protected the cores (now lysime-ters) from being impacted by grazing animals.
No suction was applied to the bottom of the lysime-ters, thus leachate volume may have been lower and denitrification rates may have been higher than un-der an intact soil column. However, monolith lysime-ters of such design generally provide the most effec-tive method of measuring NO3–N leaching from many types of soils (Whitehead, 1995).
2.3. Leachate collection and analysis
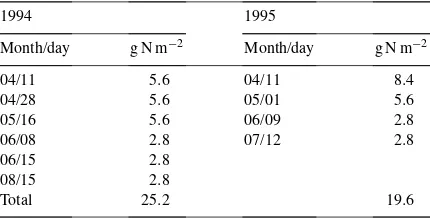
Table 1
Nitrogen fertilization dates and rates for pastures and lysimeters
1994 1995
checked for leachate weekly or after major storm events throughout the year. Leachate volume was recorded, and subsamples were stored under refrig-eration at 4◦C. Samples were filtered with 0.45mm membrane filters using Millipore apparatus, and NO3–N analysis was performed using a Waters ILC/1 ion chromatograph using Altech 269-013 column with a phthalic acid mobile phase (USEPA, 1979, 1987). The analysis was performed as soon as possible after sampling, but in any case, delayed by no more than 30 days. Nitrate-N concentrations in the leachate are weighted by leachate volume.
2.4. Pasture systems
The pasture swards and fertilization dates and rates used in this study were the same as in an ongoing MIG study on this site. The pasture swards in this study consisted of orchardgrass (O) or ryegrass (R) combined with alfalfa (+A) or Ladino white clover (+WC), or receiving N fertilization (+N). During the data collection period of this study, N application rates (Table 1) on the O+N and R+N treatments in the MIG study pastures were 19.6 and 25.20 g m−2(196 and 252 kg ha−1) as ammonium nitrate. Nitrogen ap-plication rates were adjusted for the difference in pre-cipitation between the 2 years of this study (Table 2). Herbage harvest in the lysimeters was implemented to emulate the grazing schedule of the MIG study. The paddocks in the MIG study were managed by turning the animals onto the pasture when the sward height was approximately 30 cm and removing them when the sward height was reduced to 7.5 cm. The lysimeters were harvested by clipping all herbage above 7.5 cm with electric grass shears at the same time that the paddocks were grazed. Cutting dates were 28 April
16 May, 6 June, 6 July, 15 August, 20 September, and 31 October in 1994; and 19 May, 9 June, 12 July, 24 August, and 31 October, 1995.
Air temperature, precipitation, radiation, relative humidity, and wind velocity were measured on-site using automated weather stations at both the sites. The Pennsylvania State University Meteorology De-partment also measured weather data 2 km from the State College site.
2.5. Statistics
The experiment was analyzed using the GLM pro-cedure in SAS (1992), and pasture sward means were separated using the Duncans option in the ‘MEANS’ statement within the GLM procedure. The use of the word ‘significant’ throughout the text indicates p<0.05.
3. Results and discussion
3.1. Precipitation and temperature
Annual weather (Table 2) and NO3–N leaching data (Table 3 and Fig. 1) are presented in an April–March time-frame for two reasons. First, vigorous grass growth, N fertilization, and the grazing season all begin in April. Second, March is the month in which the annual peak leaching ends (Stout et. al., 1997). Thus April can be considered the start of both the grazing and hydrologic years.
Table 2
Summary of State College, PA, weather from April 1994 to March 1996
Date Year(s) Average temperature (◦C) Total precipitation (mm)
April–June 1994 14.8 253
July–September 1994 19.2 367
October–December 1994 6.1 213
January–March 1995 −0.2 160
April–March 1994–1995 10.0 993
April–June 1995 13.8 238
July–September 1995 20.4 124
October–December 1995 3.7 316
January–March 1996 −2.3 318
April–March 1995–1996 8.9 996
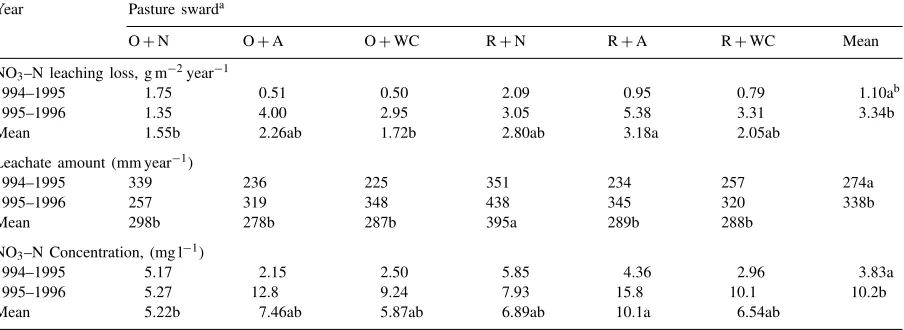
Table 3
Means of leachate amount and NO3–N leaching loss and concentrations from pasture swards grown on drainage lysimeters at State College, PA, for 2 years
Year Pasture swarda
O+N O+A O+WC R+N R+A R+WC Mean
NO3–N leaching loss, g m−2year−1
1994–1995 1.75 0.51 0.50 2.09 0.95 0.79 1.10ab
1995–1996 1.35 4.00 2.95 3.05 5.38 3.31 3.34b
Mean 1.55b 2.26ab 1.72b 2.80ab 3.18a 2.05ab
Leachate amount (mm year−1)
1994–1995 339 236 225 351 234 257 274a
1995–1996 257 319 348 438 345 320 338b
Mean 298b 278b 287b 395a 289b 288b
NO3–N Concentration, (mg l−1)
1994–1995 5.17 2.15 2.50 5.85 4.36 2.96 3.83a
1995–1996 5.27 12.8 9.24 7.93 15.8 10.1 10.2b
Mean 5.22b 7.46ab 5.87ab 6.89ab 10.1a 6.54ab
aPasture sward: O, orchardgrass; A, alfalfa; R, ryegrass; WC, white clover; N, nitrogen.
bMeans in the same row or column followed by the same letter are not significantly different (p> 0.05).
3.2. Nitrate leaching losses
There was a significant interaction between year and pasture sward for NO3−N leaching loss (Table 3). This interaction was caused by the NO3−N leaching losses from the O+N and R+N treatments being relatively constant over both years while the NO3–N leaching losses from the other treatments increased dramatically during the second year of the study.
The relatively constant NO3–N leaching losses from the O+N and R+N lysimeters over the two years of the study were due to the combined effects of precip-itation, N fertilization, and herbage production. In the
Table 4
Means of herbage yield and N concentration and accumulation from six pasture swards grown on drainage lysimeters at State College, PA, for two years
Year Pasture swarda
O+N O+A O+WC R+N R+A R+WC Mean
Herbage yield (g m−2year−1)
1994 1163 869 794 869 857 773 887ab
1995 929 749 737 751 658 581 734b
Mean 1046a 809b 766bc 810b 758bc 677c
Herbage N concentration (g kg−1)
1994 32.0 34.0 31.9 38.3 34.5 32.8 33.9a
1995 31.5 29.5 32.2 33.8 34.0 33.7 32.4a
Mean 31.8b 32.1b 32.0b 36.5a 34.3ab 33.1ab
Herbage N Accumulation (g m−2year−1)
1994 36.1 25.6 24.3 32.2 26.8 23.9 28.1a
1995 22.8 18.7 20.5 23.5 19.6 17.7 20.5b
Mean 29.4a 22.2b 22.4b 27.8a 23.2b 20.8b
aPasture sward: O, orchardgrass; A, alfalfa; R, ryegrass; WC, white clover; N, nitrogen.
bMeans in the same row or column followed by the same letter are not significantly differents (p> 0.05).
Fig. 1. Nitrate-N levels (mean±standard error) in leachate beneath six pasture swards grown on drainage lysimeters at State College, PA, from April 1994 to March 1996.
(Table 4). The reduced N accumulation was the result of reduced herbage yields rather than any change in herbage N concentration (Table 4).
The total reduction in herbage N accumulation from 1994 to 1995 by the O+N and R+N swards was 13.3 and 10.7 g m−2year−1, respectively. These reductions were about twice the aforementioned reduction in fer-tilizer N (5.6 g m−2) from 1994 to 1995. This relation-ship between herbage N accumulation and fertilizer N application is similar to the results reported earlier for orchardgrass (Stout and Jung, 1992) and ryegrass (Stout and Schnabel, 1994). In these studies using15N labeled fertilizer, fertilizer N accounted for about half of the total herbage N accumulation over the growing season.
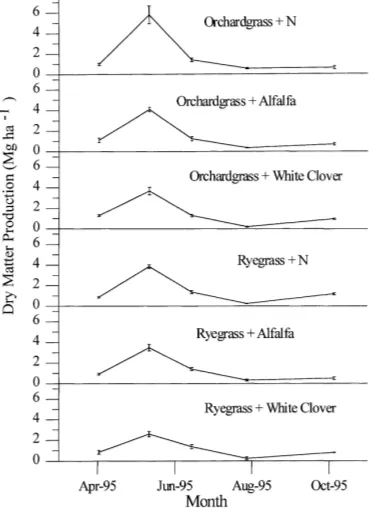
Fig. 2. Dry matter production (mean±standard error) of six pasture swards grown on drainage lysimeters at State College, PA, from April to October 1994.
and grazing schedule between 1994 and 1995. In 1995, the temperature between April and June was cooler (Table 2) and there was one less grazing dur-ing this time period than in 1994 (Figs. 1 and 2). This would result in more N being accumulated in the belowground herbage mass during this time period in 1995 than in 1994. While not directly measured, be-lowground herbage mass production in 1994 and 1995 would parallel the measured aboveground herbage mass (Figs. 2 and 3). In April–June, 1995, the above-ground herbage mass of the grass-legume swards was about 67% greater than for the same period in 1994. Consequently, the following drought caused much more N to be released from dying roots and nodules in 1995 than in 1994. The drought-weakened stands would not be able to fully utilize this released N when moisture returned later in the growing season. This is most apparent in the R+A sward because ryegrass is less tolerant to drought than orchardgrass, and alfalfa would fix more N than white clover.
There was a significant year by pasture sward in-teraction for NO3–N concentration in the leachate
Fig. 3. Dry matter production (means±standard error) of six pasture swards grown on drainage lysimeters at State College, PA, from April to October 1995.
During the year of normal rainfall, 1994–1995, NO3–N mean baseline concentrations in the leachate beneath the different pasture swards (Table 3) were similar to that measured in a nearby agricultural wa-tershed which was 97% cropland and 3% forested (Pionke et al., 1996). The flow weighted mean NO3–N concentration in the outflow from this watershed was 5.14 mg l−1. However in the dry year, 1995–1996, NO3−N concentration in leachate beneath all but O+N sward exceeded this concentration. This was especially true in alfalfa containing swards where leachate concentrations exceeded the 10 mg l−1 US. EPA drinking water standard. Add to these base levels the projected increase in leachate NO3–N con-centration contributed by grazing animals (Stout et al., 1996), and it becomes apparent in the following two examples that NO3–N concentrations in leachate beneath intensively grazed pastures in the temperate continental climate of the northeast US can exceed drinking water standards.
A dairy cow, on the average, will annually excrete 75 kg in urine and 25 kg in feces (Whitehead, 1995). In the northeast US, about 2% of the N in feces and 25% of the N in urine leaches beneath the root zone (Stout et al., 1997). A 500 kg dairy cow will consume about 15 kg day−1 or about 2700 kg in the 180-day grazing season common to the northeastern US. Dry matter production on the sward that leached the least NO3–N, O+N, was 1046 g m−1year−1 or 10460 kg ha−1year−1 (Tables 3 and 4). Seventy per-cent utilization of this sward (7332 kg) would support a stocking density 2.71 cows ha−1(7332/2700) for a 180-day grazing season. At this stocking density for a half of a year, there would be 102 and 34 kg ha−1 on N excreted in urine and feces, respectively. Of these excreted amounts, 25.5 and 0.70 kg ha−1would be expected to leach below the root zone (Stout et al., 1997). If the sum of these amounts 26.2 kg ha−1 (2.62 g m−2) were added to the baseline leaching from the O+N sward (1.55 g m−2, Table 3), the total leach-ing loss would be 4.17 g m−2. This would result in a leachate NO3–N concentration of about 14.0 mg l−1, a concentration well above the 10 mg l−1 drinking water standard. A similar example using the O+WC data from the non-drought year (1994–1995, Tables 3 and 4) would yield a leachate NO3–N concentra-tion of about 11.9 mg l−1, a concentration marginally above the 10 mg l−1standard.
Of the two proceeding examples, the first sward (O+N) had the higher leachate NO3–N concentra-tion but also supported the higher animal numbers (i.e. higher cash flow potential). The second sward, O+WC, had leachate NO3–N approaching the wa-ter quality standard, but supported fewer animals (i.e. lower cash flow potential). However, cash flow does not necessarily equate to profitability. Because of lower fertilizer costs, a grazing system utilizing the O+WC sward may be more profitable while approaching water quality standards. Furthermore, how the proceeding examples affect the mean outflow NO3–N concentration from a given watershed will be dependant on the amount of intensive grazing relative to other land uses on the watershed. Thus the chal-lenge for researchers is to develop profitable animal production systems that meet water quality standards within the context of the whole farm or watershed.
4. Conclusions
Catastrophic changes in weather patterns, such as drought, can have a major effect on the NO3–N concentration and leaching beneath different pasture swards. In the case where N is supplied by legume fixation, NO3–N concentrations in the leachate dur-ing a drought year ranged from 9.2 to 15.8 mg l−1 even though no cattle excreta was added. With cattle feces and urine added, the NO3–N losses would be expected to be considerably higher (Stout et al., 1997, 1998). Nitrate in leachate collected from beneath N fertilized grass was much less (5.3–7.9 mg l−1), even in the drought year. A major reason for this differ-ence is that fertilizer N application can be varied in response to weather, whereas the N supplied by legume decomposition caused by drought is much less controllable using available technology.
The sward factors that appear to affect water qual-ity were grass and legume species. In every compa-rable combination, the sward containing orchardgrass appeared to leach less NO3–N and exhibit lower con-centrations than did the swards containing ryegrass. Also, white clover was superior to alfalfa on control-ling NO3 leaching losses, especially in the drought year. Thus, incorporating the grass and legume with the best adaptation to environmental and management stresses of a given area into a grazing system may be the best means of minimizing the effect of MIG on NO3–N leaching while maintaining farm profitability.
References
Ball, R., Keeney, D.R., Theobald, P.W., Nes, P., 1979. Nitrogen balance in urine-affected areas of a New Zealand pasture. Agron. J. 71, 309–314.
Chesapeake Bay Program, 1995. The State of the Chesapeake Bay, 1995. US Gov. Print. Office, Washington, DC
Emmick, D.L., Toomer, L.F., 1991. The economic impact of intensive grazing management on fifteen dairy farms in New York state. In: Proc. Am. Forage Grassl. Counc., Georgetown, TX, p. 19.
Fales, S.L., McMurry, S.A., McSweeny, W.T., 1993. The role of pasture in northeastern dairy farming: historical perspectives, trends, and research imperatives for the future. In: Agricultural Research in the Northeastern United States: Critical Review and Perspective. Am. Soc. Agron., Madison WI, pp. 111–131. Garwood, E.A., Ryden, J.C., 1986. Nitrate loss through leaching and surface runoff from grassland: Effects of water supply, soil type, and management. In: van der Meer, H.G., Ryden, J.C., Ennik, G.C. (Eds.), Nitrogen fluxes in intensive grassland systems. Martinus Nijoff, Dordrecht, The Netherlands, pp. 90−113.
Moyer, J.W., Saporito, L.S., Janke, R.J., 1996. Design, construction, and installation of intact soil core lysimeter. Agron. J. 88, 253–256.
Parker, W.J., Muller, L.D., Buckmaster, D.R., 1992. Management and economic implications of intensive grazing on dairy farms in the northeastern states. J. Dairy Sci. 75, 2587–2597. Pionke, H.B., Gburek, W.J., Sharpley, A.N., Schnabel, R.R., 1996.
Flow and nutrient export patterns for an agricultural hill-land watershed. Water Resou. Res. 32, 1795–1804.
Ryden, J.C., Ball, P.R., Garwood, E.A., 1984. Nitrate leaching from grassland. Nature 311, 50–53.
SAS, 1992. SAS/STAT Software: Changes and Enhancements, Releas 6.07, SAS Technical Report. SAS Institute, Cary, NC, p. 229.
Shuford, J.W., 1975. Nitrate-nitrogen movement and distribution within a soil profile. Ph.D. Dissertation, University Microfilms 76-10787, The Pennsylvania State University, University Park, PA.
Steenvoorden, J., Fonck, H., Oosterom, H.P., 1986. Losses of nitrogen from intensive grassland systems by leaching and surface runoff. In: van der Meer, H.G., Ryden, J.C., Ennik, G.C. (Eds.), Nitrogen Fluxes In Intensive Grassland Systems. Martinus Nijoff, Dordrecht, The Netherlands, pp. 85−97. Stout, W.L., Jung, G.A., 1992. Influences of soil environment on
biomass and nitrogen accumulation of orchardgrass. Agron. J. 84, 1001–1019.
Stout, W.L., Schnabel, R.R., 1994. Soil drainage influence on biomass and nitrogen accumulation by ryegrass. Agron. J. 86, 111–116.
Stout, W.L., Elwinger, G.F., Fales, S.L., Muller, L.D., Schnabel, R.R., Priddy, W.E., 1996. Nitrate leaching from intensively grazed pastures. Proc. American Forage and Grassland Council, Vancouver, BC, Canada.
Stout, W.L., Fales, S.A., Muller, L.D., Schnabel, R.R., Priddy, W.E., Elwinger, G.F., 1997. Nitrate leaching from cattle urine and feces in northeast US. Soil Sci Soc. Am. J. 61, 1787–1794. Stout, W.L., Gburek, W.J., Schnabel, R.R., Folmar, G.J., Weaver, S.R., 1998. Soil-climate effects on nitrate leaching from cattle excreta. J. Environ. Qual. 27, 992–998.
USDA, 1981a. Major land resource regions and major land resource areas of the United States. Agricultural Handbook 296. US Gov. Print. Office, Washington, DC.
USDA, 1981b. Soil survey of Centre County, Pennsylvania. United States Department of Agriculture, Washington, DC.
USDA, 1991. Agricultural Statistics. U.S. Gov. Print. Office, Washington, DC.
USEPA, 1979. Methods for analysis of water and wastes. USEPA, Cincinnati, OH.
USEPA, 1987. Quality criteria for water. EPA 440/5-86-001. US Gov. Print. Office, Washington, DC.