Impacts of WTO restrictions on subsidized EU sugar exports
Daneswar Poonyth
a, Patrick Westhoff
b,∗, Abner Womack
b, Gary Adams
b aDepartment of Agricultural Economics, Extension and Rural Development, University of Pretoria, Pretoria, South Africa bFood and Agricultural Policy Research Institute, University of Missouri, 101 South Fifth Street, Columbia, MO 65201, USAReceived 26 April 1999; received in revised form 21 October 1999; accepted 23 November 1999
Abstract
The study evaluates the impact of World Trade Organization (WTO) restrictions on the European Union (EU) sugar sector and the world sugar market. A small reduction in production quotas would be sufficient to satisfy the export subsidy limitations of the Uruguay Round agreement. Complete elimination of export subsidies by 2005 would require either a 10% reduction in production quotas or the combination of an 8% reduction in quotas and an 11% reduction in intervention prices. Higher world prices resulting from reduced EU exports would result in increased production of unsubsidized C-sugar, with different impacts across EU member countries explained by differences in institutional pricing arrangements and marginal production costs. © 2000 Elsevier Science B.V. All rights reserved.
Keywords:Sugar; European Union; World Trade Organization; Econometric model
1. Introduction
Traditionally agriculture has been treated differently than other industries within the General Agreement on Tariffs and Trade (GATT) rules. In the early rounds of GATT, agriculture received special treatment be-cause the political reality in many industrialized coun-tries required that support be provided to agriculture (Marks and Maskus, 1993). This support took the form of quantitative trade restrictions, subsidized exports, direct payments, and other production subsidies.
The European Union (EU) sugar sector has been regulated by the Common Agricultural Policy (CAP) since 1968. The CAP for sugar relies on a combi-nation of institutional support prices, import levies, subsidized exports, production quotas, and production controls on high fructose starch syrup (Abbott, 1990;
∗Corresponding author. Tel.:+1-573-882-3576;
fax:+1-573-884-4688.
E-mail address:[email protected] (P. Westhoff)
Devadoss and Kropf, 1996). With its sugar policies, the EU has become one of the major exporters of re-fined sugar in the world, accounting for 20% of the total world sugar exports and 14% of the total world sugar production (Hannah and Spencer, 1996). There is general agreement that EU sugar polices depress the world sugar market (Roningen and Dixit, 1989).
With the recent WTO agreements, trade barriers and other domestic support policies are being reduced gradually. In the case of the sugar sector, the WTO agreement requires only minor changes in the EU sugar import regime, but does establish limits on sub-sidized exports, both in terms of volume and budgetary expenditure. The WTO agreement gave its member countries discretion in determining how to alter their policies so as to meet their WTO obligations. The Eu-ropean Union has agreed to reduce production quotas to meet its subsidized exports obligations.
Previous studies (Zietz and Valdes, 1986;
Sudaryanto, 1987; Roningen and Dixit, 1989; Wong et al., 1989; Leuck and Neff, 1991; Roberts and
Wish-Wilson, 1991; Devadoss and Kropf, 1996) eval-uated the implications of trade liberalization on the world sugar market. These studies in one way or an-other found that trade liberalization would increase the world price of sugar. However, the implications of the current WTO agreement on the EU sugar sector have not been well addressed empirically.
This study examines the effect of WTO restrictions on subsidized exports on the EU sugar sector and the world sugar market. This study also considers two alternative approaches that the EU could pursue in meeting its WTO obligations, production quota reduction, and intervention price reduction. Further-more, this study evaluates the implication for the EU sugar sector and the world sugar market of a complete elimination of EU subsidized exports phased in over the period 2001/2002 to 2005/2006, using production quota reduction alone and using a combination of in-tervention price and production quota reduction. The analysis uses a simulation model of supply for each EU member country and of aggregate EU demand which is linked to a world sugar model. Disaggregating EU supply allows for a more rigorous analysis to be performed since institutional pricing differs among member nations.
The following sections describe the EU sugar pro-gram and the EU sugar model. The model is then used to evaluate the implications of the WTO restrictions on EU subsidized sugar exports and of a hypothetical step toward sugar trade liberalization.
2. EU sugar program
In 1968, the EU set up the CAP for sugar, estab-lishing a system of production quotas, internal price supports, variable import levies, and export subsidies (Abbott, 1990). To regulate the sugar industry, the EU uses a production quota system. A-quota sugar receives the highest price, the intervention price net of a 2% production levy. B-quota sugar receives the intervention price net of a maximum production levy of 39.5% (Abbott, 1990). Both A- and B-sugar are produced primarily for domestic consumption. Production within these quotas that is not used do-mestically is exported with subsidy, and production levy revenues are used to subsidize exports. Sugar production in excess of the A- and B-quota is known
as C-sugar and is exported on the world sugar mar-ket without subsidies. The EU also imports a certain quantity of sugar from the African-Caribbean-Pacific (ACP) group of countries under the Lomé Convention and its Special Preferential Sugar (SPS) program. This imported sugar is for domestic consumption or re-export with subsidies which are paid from the EU budget. The variable import levy is such that it has historically eliminated the possibility of imports from countries other than the ACP group.
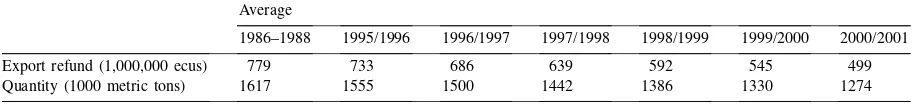
The WTO agreement brought small changes in the EU sugar regime. Sugar production quota and price systems remain unchanged, but EU subsidized exports are subject to volume and budgetary limits (Table 1). Domestic support provisions of the WTO agreement do not require any change in support prices, as the limitation applies to an aggregate measure of support rather than support for any one sector. Minimum ac-cess provisions of the agreement do not require any increase in imports because the EU imports about 10% of its domestic consumption from the ACP countries, as compared to the 5% required in the WTO agree-ment. The agreement does require that imports from countries not in the ACP group be subject to a fixed tariff instead of a variable import levy. The import tar-iff is to be reduced by 3.33% each year until 2001. In practice, the final bound import tariff of 339 euros per metric ton may be high enough under normal market conditions to exclude non-ACP sugar even after the
full implementation of the WTO agreement1.
Com-pared to the 1986–1988 average, the WTO agreement requires the EU to reduce its subsidized export volume by 21% and its expenditures on export subsidies by 36% by 2000/2001 (Table 1). The EU has indicated it would reduce production quotas if necessary to meet its WTO obligations to reduce subsidized exports.
In their production decisions, EU sugar beet pro-ducers consider both market and policy factors. For most producers, the price received for A- and B-sugar is sufficient to cover marginal production costs, so producers generally will produce enough sugar to fill their quota. For producers with marginal production costs between the prices received for B-sugar and C-sugar, the desired production levels should equal
Table 1
Permitted EU sugar export refunds and subsidized export quantities under the WTO agreementa Average
1986–1988 1995/1996 1996/1997 1997/1998 1998/1999 1999/2000 2000/2001
Export refund (1,000,000 ecus) 779 733 686 639 592 545 499
Quantity (1000 metric tons) 1617 1555 1500 1442 1386 1330 1274
aSource: Price and Taylor, 1996.
the sum of A-sugar and B-sugar quotas. On the other hand, producers whose marginal costs are equal to the C-sugar price (world price) will first fulfill the A-and B-sugar production quotas A-and then will produce above quota C-sugar.
However, member-state-level institutional
pric-ing arrangements pose considerable difficulties
in modeling producers’ production decisions.
Let PAS=(1−La)×IP be the price of A-sugar,
PBS=(1−La−Lb)×IP be the price of B-sugar,
PCS=WPS be the price of C-sugar where IP is the
in-tervention price,Lais the production levy on A-quota
sugar of 2%, Lb is the production levy on B-quota
sugar which varies between 2 and 39.5% and WPS is the world price of sugar. The producers’ marginal prices differ across countries depending on their insti-tutional pricing arrangements and may differ across producers within the same country. In some countries (e.g., UK, Italy, and Ireland) producers received a weighted average price, regardless of individual pro-duction level relative to quota (Bureau et al., 1997). The producer marginal incentive price in these coun-tries is a weighted average of the prices for A-and B-quota sugar and C-sugar, where the weights are the shares of A-, B-, and C-sugar in the total sugar production for the country. In this study, the expected weighted average price is computed as follows
WAPSt=
where WAPS is the weighted average expected price
of sugar in period t, ASPt−1 the A-sugar production
in timet−1, BSPt−1 the B-sugar production in time
t−1, CSPt−1the C-sugar production in timet−1, and
TSPt−1the total sugar production in timet−1.
In contrast, other EU countries have a different pric-ing arrangement. Producers receive the beet equiva-lent of A-and B-sugar quota prices for their in-quota
production, but receive the C-sugar price (world price) for any additional production. For producers that con-sistently produce C-sugar, this implies that the world price is the producer incentive price, since producers receive the world price for a marginal unit of produc-tion. In our model, the C-sugar price is used as the supply-inducing price for France, Germany, and sev-eral other countries.
However, even in countries with substantial C-sugar production, some high-cost producers may produce only A-sugar and B-sugar. Producers with such high marginal costs would produce no C-sugar or only a limited amount of C-sugar in order to assure that the A- and B-allocated sugar quotas are fulfilled. These producers may respond to some combination of A-, B-, and C-sugar prices rather than to the C-sugar price alone in making production decisions. Given the het-erogeneity of producers in any given country, the area equation for most countries (e.g. France, Germany, The Netherlands, Belgium, and Denmark) includes both the C-sugar price and the A- and B-sugar allo-cated production quotas. This specification is consis-tent with the assumption that some producers have marginal costs equal to the C-sugar price (and thus they will adjust production in response to movements in the C-sugar price), while most other producers in those countries have marginal production costs some-where between the B-and C-sugar prices (and thus will produce only enough to ensure fulfillment of their
A-and B-sugar quotas)2.
3. Modeling approach
The overall structure of the model is based on the dissertation research of Poonyth (1998). The model is a non-spatial partial equilibrium model: non-spatial because it does not identify trade flows between spe-cific regions and partial equilibrium because only one commodity is modeled. The structural econometric model focuses primarily on the policy variables that influence sugar production, consumption, and trade in the European Union. The model consists of 104 equations. There are 12 behavioral equations for beet area harvested and 12 beet production identities (Bel-gium and Luxemburg are treated as a single entity and Portugal and Greece are exogenous. Estimated supply equations for Greece and Portugal yielded re-sults that did not conform with expectations, hence the production block for these two small producers is declared exogenous.) The model has nine extrac-tion rate equaextrac-tions, 12 sugar producextrac-tion identities, and three identities for each country to account for A-sugar, B-A-sugar, and C-sugar production. Identities de-termine total EU area harvested, beet production, and production of A-, B-, and C-sugar. While supply tions are estimated for each country, a single equa-tion estimates total EU domestic sugar consumpequa-tion and another single equation estimates total EU ending stocks.
3.1. Supply equations
The typical beet area harvested equation is a func-tion of the previous period’s area harvested, the expected incentive price of sugar, allocated quota, a competing crop price, and input prices. As stated earlier, the incentive price of sugar is either the av-erage or the world price, depending upon the par-ticular nation’s policy mechanism. Sugar production is a product of beet area harvested, beet yield, and the sugar extraction rate. Furthermore, production quota sugar is computed for each country as follows. A-quota sugar (ASP) is the minimum of sugar pro-duction and the allocated A-sugar quota (SQAL),
ASPt=MIN[SPWt,SQALt]. B-sugar quota (BSP),
then takes up where allocation to higher-priced
A-sugar left off, BSPt=MAX[0, MIN(SPWt-ASPt,
SQBLt)], where SQBL is allocated B-sugar quota.
The following identity is used to compute lowest
priced C- sugar production (CSP), CSPt=MAX[0,
SPWt−BSPt−ASPt]. The total EU sugar supply is
the sum of sugar production for each country, EU total beginning stocks, imports from French Overseas Territories, and other EU imports including imports from ACP countries.
3.2. Demand equations
The demand component consists of total EU sumption and ending stocks equations. Per capita con-sumption for the EU is a function of the real retail price of sugar, a time trend, and per capita gross domestic product (as a proxy for income). Due to its sugar poli-cies, the European Union limits isoglucose production, thus restraining the role of isoglucose as a substitute for traditional sugar. As a result, no prices of substi-tutes are included in the domestic demand equation. The ending stocks are aggregated across the EU and expressed as a function of beginning stocks, the world price of sugar, C-sugar production, and minimum re-quired stocks. The exports component is treated as a residual to close the model (exports equal production plus beginning stocks and imports, minus domestic consumption and exports).
3.3. Price determination
With 20% of world exports, the European Union is not a ‘small country,’ and so the world price can-not be treated as an exogenous variable. Endognizing the world price allows the model to capture the ef-fect of EU exports on the residual world market for sugar. Instead of developing a new world sugar model, a reduced form equation to determine the world sugar price is derived from the existing world sugar model maintained by the Food and Agricultural Policy Re-search Institute (FAPRI). This world price equation can be thought of as an inverted total EU export de-mand equation.
Table 2
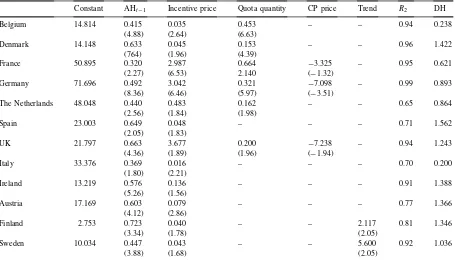
Estimated parameters for area harvested equationsa
Constant AHt−1 Incentive price Quota quantity CP price Trend R2 DH
Belgium 14.814 0.415 0.035 0.453 – – 0.94 0.238
(4.88) (2.64) (6.63)
Denmark 14.148 0.633 0.045 0.153 – – 0.96 1.422
(764) (1.96) (4.39)
France 50.895 0.320 2.987 0.664 −3.325 – 0.95 0.621
(2.27) (6.53) 2.140 (−1.32)
Germany 71.696 0.492 3.042 0.321 −7.098 – 0.99 0.893
(8.36) (6.46) (5.97) (−3.51)
The Netherlands 48.048 0.440 0.483 0.162 – – 0.65 0.864
(2.56) (1.84) (1.98)
Spain 23.003 0.649 0.048 – – – 0.71 1.562
(2.05) (1.83)
UK 21.797 0.663 3.677 0.200 −7.238 – 0.94 1.243
(4.36) (1.89) (1.96) (−1.94)
Italy 33.376 0.369 0.016 – – – 0.70 0.200
(1.80) (2.21)
Ireland 13.219 0.576 0.136 – – – 0.91 1.388
(5.26) (1.56)
Austria 17.169 0.603 0.079 – – – 0.77 1.366
(4.12) (2.86)
Finland 2.753 0.723 0.040 – – 2.117 0.81 1.346
(3.34) (1.78) (2.05)
Sweden 10.034 0.447 0.043 – – 5.600 0.92 1.036
(3.88) (1.68) (2.05)
aConstant=intercept; AH
t−1=area harvested in previous year; Incentive Price=price of sugar (weighted average of A-, B-, and C-sugar prices in Ireland, UK, and Italy; C-sugar price in all other countries); Quota Quantity=allocated A-+B-sugar production quota; CP Price=competing crop (wheat) price; DH-Durbin H statistic. In parentheses aret-statistics.
4. Data sources
Data for area harvested, beet production, sugar production, and sugar content were provided by two institutions, the Confederation Internationale des Bettraviers Europeen and the Comite Europeen des
Fabricant de Sucres. Consumption, stocks, imports,
exports, production, quota, and policy prices, as well as consumption prices and world sugar prices (the Paris spot market price), are from Eurostat’s
Agricul-tural Statistical Yearbook3. Eurostat also provided the
price statistics for competing crops and green rates4.
Market exchange rates, income and price measures, wage rate indices, and population statistics are from
3Eurostat. Agricultural Statistical Yearbook. Office for Official Publication of the European Communities, Luxemburg (various years).
4Eurostat. Agricultural Prices. Office for Official Publication of the European Communities, Luxemburg (various years).
International Financial Statistics, an International Monetary Fund publication. The data are adjusted to reflect the crop year by weighting calendar year data. Policy prices are converted to local currency using green rates. World sugar prices were converted to lo-cal currency using market exchange rates. Sugar data are expressed in terms of refined equivalent. Germany from 1990 onward includes the former East Germany.
5. Estimated parameters and elasticities
that the estimated econometric model provides reli-able estimates of EU sugar supply and utilization. For example, most of the root mean square (RMS) percent errors for both static and dynamic simulations are less than 3%, whereas for the new entrants (Spain, Austria, Finland and Sweden) the RMS percent errors are between 2 and 8%. The Thiel U statistics are in the range of 0.006 to 0.038. The fit of most of the
area harvested equations as measured byR2is above
0.80, the exception being The Netherlands and Italy
where estimatedR2are 0.65 and 0.70, respectively.
The estimated coefficients associated with allocated sugar quota (transformed to hectarage) are smaller than one (between 0.16 and 0.67), implying that a 1 ha change in the area-equivalent of sugar quota affects harvested area by less than 1 ha. This is consistent with the hypothesis that some producers are responding to the quota at the margin, while others are responding to the C-sugar price, even within a given country. In the cases of France, Germany, and the UK, wheat was found to be the competing crop. C-sugar forms the ma-jor share of the ending stocks of sugar in the European Union. Since C-sugar receives the world price, ending stocks are influenced by the world price of sugar as well as C-sugar production.
A reduced form equation can be used to determine the world sugar price as a function of EU sugar net exports,
Table 3
Estimated supply elasticitiesa
World price Average price Quota quantity CP price
SR LR SR LR SR LR SR LR
Belgium 0.040 0.069 – – 0.416 0.703 – –
Denmark 0.018 0.050 – – 0.140 0.388 – –
France 0.155 0.228 – – 0.541 0.794 −0.130 −0.200
Germany 0.050 0.098 – – 0.336 0.663 −0.075 −0.148
The Netherlands 0.029 0.052 – – 0.141 0.252 – –
Spain 0.115 0.336 – – – – – –
Austria 0.087 0.220 – – – – – –
Finland 0.028 0.100 – – – – – –
Sweden 0.021 0.038 – – – – – –
UK – – 0.088 0.263 0.185 0.548 −0.057 −0.148
Italy – – 0.592 0.832 – – – –
Ireland – – 0.020 0.047 – – – –
aAverage Price=weighted average of A-, B-, and C-sugar prices; Quota Quantity=allocated A-+B-sugar production quota; CP Price=competing crop (wheat) price; SR=short run; LR=long run.
LOG(WPS)= −1.0×LOG(EUEXPT−EUIMP)
+0.46×LOG(EUEXPT−EUIMP)t−1
where WPS is the world price of sugar, EUEXPT represents total EU sugar exports, and EUIMP repre-sents total EU sugar imports. The parameters are de-rived from FAPRI’s world sugar model. The short-run flexibility is negative one and the long-run flexibility is approximately half that of the short-run, reflecting EU sugar export demand elasticities that are approx-imately twice as large in the long run as in the short run.
elas-Table 4
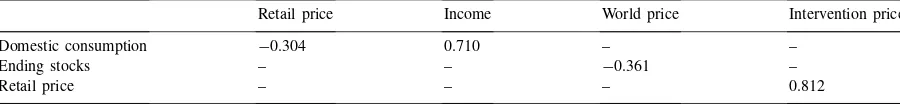
Demand and price transmission elasticities
Retail price Income World price Intervention price
Domestic consumption −0.304 0.710 – –
Ending stocks – – −0.361 –
Retail price – – – 0.812
ticities range from−0.06 to−0.13, whereas long-run
elasticities fall between −0.15 and −0.20. Previous
studies such as those of Graham (1983), Wong et al. (1989), Leuck and Neff (1991), Devadoss and Kropf (1996) estimated long run supply elasticities in the range of 0.1–2, whereas Ball et al. (1993) estimated short run elasticities in the range of 0.1–1.6.
The computed income elasticity of demand for sugar in the European Union is 0.71 and the own-price
elasticity of demand is−0.30 (Table 4). Wong et al.
(1989) estimated a demand price elasticity of−0.32
and an income elasticity of 0.26, while Devadoss and Kropf (1996) estimated an income elasticity of 0.30 but did not report an own-price elasticity.
6. Implication of WTO limits
To estimate the effects of WTO restrictions on EU subsidized exports, the estimated model is used to generate a baseline for the period 1998/1999 to 2005/2006. The main assumptions underlying the baseline are that policy variables such as production quotas, intervention prices, and production levies are kept at the same level as prevailed prior to adoption of the WTO agreement. Forecasted values of exogenous macroeconomic variables for the baseline period are from the WEFA Group.
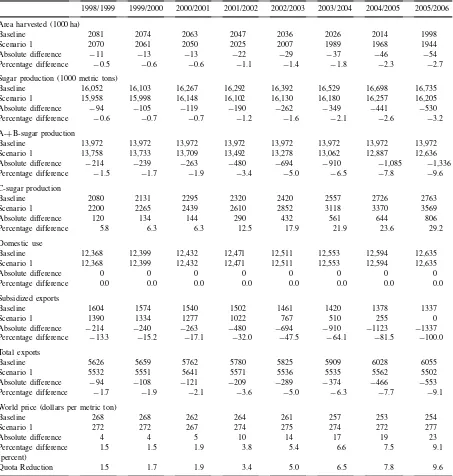
To meet its WTO obligations to reduce subsidized exports, the European Union has opted to reduce quota production. We use the model to estimate the magni-tude of the quota reductions required to bring subsi-dized EU sugar exports within the limits set by the Uruguay Round agreement. By 2000/2001, the esti-mated reduction is 1.9%. The resulting reduction in EU sugar exports results in a 1.9% increase in world sugar prices. This increase in world sugar prices, in turn, increases C-sugar prices and production, offset-ting much of the decline in A- and B-sugar produc-tion. While subsidized exports decline by the required
263,000 metric tons relative to the baseline, unsubsi-dized C-sugar exports increase by 142,000 metric tons (Table 5).
Alternatively, the European Union could have cho-sen to reduce intervention prices to meet its WTO obli-gations for subsidized export. Model results indicate that a 9.9% reduction in intervention prices would have been required by 2000/2001 to reduce subsidized ex-ports by the required amount. Reducing intervention prices would reduce subsidized exports in two ways. First, lower intervention prices would result in lower retail prices, and lower retail prices would increase domestic EU consumption of sugar. The increase in domestic consumption would reduce the amount of surplus A-and B-sugar available for export (Table 7). Second, lower intervention prices would reduce sugar production in some countries. In UK and Italy, producers receive the same average price for all of their production so a reduction in intervention prices would reduce the supply-inducing price. Reduced sugar production in these countries, however, would be offset by increased production in other EU coun-tries. In countries such as Germany and France, producers receive the C-sugar price for any produc-tion in excess of their A- and B-quotas. Reduced EU exports increase world prices by more than 4% in 2000/2001 under the reduced intervention price sce-nario. The price on a marginal unit of sugar increases, and therefore, production increases. This occurs even though the reduction in intervention prices means that the average price received by most producers declines.
Table 5
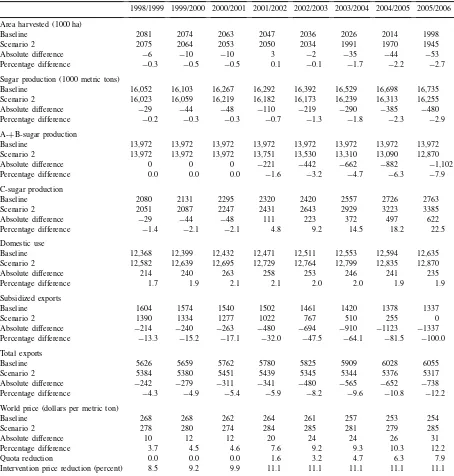
EU sugar supply and utilization outlook using production quota reduction alonea
1998/1999 1999/2000 2000/2001 2001/2002 2002/2003 2003/2004 2004/2005 2005/2006 Area harvested (1000 ha)
Baseline 2081 2074 2063 2047 2036 2026 2014 1998
Scenario 1 2070 2061 2050 2025 2007 1989 1968 1944
Absolute difference −11 −13 −13 −22 −29 −37 −46 −54
Percentage difference −0.5 −0.6 −0.6 −1.1 −1.4 −1.8 −2.3 −2.7 Sugar production (1000 metric tons)
Baseline 16,052 16,103 16,267 16,292 16,392 16,529 16,698 16,735
Scenario 1 15,958 15,998 16,148 16,102 16,130 16,180 16,257 16,205
Absolute difference −94 −105 −119 −190 −262 −349 −441 −530
Percentage difference −0.6 −0.7 −0.7 −1.2 −1.6 −2.1 −2.6 −3.2 A-+B-sugar production
Baseline 13,972 13,972 13,972 13,972 13,972 13,972 13,972 13,972
Scenario 1 13,758 13,733 13,709 13,492 13,278 13,062 12,887 12,636
Absolute difference −214 −239 −263 −480 −694 −910 −1,085 −1,336 Percentage difference −1.5 −1.7 −1.9 −3.4 −5.0 −6.5 −7.8 −9.6 C-sugar production
Baseline 2080 2131 2295 2320 2420 2557 2726 2763
Scenario 1 2200 2265 2439 2610 2852 3118 3370 3569
Absolute difference 120 134 144 290 432 561 644 806
Percentage difference 5.8 6.3 6.3 12.5 17.9 21.9 23.6 29.2
Domestic use
Baseline 12,368 12,399 12,432 12,471 12,511 12,553 12,594 12,635
Scenario 1 12,368 12,399 12,432 12,471 12,511 12,553 12,594 12,635
Absolute difference 0 0 0 0 0 0 0 0
Percentage difference 0.0 0.0 0.0 0.0 0.0 0.0 0.0 0.0
Subsidized exports
Baseline 1604 1574 1540 1502 1461 1420 1378 1337
Scenario 1 1390 1334 1277 1022 767 510 255 0
Absolute difference −214 −240 −263 −480 −694 −910 −1123 −1337 Percentage difference −13.3 −15.2 −17.1 −32.0 −47.5 −64.1 −81.5 −100.0 Total exports
Baseline 5626 5659 5762 5780 5825 5909 6028 6055
Scenario 1 5532 5551 5641 5571 5536 5535 5562 5502
Absolute difference −94 −108 −121 −209 −289 −374 −466 −553
Percentage difference −1.7 −1.9 −2.1 −3.6 −5.0 −6.3 −7.7 −9.1 World price (dollars per metric ton)
Baseline 268 268 262 264 261 257 253 254
Scenario 1 272 272 267 274 275 274 272 277
Absolute difference 4 4 5 10 14 17 19 23
Percentage difference 1.5 1.5 1.9 3.8 5.4 6.6 7.5 9.1
(percent)
Quota Reduction 1.5 1.7 1.9 3.4 5.0 6.5 7.8 9.6
to achieving this objective are analyzed. The first would rely solely on production quota reductions, the second would combine both intervention price and production quota reductions.
To eliminate export subsidies by 2005/2006, we es-timate that production quotas need to be reduced by 9.6% if intervention prices are not adjusted. Under such a scenario, A- and B-quota production would de-cline by a total of 1.3 million metric tons in 2005/2006, while C-sugar production would increase by 0.8 mil-lion metric tons in response to a 9.1% increase in the world price (Table 5).
Reducing quotas reduces sugar production in all ma-jor EU countries, but has a proportionally smaller ef-fect in countries such as Italy, where average-pricing practices prevail. Even though many producers oper-ate at C-sugar prices at the margin in countries such
Table 6
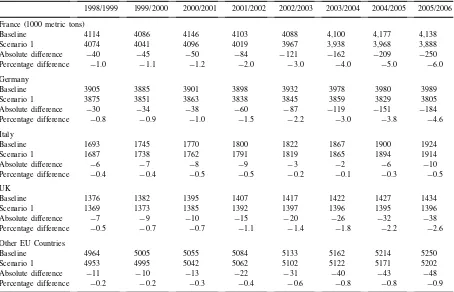
EU Sugar production outlook using production quota reduction alonea
1998/1999 1999/2000 2000/2001 2001/2002 2002/2003 2003/2004 2004/2005 2005/2006 France (1000 metric tons)
Baseline 4114 4086 4146 4103 4088 4,100 4,177 4,138
Scenario 1 4074 4041 4096 4019 3967 3,938 3,968 3,888
Absolute difference −40 −45 −50 −84 −121 −162 −209 −250
Percentage difference −1.0 −1.1 −1.2 −2.0 −3.0 −4.0 −5.0 −6.0 Germany
Baseline 3905 3885 3901 3898 3932 3978 3980 3989
Scenario 1 3875 3851 3863 3838 3845 3859 3829 3805
Absolute difference −30 −34 −38 −60 −87 −119 −151 −184
Percentage difference −0.8 −0.9 −1.0 −1.5 −2.2 −3.0 −3.8 −4.6 Italy
Baseline 1693 1745 1770 1800 1822 1867 1900 1924
Scenario 1 1687 1738 1762 1791 1819 1865 1894 1914
Absolute difference −6 −7 −8 −9 −3 −2 −6 −10
Percentage difference −0.4 −0.4 −0.5 −0.5 −0.2 −0.1 −0.3 −0.5 UK
Baseline 1376 1382 1395 1407 1417 1422 1427 1434
Scenario 1 1369 1373 1385 1392 1397 1396 1395 1396
Absolute difference −7 −9 −10 −15 −20 −26 −32 −38
Percentage difference −0.5 −0.7 −0.7 −1.1 −1.4 −1.8 −2.2 −2.6 Other EU Countries
Baseline 4964 5005 5055 5084 5133 5162 5214 5250
Scenario 1 4953 4995 5042 5062 5102 5122 5171 5202
Absolute difference −11 −10 −13 −22 −31 −40 −43 −48
Percentage difference −0.2 −0.2 −0.3 −0.4 −0.6 −0.8 −0.8 −0.9 aNote: Baseline freezes intervention price and production quotas at pre-Uruguay Round levels. Scenario 1 assumes production quotas are reduced to comply with Uruguay Round commitments through 2000/2001 to reduce export subsidies and with a hypothetical requirement to eliminate export subsidies by 2005/2006.
as France and Germany, other higher-cost producers in those countries produce only enough to fill their A-and B-quotas, A-and so reduce their sugar production when quotas are reduced (Table 6).
Table 7
EU sugar supply and utilization outlook using a combination of intervention price reductions and production quota reductionsa 1998/1999 1999/2000 2000/2001 2001/2002 2002/2003 2003/2004 2004/2005 2005/2006 Area harvested (1000 ha)
Baseline 2081 2074 2063 2047 2036 2026 2014 1998
Scenario 2 2075 2064 2053 2050 2034 1991 1970 1945
Absolute difference −6 −10 −10 3 −2 −35 −44 −53
Percentage difference −0.3 −0.5 −0.5 0.1 −0.1 −1.7 −2.2 −2.7
Sugar production (1000 metric tons)
Baseline 16,052 16,103 16,267 16,292 16,392 16,529 16,698 16,735
Scenario 2 16,023 16,059 16,219 16,182 16,173 16,239 16,313 16,255
Absolute difference −29 −44 −48 −110 −219 −290 −385 −480
Percentage difference −0.2 −0.3 −0.3 −0.7 −1.3 −1.8 −2.3 −2.9 A-+B-sugar production
Baseline 13,972 13,972 13,972 13,972 13,972 13,972 13,972 13,972
Scenario 2 13,972 13,972 13,972 13,751 13,530 13,310 13,090 12,870
Absolute difference 0 0 0 −221 −442 −662 −882 −1,102
Percentage difference 0.0 0.0 0.0 −1.6 −3.2 −4.7 −6.3 −7.9
C-sugar production
Baseline 2080 2131 2295 2320 2420 2557 2726 2763
Scenario 2 2051 2087 2247 2431 2643 2929 3223 3385
Absolute difference −29 −44 −48 111 223 372 497 622
Percentage difference −1.4 −2.1 −2.1 4.8 9.2 14.5 18.2 22.5
Domestic use
Baseline 12,368 12,399 12,432 12,471 12,511 12,553 12,594 12,635
Scenario 2 12,582 12,639 12,695 12,729 12,764 12,799 12,835 12,870
Absolute difference 214 240 263 258 253 246 241 235
Percentage difference 1.7 1.9 2.1 2.1 2.0 2.0 1.9 1.9
Subsidized exports
Baseline 1604 1574 1540 1502 1461 1420 1378 1337
Scenario 2 1390 1334 1277 1022 767 510 255 0
Absolute difference −214 −240 −263 −480 −694 −910 −1123 −1337 Percentage difference −13.3 −15.2 −17.1 −32.0 −47.5 −64.1 −81.5 −100.0 Total exports
Baseline 5626 5659 5762 5780 5825 5909 6028 6055
Scenario 2 5384 5380 5451 5439 5345 5344 5376 5317
Absolute difference −242 −279 −311 −341 −480 −565 −652 −738
Percentage difference −4.3 −4.9 −5.4 −5.9 −8.2 −9.6 −10.8 −12.2 World price (dollars per metric ton)
Baseline 268 268 262 264 261 257 253 254
Scenario 2 278 280 274 284 285 281 279 285
Absolute difference 10 12 12 20 24 24 26 31
Percentage difference 3.7 4.5 4.6 7.6 9.2 9.3 10.3 12.2
Quota reduction 0.0 0.0 0.0 1.6 3.2 4.7 6.3 7.9
Table 8
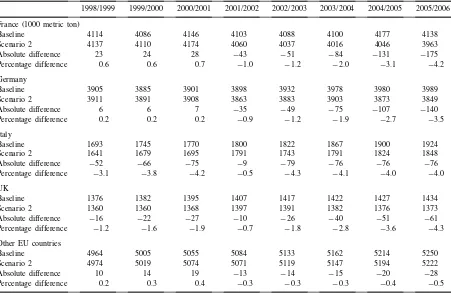
EU sugar production outlook using a combination of intervention price reductions and production quota reductionsa
1998/1999 1999/2000 2000/2001 2001/2002 2002/2003 2003/2004 2004/2005 2005/2006 France (1000 metric ton)
Baseline 4114 4086 4146 4103 4088 4100 4177 4138
Scenario 2 4137 4110 4174 4060 4037 4016 4046 3963
Absolute difference 23 24 28 −43 −51 −84 −131 −175
Percentage difference 0.6 0.6 0.7 −1.0 −1.2 −2.0 −3.1 −4.2
Germany
Baseline 3905 3885 3901 3898 3932 3978 3980 3989
Scenario 2 3911 3891 3908 3863 3883 3903 3873 3849
Absolute difference 6 6 7 −35 −49 −75 −107 −140
Percentage difference 0.2 0.2 0.2 −0.9 −1.2 −1.9 −2.7 −3.5
Italy
Baseline 1693 1745 1770 1800 1822 1867 1900 1924
Scenario 2 1641 1679 1695 1791 1743 1791 1824 1848
Absolute difference −52 −66 −75 −9 −79 −76 −76 −76
Percentage difference −3.1 −3.8 −4.2 −0.5 −4.3 −4.1 −4.0 −4.0 UK
Baseline 1376 1382 1395 1407 1417 1422 1427 1434
Scenario 2 1360 1360 1368 1397 1391 1382 1376 1373
Absolute difference −16 −22 −27 −10 −26 −40 −51 −61
Percentage difference −1.2 −1.6 −1.9 −0.7 −1.8 −2.8 −3.6 −4.3 Other EU countries
Baseline 4964 5005 5055 5084 5133 5162 5214 5250
Scenario 2 4974 5019 5074 5071 5119 5147 5194 5222
Absolute difference 10 14 19 −13 −14 −15 −20 −28
Percentage difference 0.2 0.3 0.4 −0.3 −0.3 −0.3 −0.4 −0.5
aNote: Baseline freezes intervention price and production quotas at pre-Uruguay Round levels. Scenario 2 assumes intervention prices are reduced to comply with Uruguay Round commitments through 2000/2001 to reduce export subsidies and that a combination of intervention price reductions and production quota reductions are used to comply with a hypothetical requirement to eliminate export subsidies by 2005/2006.
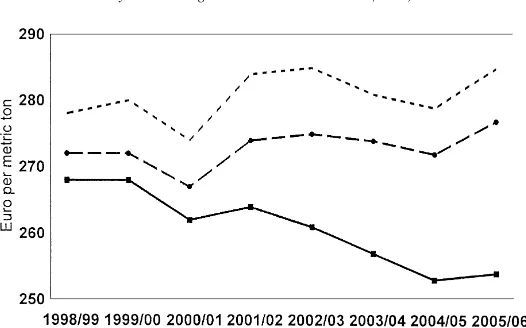
Fig. 2. World price of sugar.
Figs. 1–3 summarize the aggregate results. In the baseline, EU sugar production and exports would increase over time, while world prices fall. The sce-narios that phase out export subsidies result in more stable levels of EU production and exports, and of world prices. Because lowering intervention prices results in increased domestic sugar consumption, EU sugar production is greater but exports are less when intervention prices are reduced compared to the scenario relying strictly on quota reductions.
Fig. 3. EU total sugar exports.
7. Summary and conclusions
other countries, producers receive an average price for all sugar produced so policy prices have a larger im-pact on production than do world prices.
A second major finding of this study is that the world market impacts of reductions in subsidized EU sugar exports depend on the manner in which those reductions are achieved. Relying on quota reductions alone results in smaller reductions in total EU exports than if intervention prices are reduced. Lower inter-vention prices result in adjustments in both EU pro-duction and consumption, while quota changes only affect production.
The implications for a future WTO agreement are important. If such an agreement requires further re-ductions in subsidized exports but does not require reduced tariffs, EU may choose to rely on quota re-ductions to meet its obligations, thus minimizing the benefits of lower EU exports and higher world prices for competing sugar exporters. In contrast, if the agreement also requires substantial tariff reductions, the EU could be forced to reduce intervention prices to avoid large increases in sugar imports. Even if the result is no increase in EU sugar imports, the resulting further reduction in EU sugar exports could benefit other exporters, as well as EU sugar consumers.
Acknowledgements
The authors are grateful to Kevin Hanrahan and two anonymous referees for their useful comments on an earlier draft.
References
Abbott G.C., 1990. Sugar. Routlege, London.
Bureau, J.C., Guyomard, H., Requillart, V., 1997. Quota mobility in the European sugar regime. Eur. Rev. Agric. Econ. 24, 1– 30.
Devadoss, S., Kropf, J., 1996. Impacts of trade liberalizations under the Uruguay round on the world sugar market. Agric. Econ. 15, 83–96.
Graham, H.E., 1983. Sugar beet supply response in three EEC countries, Report 1. Institute of Agricultural Economics, University of Oxford.
Leuck, D., Neff, S., 1991. Potential effects of policy reforms on the European Community Sugar Market. Staff Reports AGES 9129. Agricultural and Trade Analysis Division, ERS, UDSA, Washington, DC.
Marks V.S., Maskus E.K., (Eds), 1993. The Economics and Politics of World Sugar Policies. The University of Michigan Press, Ann Arbor, MI, USA.
Poonyth, D., 1998. A structural econometric model of European Union sugar industry and the potential implications of the GATT WTO. Unpublished Ph.D. Dissertation, University of Missouri, Columbia, MO.
Price, J., Taylor, R., 1996. European Union Sugar: The EU Sugar Policy, The Agrimonetary System, GATT and The WTO. E D & F Man Sugar Ltd, London.
Roberts, I.M., Wish-Wilson, P., 1991. Domestic And world markets of EC sugar policies. Discussion Paper 91-1. Australian Bureau of Agricultural and Resource Economics, Canberra, Australia.
Roningen, V.O., Dixit, M.P., 1989. How level is the playing field? An Economic Analysis of Agricultural Policy Reforms in Industrial Market Economies. FAER-239. USDA., ERS, Washington, DC.
Sudaryanto, T., 1987. The potential impacts of liberalized trade policies in the United States and the European Economic Community on international market for sugar. Unpublished Ph.D. Dissertation, North Carolina State University, Raleigh, NC.
Wong G., Sturgis, R., Borrell, B., 1989. The Economic Consequences of International Trade Sugar Reform. Discussion Paper 89-7. Australian Bureau of Agricultural and Resource Economics, Canberra, Australia.