GEOPOSITIONING PRECISION ANALYSIS OF MULTIPLE IMAGE TRIANGULATION
USING LRO NAC LUNAR IMAGES
K. Di, B. Xu, B. Liu*, M. Jia, Z. Liu
State Key Laboratory of Remote Sensing Science, Institute of Remote Sensing and Digital Earth, Chinese Academy of Sciences - (dikc, xubin, liubin, jiamn, liuzq)@radi.ac.cn
Commission IV, WG IV/8
KEY WORDS: Lunar, Geopositioning, Triangulation, Multiple images, LRO NAC image
ABSTRACT:
This paper presents an empirical analysis of the geopositioning precision of multiple image triangulation using Lunar Reconnaissance Orbiter Camera (LROC) Narrow Angle Camera (NAC) images at the Chang’e-3(CE-3) landing site. Nine LROC NAC images are selected for comparative analysis of geopositioning precision. Rigorous sensor models of the images are established based on collinearity equations with interior and exterior orientation elements retrieved from the corresponding SPICE kernels. Rational polynomial coefficients (RPCs) of each image are derived by least squares fitting using vast number of virtual control points generated according to rigorous sensor models. Experiments of different combinations of images are performed for comparisons. The results demonstrate that the plane coordinates can achieve a precision of 0.54 m to 2.54 m, with a height precision of 0.71 m to 8.16 m when only two images are used for three-dimensional triangulation. There is a general trend that the geopositioning precision, especially the height precision, is improved with the convergent angle of the two images increasing from several degrees to about 50°. However, the image matching precision should also be taken into consideration when choosing image pairs for triangulation. The precisions of using all the 9 images are 0.60 m, 0.50 m, 1.23 m in along-track, cross-track, and height directions, which are better than most combinations of two or more images. However, triangulation with selected fewer images could produce better precision than that using all the images.
* Corresponding author
1. INTRODUCTION
Three dimensional (3D) mapping of lunar surface is of great importance for scientific investigations and supporting landed missions. Traditional 3D lunar mapping utilizes stereo image pairs acquired by one orbiter from the same orbit (along-track stereo) or from neighbouring orbit (cross-track stereo) (Radhadevi et al., 2011, Scholten et al., 2011, Kirk et al., 2012, Di et al., 2014). With continual data acquisition by multiple lunar orbiter missions, many areas of the lunar surface have been covered many times by different orbiters or the same orbiter. This raises an interesting issue that how to achieve the best geopositioning and mapping precision in those areas with multi-image coverages. This paper presents an empirical analysis of the geopositioning precision of multi-image triangulation using LROC NAC images at the CE-3 landing site.
CE-3 is the first lander and rover mission of China after the success of Chang’e-1 and Chang’e-2 orbiter missions. It was launched on 2 December 2013 and successfully landed at (44.12 °N, 19.51 °W) (radio-tarcking solution) in northern Mare Imbrium of the Moon on 14 December 2013 (Liu et al., 2015a, Liu et al., 2015b). Lunar Reconnaissance Orbiter (LRO) was sent to Moon on 18 June 2009, carrying seven instruments, one of which is LROC that consists of one Wide Angle Camera (WAC) and two NACs (Robinson et al., 2010). The multispectral WAC is a 7-color push-frame camera with the resolutions of 100 and 400 m/pixel in visible and UV bands, respectively, while the NACs are monochrome narrow-angle
linescan imagers with a resolution of up to 0.5 m/pixel. The NAC images are chosen in this research for their higher resolution and multiple coverages.
Photogrammetric processing of LROC NAC images have been done by several teams, e.g., ASU, DLR, TUB, NASA Ames, UA, OSU and USGS, using ISIS and SOCET SET software; through buddle adjustment the root mean square (RMS) errors can be reduced to sub-pixel level (Tran et al., 2010). In order for identification of stereo image pairs, Becker et al. (2015) provide recommended method and criteria considering image overlap, similar spatial resolution, 3D stereo imaging “strength”, illumination similarity, similar solar longitude and compatible spectral wavelength range. In this research, we perform a quantitative analysis about multi-image triangulation using NAC images with consideration of convergent angle and image matching error.
2. METHODOLOGY
The method used in this research mainly includes the following steps: establishing the rigorous sensor models as well as the rational function models of the images, block adjustment of multiple images based on rational function models, and geopositioning precision evaluation with different combinations of the images.
2.1 Rigorous sensor model (RSM)
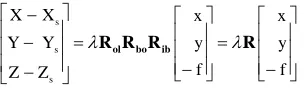
The RSM connects the image coordinates of a LROC NAC image with the corresponding Moon fixed coordinates. It is represented by collinearity equations with interior and exterior orientation elements retrieved from the corresponding SPICE kernels. The RSM can be described as Equation (1) (Di et al., point coordinates and the optical center position in lunar body-fixed coordinate system (LBS), respectively; Rib is the rotation matrix from the image space coordinate system to the spacecraft body coordinate system (BCS); Rbo is the rotation matrix from the BCS to the orbit coordinate system (OCS); Rol is the rotation matrix from the OCS to the LBF; R is the combination of these three matrices and is the scale factor.
Based on collinearity equations, the 3D coordinates of a ground point can be calculated through space intersection using the image coordinates of corresponding points from a stereo image pair. Alternatively, the ground location can also be calculated from a single image if the elevation of the point is known (i. e., a Digital Elevation Model (DEM) is available). Here, we give the method to derive the latitude and longitude (L, B) position from the image coordinates (r, c) and the given height h. Firstly, the image coordinates (r, c) are transformed to [x, y, –f ]T by interior orientation shown as follows (NAIF, 2014):
( _ ) _
where, BORESIGHT_SAMPLE is the principal point coordinate, PIXEL_PITCH is the pixel size of the image, xd is the distorted position (the measured position), k1 is the distortion coefficient, r is the distance between the optical center and image points, and x is the corrected focal plane positions in mm. These parameters of left and right cameras (NAC-L and NAC-R) used for interior orientation are listed in Table 1. Because the NAC CCDs are line scan cameras (single line CCD), yd is zero and subsequently y is always zero.
Left Right BORESIGHT_SAMPLE (pixel) 2548 2496 PIXEL_PITCH (mm) 7.010-3 7.010-3
k1 1.8110-5 1.8310-5
f(mm) 699.62 701.57
Table 1. The interior orientation parameters (NAIF, 2014)
Secondly, the R[x y –f]T are normalized to [u1 u2 u3] the latitude and longitude (L, B) can be calculated by Equation (10): image-space coordinates and object-space coordinates with the ratios of polynomials (Di et al., 2003), as shown in Equation of the image with the procedure described below:
First, a series of grid points in a certain interval are generated in every image as the virtual control points in image space. Then, the elevation in the object space is divided into several layers and the ground coordinates of virtual control points in every
layer are calculated by the method elaborated in the previous section. Finally, the RPCs are derived by these virtual control points through least squares fitting.
From the literatures and our experiences, the RFM can approximate RSM with a precision of 1/100 pixel level in image space (Liu and Di, 2011). That is to say, in practical applications RFM can be used to replace RSM without loss of accuracy. Similar to RSM, RFM can be used to calculate 3D ground position using image coordinates from a stereo pair or from a single image with a known DEM.
Comparing with RSM, RFM has the advantages of simplicity, and independency of sensors. It is particularly advantageous for integrated mapping using multiple images from the same orbiter or different orbiters.
2.3 Block adjustment based on RFM
Due to orbit and attitude errors, the RSM, as well as the fitted RFM, may not be sufficiently accurate for mapping applications. The geopositioning error can be expressed by back-projection errors in image space and can be corrected through block adjustment of two or more images. For RFM based block adjustment, instead of re-solving the RPCs, correction parameters for image coordinates (row and column) are usually incorporated. Affine transformation model (Liu et al., 2014) in image space, shown in Equation (13), is used to realize such correction:
0 1 2
0 1 2
' ' ' 0
' ' ' 0
r r r r
c c c c
F p p c p r r r F p p c p r c c
(13)
where (r, c) are the measured (matched) image coordinates, (r', c’) are the projected image coordinates of tie points calculated from ground points using RFM,
0
r
p ,
1
r
p ,
2
r
p ,
0
c
p ,
1
c
p ,
2
c
p
are Affine transformation parameters. The Affine transformation parameters for each image as well as the 3D coordinates of the tie points are solved iteratively by least squares adjustments.
2.4 Precision evaluation
The geopositioning precision is evaluated by check points. Control points and check points are selected according to the NASA PDS products of CE-3 landing site. Both DEM and Digital Orthophoto Map (DOM) are used to derive the 3D coordinates of the control and check points.
Tie points in the overlap regions are extracted by cross-correlation and least squares matching of interest points and possible gross errors are removed by a RANSAC algorithm. According to the coordinates of tie points in object space, the back projection residuals are calculated and named as the image plane errors. Then, the RMS residuals between the coordinates calculated from block adjustments and the true values of control
points and check points are taken as the indicator of the precision in object space.
3. EXPERIMENTAL RESULTS AND DISCUSSIONS 3.1 Data set
Nine LROC NAC images covering an area of 12 km75 km around the CE-3 landing site are selected. They were acquired from 15 January 2012 to 21 January 2014. The images are downloaded from the LROC website (http://lroc.sese.asu.edu). The resolutions range from 1.475 m to 1.755 m and the size of the original images is 506452224 pixels. The image names and their main parameters, such as pixel size, emission angles, incidence angles and central locations are shown in Table 2. The DEM and DOM data of the CE-3 site, which were generated from the stereo images M1144922100 and M1144936321 and have a resolution of 1.6 m, are also downloaded (http://wms.lroc.asu.edu/lroc/view_rdr/NAC_DTM _CHANGE3) and used as references from precision evaluation.
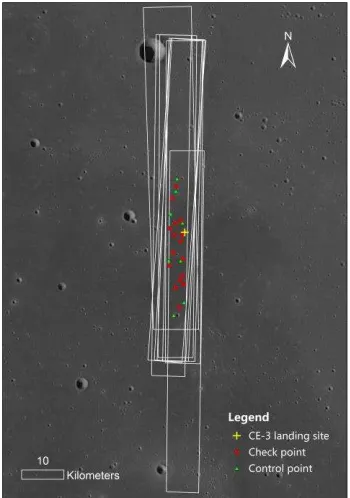
The layout of the ground coverage of all images used in the research is shown in Figure 1, with the background of a LRO WAC image. The north direction and the scale are placed in upper-right and lower-left of the Figure respectively, while the yellow cross in the center is the landing point of CE-3.
Figure 1. Layout of the ground coverage of 9 LROC NAC images and the distribution of control points and check points
Image name ID Scaled
pixel width
Scaled pixel height
Emission angle
Incidence angle
Center latitude
Center longitude
M181302794LE M1 1.59 1.55 1.79 71.7 43.42 340.49
M183661683LE M2 1.59 1.54 1.79 54.12 44.33 340.34
M1142554338LE M3 2.05 1.46 34.72 73.87 44.63 340.35
M1142568554LE M4 1.62 1.46 18.41 75.24 44.4 340.41
M1144922100LE M5 1.65 1.46 20.18 56.49 44.36 340.48
M1144929211LE M6 1.53 1.46 11.19 57.06 44.37 340.47
M1144936321LE M7 1.49 1.46 1.79 57.62 44.37 340.43
M1144943432LE M8 1.52 1.46 7.96 58.21 44.37 340.43
M1144950543LE M9 1.63 1.46 17.16 58.78 44.37 340.4
Table 2. Information of the images used in the experiment
Using the method briefly described in Section 2.4, 129 tie points, existing in all 9 images, are selected and the corresponding points on the DOM are acquired by least squares matching to get the horizontal coordinates, 63 points out of which are successfully matched. Eight and sixteen equally distributed tie points are chosen as control points and check points respectively. The vertical coordinates of these points are obtained from DEM. The distribution of the 8 ground control points (green triangles) and 16 check points (red circles) used to evaluate the final geopositioning precision are also shown in Figure 1.
3.2 Geopositioning precision of a stereo pair
To investigate the geopositioning precision of multi-image triangulation, we firstly compare the precision of dual-image combinations. Thirty-six image pairs are combined from the 9 NAC images and the convergent angles of each pair are calculated as well as the coordinate errors in object space.
The geopositioning results of the 16 check points demonstrate that when only two images are used for 3D triangulation, the plane coordinates can reach the precision of 0. 54 m to 2.54 m, and the height precision of 0.71 m to 8.16 m. The best precisions from two images are 0.31 m, 0.36 m, 0.71 m in along-track, cross-track and height directions. There is a general trend that the geopositioning precision (especially the height precision) is improved with the convergent angle of the two images increasing from several degrees to about 50°. Figure 2 shows the relationship between convergent angles and positional precision of the check points. It can be seen that with the increase of the convergent angles, the errors decrease with a pattern of power function.
Figure 2. The relationship between convergent angle and positional error
However, the best positional precision does not correspond to the largest convergent angle in the experiment, which leads to the speculation that there should be some other influence factors. In principle, the larger observation angles may lead to more severe geometric distortion in images and then make the matching between stereo images more difficult. Therefore, we investigate the relationship between the convergent angle and the matching precision by simulated images generated from the existing DEM and DOM products. For simulated image pairs with different convergent angles, the true image locations of the corresponding points are known; the matched locations are
compared with the true locations and the RMS differences of corresponding points are used as matching errors.
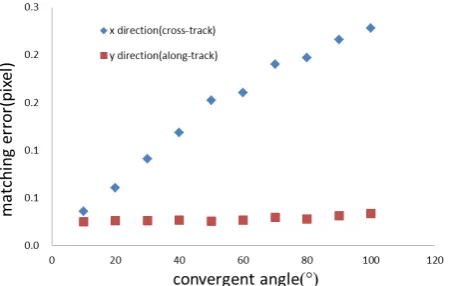
Figure 3. The relationship between convergent angle and matching error in image space
Figure 3 displays the matching errors in image space, from which it can be observed that with the increase of the convergent angles, the cross-track matching errors increase approximately linearly while the along-track precisions almost keep in the same sub-pixel level. Referring to the formulas for the standard deviations of the object point from a pair of convergent images (Wang, 1990), the image measurement errors (image matching errors) can be propagated to object geopositioning errors in cross-track, along-track and height directions, respectively, and Tis the overall positional error.
0 20 40 60 80 100 120
Figure 4. The relationship between convergent angle and geopositioning error with and without considering matching error
The left and right simulated images are totally symmetrical. In Figure 4, the results without considering the matching errors are shown with the symbol of “*” and the others are with the “○”.
When matching errors are involved, all errors are increased more all less and the turning point of the positional errors slightly moves to smaller convergent angle, which, to some degree, can explain our investigation results.
Furthermore, we analyse the correlation coefficients from the least squares matching result of each dual-image combination. Figure 5 illustrates the mean correlation coefficients of the tie points of every two NAC images with the positional precision shown for comparison. The two image pairs with the largest convergent angles have relatively smaller correlation coefficients, while the pair with the third largest convergent angle surpasses these two in precision because of its almost highest correlation coefficient. Meanwhile, there is an obvious trend that the correlation coefficients decrease (i.e., the image matching precision decreases) approximately linearly as the convergent angles get larger, though some points deviate from the fitted trend line due to other factors such as the radiometric inconsistency between stereo images. Therefore, we suggest that when selecting image pairs for 3D triangulation, both convergent angle and image matching error (depicted by correlation coefficient) should be taken into consideration to produce the best precision.
Figure 5. The correlation coefficient of every NAC image pair
3.3 Geopositioning precision of multiple images
The investigations of geopositioning precision of multi-images are carried out through a progressive strategy. Firstly, the image pair with the highest precision from section 3.2 is selected and the other 7 images are added to the pair in turn to form 3-image stereos. The geopositioning precision is evaluated by check points and the group with the minimum error is chosen for the next step, in which the other 6 images are added in turn to form 4-image stereos. The process repeats until the 9-image 3D triangulation is reached.
The results indicate that adding one or more images to a stereo pair, the resultant precision may or may not be improved depending on the geometric configuration. Using all the 9 images for 3D triangulation, the precisions are0.50 m, 0.60 m, 1.23 m in along-track, cross-track, and height directions, which are better than most combinations of two or more images. However, when fewer images are selected, the precision could be better than that using all 9 images.
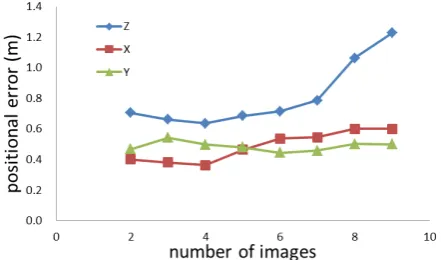
Figure 6 displays the relationship between the 3D precision and the number of images used. The errors in horizontal direction do not change too much as more images are involved for 3D triangulation, while the vertical errors decrease then increase from slowly to sharply with the turning point at the number of 4 images, which has the precision of 0.36 m, 0.50 m and 0.64 m.
Figure 6. The relationship between the number of images and the geopositioning precision in object space.
4. CONCLUSIONS
This research analyses the 3D geopositioning precision of multi-image triangulation with 9 LROC NAC images obtained around CE-3 landing site. The results of stereo image pairs with different combinations of the 9 images are compared and the relationship with convergent angles is studied. The results reveal that in general, the geopositioning precision (especially the height precision) is improved with the increase of the convergent angle between two images from several degrees to about 50°. However, the best precision does not come from the stereo pair with the largest convergent angle. Thus, the influence of convergent angles on matching precision is analysed by simulation and the geopositioning precision with the consideration of matching errors is re-calculated. The investigations reveal that with increase of the convergent angle, the height error and the overall positional error firstly decrease and then increase at turning points of about 90° and 60° respectively; and when matching errors are considered, the turning points slightly move to smaller convergent angle. Besides, we also compare the correlation coefficients of the pairs with different convergent angles and suggest that to produce the best geopositioning precision, both the convergent angle and the matching error between images should be considered.
Based on the analysis of two images, the other 7 images are added one by one to investigate multi-image geopositioning. The results show that the geopositioning precision may or may not be improved when more images are involved depending on the geometric configuration. Using all 9 images for triangulation, the precisions are better than most combinations of two or more images, while triangulation of selected fewer images could produce better precision than that using all the images. In this research, selection of effective images for multi-image triangulation has been realized in a simple and heuristic way. In the future, in-depth theoretical analysis will be conducted aiming to derive an automatic algorithm to select most effective images for achieving the best geopositioning precision from multiple images.
ACKNOWLEDGMENTS
This study was supported in part by National Key Basic Research and Development Program of China under Grant 2012CB719902 and in part by National Natural Science Foundation of China under Grant 41590851 and 41301528. We would like to thank the LROC team (NASA/GSFC/Arizona State University) for making the LROC NAC images available online.
REFERENCES
Di, K., Y. Liu, B. Liu, M. Peng and W. Hu, 2014. A Self-calibration bundle adjustment method for photogrammetric processing of Chang'E-2 stereo lunar imagery. IEEE Transaction on Geoscience a nd Remote Sensing, 52(9), pp.5432-5442.
Di, K., R. Ma, and R. Li, 2003. Rational Functions and Potential for Rigorous Sensor Model Recovery. Photogrammetric Engineering and Remote Sensing, 69(1), pp. 33-41.
Kirk, R., B. Archinal, L. Gaddis and M. Rosiek, 2012. Lunar Cartography: Progress In The 2000s and Prospects for the 2010s. In: International Archives of the Photogrammery, Remote sensing and Spatial Information Sciences, B4, pp: 489-494.
Becker., K. J., B. A. Archinal, T. M. Hare, R. L. Kirk, E. Howington-Kraus, M. S. Robinson and M. R. Rosiek, 2015. Criteria for Automated Identification of Stereo Image Pairs. In: Lunar and Planetary Science Conference, Texas, USA, 46, pp: 2703.
Liu, B., Y. Liu, K. Di and X. Sun, 2014. Block adjustment of Chang'E-1 images based on rational function model. In: Remote Sensing of the Environment: 18th National Symposium on Remote Sensing of China, International Society for Optics and Photonics, pp: 91580G-91580G.
Liu, B., K. Di, B. Wang, G. Tang, B. Xu, Z. L. and Z. Liu, 2015a. Positioning and precision validation of Chang'E-3 Lander based on multiple LRO NAC images (in Chinese). Chinese Science Bulletin, 60, pp: 2750-2757.
Liu, Y. and K. Di, 2011. Evaluation of Rational Function Model for Geometric Modeling of Chang’E-1 CCD Images. In: International Achieves of the Photogrammetry, Remote Sensing and Spatial Information Sciences, Guilin, China, Vol. 38, Part 4/W25, pp:121-125.
Liu, Z., K. Di, M. Peng, W. Wan, B. Liu, L. Li, T. Yu, B. Wang, J. Zhou and H. Chen, 2015b. High precision landing site
mapping and rover localization for Chang’e-3 mission. Science China -physics Mechanics & Astronomy, 58(1), pp: 1-11.
NAIF, 2014. Lunar Reconnaissance Orbiter Camera (LROC) Instrument Kernel v18. http://naif.jpl.nasa.gov/pub/naif/pds/ data/lro-l-spice-6-v1.0/lrosp_1000/data/ik/.
Radhadevi, P., V. Nagasubramanian, S. Solanki, T. Sumanth, J. Saibaba and G. Varadan, 2011. Rigorous Photogrammetric Processing of Chandrayaan-1 Terrain Mapping Camera (TMC)
Images for Lunar Topographic Mapping. In: Lunar and Planetary Science Conference, Texas, USA, 42, pp: 1384. Robinson, M., S. Brylow, M. Tschimmel, D. Humm, S. Lawrence, P. Thomas, B. Denevi, E. Bowmancisneros, J. Zerr, M. Ravine, M. Caplinger, F. Ghaemi, J. Schaffner, M. Malin, P. Mahanti, A. Bartels, J. Anderson, T. Tran, E. Eliason, A. Mcewen, E. Turtle, B. Jolliff and H. Hiesinger, 2010. Lunar Reconnaissance Orbiter Camera (LROC) instrument overview. Space Science Reviews, 150, pp: 81-124.
Scholten, F., J. Oberst, K. Matz, T. Roatsch, M. Wahlisch, P. Glaser, M. Robinson, E. Mazarico, G. Neumann, M. Zuber and D. Smith, 2011. Complementary LRO Global Lunar Topography Datasets — A Comparison of 100 Meter Raster DTMs from LROC WAC Stereo (GLD100) and LOLA Altimetry Data. In: Lunar and Planetary Science Conference, Texas, USA, 42, pp: 2080.
Tran, T., E. Howingtonkraus, B. Archinal, M. Rosiek, S. Lawrence, H. Gengl, D. Nelson, M. Robinson, R. Beyer, R. Li, J. Oberst and S. Mattson, 2010. Generating Digital Terrain Models from LROC Stereo Images with SOCET SET. In: Lunar and Planetary Science Conference, Texas, USA, 41, pp: 2515. Wang, Z., 1990. Principles of Photogrammetry (with Remote Sensing). Press of Wuhan Technical University of Surveying and Mapping and Publishing House of Surveying and Mapping. Beijing, pp: 327-330.