AUTOMATIC RAILWAY POWER LINE EXTRACTION USING MOBILE LASER
SCANNING DATA
Shanxin Zhanga,b, Cheng Wanga,∗, Zhuang Yanga, Yiping Chena, Jonathan Lia,c
a
Fujian Key Laboratory of Sensing and Computing for Smart Cities, School of Information Science and Engineering,Xiamen, FJ 361005, China - [email protected],[email protected],[email protected],[email protected]
b
Xizang Key Laboratory of Optical Information Processing and Visualization Technology, Information Engineering College, Xizang Minzu University, Wenhuidong Street, Xianyang,SX 712082, China - [email protected] c Mobile Mapping Lab, Department of Geography and Environmental Management, University of Waterloo,
Waterloo, ON N2L 3G1, Canada - [email protected]
Commission V, WG V/3
KEY WORDS:Power line extraction, Mobile laser scanning, Quaternion algorithm, Hough voting, Point cloud
ABSTRACT:
Research on power line extraction technology using mobile laser point clouds has important practical significance on railway power lines patrol work. In this paper, we presents a new method for automatic extracting railway power line from MLS (Mobile Laser Scanning) data. Firstly, according to the spatial structure characteristics of power-line and trajectory, the significant data is segmented piecewise. Then, use the self-adaptive space region growing method to extract power lines parallel with rails. Finally use PCA (Principal Components Analysis) combine with information entropy theory method to judge a section of the power line whether is junction or not and which type of junction it belongs to. The least squares fitting algorithm is introduced to model the power line. An evaluation of the proposed method over a complicated railway point clouds acquired by a RIEGL VMX450 MLS system shows that the proposed method is promising.
1. INTRODUCTION
Railway power supply security is closely related to our everyday life and industrial activities. Power interruptions may lead to se-riously railway traffic accident. The inspection of railway power line is an important work of railway maintenance management departments. In order to prevent and eliminate railway traffic ac-cident caused by power interruptions and ensure the safety of the operation of electric power line, railway maintenance manage-ment departmanage-ment need to spend a lot of manpower and material resources to inspect power line every year. Currently, with the rapid development of remote sensing technology, remote sens-ing technology has been used more and more widely in power line extraction. Most of utility companies are endeavouring to find the more cost-effective techniques to obtain clearances and improve access to the power lines, which could be achieved by using the latest state-of-the-art remote sensing equipment such as digital camera and LiDAR system.
In recent years, many research works have been carrying out using Airborne LiDAR data for automatic detection and extrac-tion of power lines. They applied many valid methods to recon-struct 3D power lines using airborne LiDAR point clouds such as the Random Sample Consensus (RANSAC) method (Chen et al., 2012), Markov Random Field (MRF) classifier (Sohn et al., 2012), Hough Transform method (Liu et al., 2009) and Random Forests classification method (Kim and Sohn, 2013). But there two defects exist in airborne laser scanning system lead to it im-possible implement very well in railway power line detection. On the one hand, although the recent airborne laser scanning system is being applied in power line detection, few companies can af-ford such a cost. On the other hand, its no way to access to the point cloud data to detect the power line under the circumstance
∗Corresponding author
of in railway station and in tunnel.
MLS system is developed rapidly in recent years. It has a unique advantage in the quick access to the ground surface information. And furthermore, MLS can produce extremely higher density point clouds, generating digital elevation models with cm-level resolution, while most of ALS systems only have a 50 cm-level resolution. Research on mobile laser point cloud data in power line extraction technology has important practical significance on railway power lines patrol work. (Lehtom¨aki et al., 2010) pro-posed an automatic method to extract pole-like objects from ML-S data. (Cheng et al., 2014) presented a method to extract power line points using a voxel-based hierarchical method, and then the point densities of neighboring voxels are calculated for further fil-tering. (Guan et al., 2014) proposed to extract power-line points in the identified non-road points, followed by Hough transform and Euclidean distance clustering.
2. ACUISITION
This section includes two parts. One part is presentation the mo-bile laser scanning system, the other part is to explain the data source.
2.1 Mobile laser scanning system
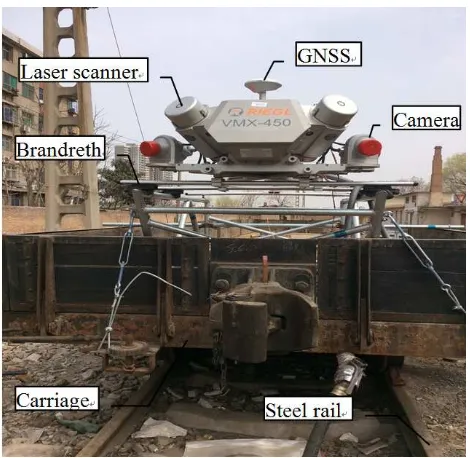
MLS system uses car as remote sensing platform and compris-es four parts: (1) a high-precision dynamic Global Navigation Satellite System (GNSS), (2) high dynamic carrier posture sensor Inertial Measurement Unit (IMU), (3) fully-integrated calibrat-ed laser scanners, (4) optional camera sub-system. GNSS/IMU component provides positioning informant to sensor and makes the vehicle-mounted system has the ability of direct location. Laser scanner can scan out with a high density of point cloud data. Op-tional camera provides color information to point cloud data.
The RIEGL VMX-450 Mobile Laser Scanning System (as Fig-ure 1 shows) offers extremely high measFig-urement rates providing dense, accurate, and feature-rich data even at high driving speed-s. It can apply to fast 3D data collection, featuring high accuracy and high resolution, provides a basis for a variety of applications like mapping of roadways and rail corridors.
Figure 1. RIEGL VMX-450 system
2.2 Data Resources
The data resources were acquired by a RIEGL VMX-450 system which installed on the train. The train was traveling at 120 miles an hour when scanning the scene. The point density is approx-imately 3 000 points per square meter. The point cloud data is shown as Figure 2. The power lines point density is very big. Through this picture we can see that the power lines in the real surrounding is very complex.
3. METHOD
There are some fixed priors that are fit to the extraction of power line points in railway circumstance. For example, power lines,
Figure 2. Railway power line point cloud data
horizontal suspension lines and trajectory parallel with rail; pow-er line and horizontal suspension line appears in pairs and the horizontal suspension line above the power line; the power line above the trajectory and so on.
The proposed method follows three steps: significant point cloud data segment, power line extraction, joint region judgement.
3.1 Point cloud segment
The point cloud segment is very important. We can filter out the ground point by this step.
In order to obtain the width of power line area, we use feature of that there are protective fences between edge of railways and protective fences elevation higher than trajectory (as Figure 3 shows). The trajectory coordinates are known. We can get width of significant point cloud which is perpendicular to trajectory.
Figure 3. Protective fence
Note that, trajectory about 2m above rails. Through the feature that horizontal suspension wire power line is located more than 4m above the trajectory according to the power line construction standards (between 5.7m to 6.5m in china), we got the height range of the power line.
The significant point cloud data extraction result as shown in Fig-ure 4.
Figure 4. Result of significant point cloud segmentation
3.2 Power line extraction
In order to automatic and fast extraction the power line in com-plex rail circumstance, we presented an algorithm of self-adaptive space region growing method.
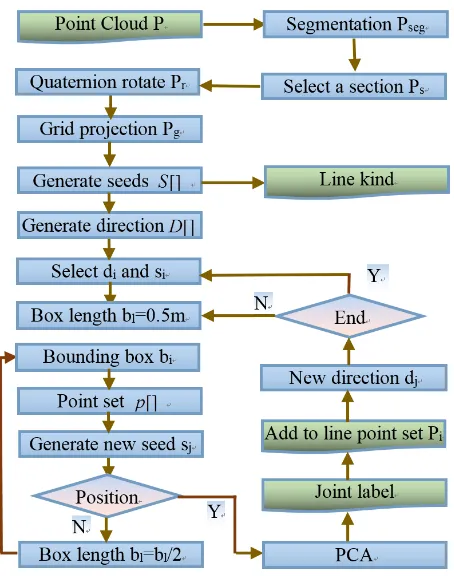
The algorithm idea of self-adaptive space region growing method as follows. Generate seeds. Select a point as seed and a growth direction in the initial position of cloud. Generate a cross section according seed and its direction and make it to grow at a scalable length. Using PCA and information entropy to determine the la-bel of the power line point cloud which is included in the growth space. Generate a new seed and a new direction overlap it again until this seed end. Select the other seed until all seeds have been selected. The process flow of point line extraction as shown in Figure 5.
First of all, we should generate the seeds and their corresponding directions. The detailed steps are as follows.
1. Acquire a section point cloudpsalong trajectory form
seg-mentation point cloudpsegand rotate it to a vertical plane
which normal vector is trajectory direction. We label the vertical plane withpgand mark the rotated point cloud with
pr. Divide grid inpgand projectprintopg.
2. Select a grid when the number of points in a grid greater than a threshold. Add those points into arrayP L[]. 3. Selectnpoints which has maximum n values in Z axis
(tra-jectory direction) inP L[]. Compute the central position of those points to generate a new point as seedsiand addsi
intoS[]. If two grid both include seed and one grid above another grid in vertical direction, then the seed in down grid is power line seed, label its line kind with power line. The seed in upon grid is horizontal suspension wire seed, label its line kind with horizontal suspension wire.
4. Select n points which has minimumnvalues in Z axis (tra-jectory direction) inP L[]. Compute the central position of those points to generate a new pointri. Add the direction of
ritosiinto direction arrayD[].
5. Jump into step 2 until all grids which points greater than a threshold are computed.
Then, we select one seed and its direction to extract a power line and find out the junction area witch joint with vertical suspension line in the power line.
Figure 5. Point line extraction flow
1. Select a seedsiand its directiondi.
2. Initialize the box lengthblequals a value such as 0.4 m.
3. Use seed point as central position to generator a square which side length equalsa. The square represent a planar model, and together with a given length bl, generates a 3D polyg-onal bounding boxbi. The bounding box is then used to
segment all points lying inside it. We store those points in point setp[].
4. Obtain points in a quarter of box length in the last part. If number of points not equal to zero, then compute the centre of those points to generate new seedsjand jump into step
4, else set box lengthbl=bl/2, jump into step 3.
5. Set box lengthbi = 0.5. Use PCA method to judge the
point inp[]whether is line or joint and give it corresponding labels. Addp[]to line point setpi.
6. Use the directionsitosjgenerate a new directiondj.
7. If the distance betweensiandsjsmaller than a threshold,
then this power line extracted over, else jump into step 2.
Select other seed and its corresponding direction to extract its cor-responding line use step 1 to step 7 untilS[]equals null. Seed set
S[]equals null means that all power lines and horizontal suspen-sion lines has been extracted. And in this progress, we labelled every joint position and its joint type. Section 3.3 explain how do we classify the joint labels.
3.3 Joint region judgement
The main function of this part is to label pointpk inp[]which
segmented by bounding boxbi. We define three labels in our
by bounding box.
Labels Description
L[1] pkstraight power line
L[2] pk2D suspension joint
L[3] pk3D suspension joint
Table 1. Description of labels
3.3.1 Use PCA extracts space features: PCA is referred to as a dimensionality reduction algorithm. It tries to identify the subspace in which the data approximately lies. PCA will do more directly, and will require only an eigenvector calculation of co-variance matrix (Guebel and Torres, 2013). In this application, covariance matrix has three eigenvalues in eigenvector.
Select one pointpifrom point setp[]. Usepias centre and radius
a make a spheresphi. The sphere centre is a candidate joint
centre. The points include in the sphere are candidate joint points. Usesphito select points fromp[]. Apply PCA algorithm on those
selected point we can get three eigenvalues:λi 1,λi2,λi3.
1D linear features. The pointpishould be labelled asL[1].
2. Ifλi
1,λi2is much larger thanλi3, the points insphishow the
2D surface features. The pointpishould be labelled asL[2].
3. Ifλi 1,λ
i 2,λ
i
3almost have the same size, the points insphi
show the 3D spatial features. The pointpishould be labelled
asL[3].
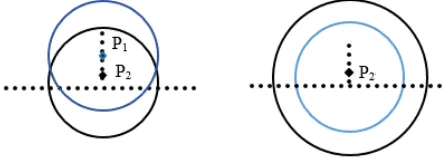
The size of the eigenvalue is related to the location ofsphiand
the size of the radius ofsphi. As in Figure 6 (a) shows,p1andp2
has different position, we haveλ1 1< λ
2
1, this result in accordance
withp1has less linear feature thanp2in the figure. As in Figure 6
(b) shows,p2as the sphere centre, the sphere has different radius,
we haveλ1 1< λ
2
1, this result shows thatp2represent more linear
feature in a larger area in accordance with figure described.
Figure 6. Eigenvalue changing in different location. (a) Sphere center is different. (b) Sphere radius is different.
We should select the most appropriate position as joint position. In order to select the accurate joint position, we use information entropy to evaluate the difference of those similar eigenvalue dis-tribution. For a point, we judge which joint label class it belongs to according to its entropy value in point setp[]. How to compute entropy value and how to use entropy value to classify the joint kind will be illustrated in section 3.3.2.
3.3.2 Information entropy evaluation: Information entropy is a measurement for the chaotic degree or dispersion degree of distribution (Rusinko and Ivasyuk, 1981). Eigenvalue distribute more dispersed, the smaller value of the information entropy. The
more concentrated the information entropy distribution, the larg-er the information entropy. We use it to evaluate the displarg-ersion of three eigenvalues.
There are three eigenvalues for per point. We should normalize them at first for comparing entropy value convenience. The Min-Max scaling normalize equation has been used and defines as:
ηi
where i= index of point
j= index of eigenvalue
λi
min= minimum value of three eigenvalues
λi
max= maximum value of three eigenvalues
The information entropy equation is defined as:
Entropy(i) =
a spheresphi. Then, compute three eigenvalues ofpifrom the
points insphi. Apply Eq.(1) and Eq.(2) to get entropy value. At
last, label this points joint kind according with Table 2 .
Entropy value Labels
Entropy(i)≥1.4 L[1] 0.9≤Entropy(i)<1.4 L[2]
Entropy(i)<0.9 L[3]
Table 2. Entropy value classification
The value 1.4 and 0.9 in table 2 come from the experience in the actual application for extracting power lines.
4. 3D POWER LINE FITTING
The purpose of 3D power line fitting is to reconstruct the 3D mod-el of power line. The least squares multiply fitting algorithm is introduced for model the power line. Because of power line mod-el is almost in keeping with the catenary curve (Guan et al., 2014). Catenary curve is described by the following equation.
z=a(x2+y2) +bpx2+y2+c
(3)
The polynomial parameters a, b, c should be computed by point cloud data.
5. RESULTS
platform is microsoft visual studio 2010.
In section 3, the segment length is 20cm in the process of select-ing a section to generate seed progress. The volume of boundselect-ing box is 10cm 10cm 50cm. The sphere radius mentioned in section 3.3 is set to be the length of cross sections polygon of bounding box.
Figure 7. Result of lines detection
As shown in Figure 7, power lines and horizontal suspension lines are separated from vertical suspension lines and electrical poles. The extracted lines are showing in blue. The experimental results demonstrated that power lines can be effectively and robustly ex-tracted from point clouds by our proposed method.
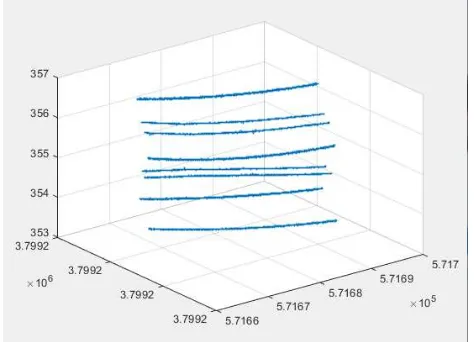
Figure 8. Result of lines detection
Figure 8 shows power lines model in the 3D space. The fitted power line can be well overlapped with the point cloud.
6. CONCLUSION
This paper presented an automated, effective power line detec-tion method for extracting power lines in railway surroundings. We utilized the self-adaptive space region growing method to ex-tract power lines. After that use PCA combine with informa-tion entropy theory method to judge this region of the power line whether junction or not and which joint kind it belongs to. During
the extraction result their fitted models, we conclude that the pro-posed method performs very well and achieves reliable results. How to use the relationship among power lines and the distance between power line and rail to find out which place violate the railway standard maybe the future work we should do.
ACKNOWLEDGEMENTS
This work described here is supported by the Xizang Minzu U-niversity scientific research project (No. 13myZP03) and Xizang Autonomous Region Natural science fund projects (No. 2015ZR-14-16).
REFERENCES
Chen, D., Zhang, L., Li, J. and Liu, R., 2012. Urban building roof segmentation from airborne lidar point clouds.International journal of remote sensing33(20), pp. 6497–6515.
Cheng, L., Tong, L., Wang, Y. and Li, M., 2014. Extraction of urban power lines from vehicle-borne lidar data.Remote Sensing 6(4), pp. 3302–3320.
Guan, H., Li, J., Zhou, Y., Yu, Y., Wang, C. and Wen, C., 2014. Automatic extraction of power lines from mobile laser scanning data. In:Geoscience and Remote Sensing Symposium (IGARSS), 2014 IEEE International, IEEE, pp. 918–921.
Guebel, D. V. and Torres, N. V., 2013. Principal component anal-ysis (pca).Encyclopedia of Systems Biologypp. 1739–1743.
Kim, H. B. and Sohn, G., 2013. Point-based classification of power line corridor scene using random forests. Photogrammet-ric Engineering & Remote Sensing79(9), pp. 821–833.
Lehtom¨aki, M., Jaakkola, A., Hyypp¨a, J., Kukko, A. and Kaarti-nen, H., 2010. Detection of vertical pole-like objects in a road environment using vehicle-based laser scanning data. Remote Sensing2(3), pp. 641–664.
Liu, Y., Li, Z., Hayward, R., Walker, R. and Jin, H., 2009. Clas-sification of airborne lidar intensity data using statistical analysis and hough transform with application to power line corridors. In: Digital Image Computing: Techniques and Applications, 2009. DICTA’09., IEEE, pp. 462–467.
Rusinko, K. and Ivasyuk, V., 1981. Elements of the mathemati-cal theory of inelastic deformation. Materials Science16(5), p-p. 400–405.