SHAPE AND ALBEDO FROM SHADING (SAfS) FOR PIXEL-LEVEL DEM
GENERATION FROM MONOCULAR IMAGES CONSTRAINED BY
LOW-RESOLUTION DEM
Bo Wua, Wai Chung Liua, Arne Grumpeb, Christian Wöhlerb
a Department of Land Surveying and Geo-Informatics, The Hong Kong Polytechnic University, Hung Hom, Hong Kong ([email protected], [email protected])
b Image Analysis Group, TU Dortmund, 44227 Dortmund, Germany (arne.grumpe, [email protected])
Commission VI, WG VI/4
KEY WORDS: Moon, DEM, Shape and Albedo from Shading (SAfS), Monocular Image
ABSTRACT:
Lunar topographic information, e.g., lunar DEM (Digital Elevation Model), is very important for lunar exploration missions and scientific research. Lunar DEMs are typically generated from photogrammetric image processing or laser altimetry, of which photogrammetric methods require multiple stereo images of an area. DEMs generated from these methods are usually achieved by various interpolation techniques, leading to interpolation artifacts in the resulting DEM. On the other hand, photometric shape reconstruction, e.g., SfS (Shape from Shading), extensively studied in the field of Computer Vision has been introduced to pixel-level resolution DEM refinement. SfS methods have the ability to reconstruct pixel-wise terrain details that explain a given image of the terrain. If the terrain and its corresponding pixel-wise albedo were to be estimated simultaneously, this is a SAfS (Shape and Albedo from Shading) problem and it will be under-determined without additional information. Previous works show strong statistical regularities in albedo of natural objects, and this is even more logically valid in the case of lunar surface due to its lower surface albedo complexity than the Earth. In this paper we suggest a method that refines a lower-resolution DEM to pixel-level resolution given a monocular image of the coverage with known light source, at the same time we also estimate the corresponding pixel-wise albedo map. We regulate the behaviour of albedo and shape such that the optimized terrain and albedo are the likely solutions that explain the corresponding image. The parameters in the approach are optimized through a kernel-based relaxation framework to gain computational advantages. In this research we experimentally employ the Lunar-Lambertian model for reflectance modelling; the framework of the algorithm is expected to be independent of a specific reflectance model. Experiments are carried out using the monocular images from Lunar Reconnaissance Orbiter (LRO) Narrow Angle Camera (NAC) (0.5 m spatial resolution), constrained by the SELENE and LRO Elevation Model (SLDEM 2015) of 60 m spatial resolution. The results indicate that local details are largely recovered by the algorithm while low frequency topographic consistency is affected by the low-resolution DEM.
1. INTRODUCTION
Lunar DEMs are mainly obtained from stereo photogrammetry or laser altimetry. Stereo photogrammetric processing requires coverage of a target area with stereo images and is able to produce DEMs with best resolutions of about three times of the image resolution. This domain focuses mainly on the imaging geometry while the image photometric content is often used for conjugate matching and imaging pose determination. While stereo coverage is a prerequisite, for some lunar orbiters such as the LRO, high resolution stereo (i.e. LRO NAC) availability is limited due to its orbital and mission design (Tran et al., 2010) and hence hindering the production of high resolution DEMs through stereo photogrammetry. On the other hand, Laser altimetry such as the Lunar Orbiter Laser Altimeter (LOLA) (Smith et al., 2010) produces global and highly reliable topographic information of the target body (i.e. the Moon) for various scientific purposes. However it is also characterized by its large sample spacing, resulting in low resolution DEMs (e.g. 1024 pixel-per-degree for LOLA DEMs), and utilizing the derived topographic products for high resolution purposes may introduce significant interpolation artifacts and thus limiting its applications.
Reflectance-based surface reconstruction methods estimate the 3-D surface shape solely based on the image photometric content; such methods are able to utilize the information captured in every pixel of one or more image(s) and reflect them on the resulted topography. Apart from its drawbacks of instability and solution ambiguity, it shows potential as a
complement to the existing DEM production method (i.e. stereo photogrammetry and laser altimetry) which are remarkably reliable and accurate on large scales (Kirk et al., 2003). The relatively simple surface albedo complexity of major planetary bodies of interest also favours such techniques to be involved in lunar and planetary mapping.
There are studies and implementations utilizing photometric reconstruction algorithms in lunar and planetary mapping (e.g. Horn, 1977, 1990; Kirk et al., 2003; Barron and Malik, 2011), where the terrain is reconstructed based solely on photometric information. Incorporating existing low resolution DEMs into SfS algorithms using single or multiple images (photometric stereo) has also been explored (Grumpe et al., 2014) and encouraging results have been achieved.
2. SHAPE AND ALBEDO FROM SHADING CONSTRAINED BY LOW RESOLUTION DEM
2.1 Framework of the approach
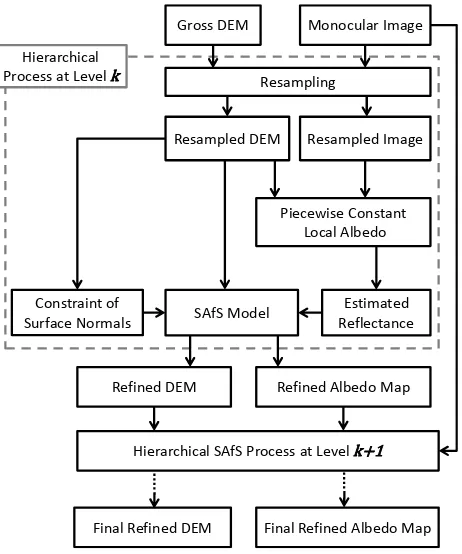
The general structure of the proposed method is outlined in Figure 1. Our algorithm adopts an iterative pyramid (hierarchical) structure throughout the optimization process starting from lowest resolution (i.e. resolution of the input gross DEM) and subsequently increases the resolution by a factor of 2 until it approaches pixel resolution of the image. At each level of the pyramid, the image is resampled to fit to the grid resolution of the DEM and the reflectance can be estimated by utilizing the albedo regularization strategy. Afterwards a least squares optimization is performed to adjust the surface heights (shape) to approach the estimated reflectance, constraints from the refined DEM of previous pyramid level is also introduced to regulate the optimization. Similar to other works (Horn, 1990; Grumpe et al., 2014), we optimize the DEM by a relaxation strategy where the grid node heights are adjusted one at a time assuming other heights are constants; the adjusted height will be updated immediately to the DEM. The final output of the hierarchical processing is a refined DEM and an albedo map with resolutions identical to the image resolution. Detailed procedures are described in the following sections.
Figure 1. Framework of the SAfS algorithm
2.2 Fundamentals of reflectance-based surface reconstruction
Reflectance-based surface reconstruction (e.g., SfS) has been extensively studied for more than half a century (Kirk et al., 2003). Such techniques recover object details based on the relation between the surface gradients (e.g. defined by slope and aspect), the illumination conditions and the recorded image intensity; in other words, reflectance-based surface reconstruction searches for a shape that is able to explain or produce the captured image.
The relationship between photometric image content and topology can be written as
(1) where I = image intensity
A = albedo
G(p,q) = topological reflectance p = surface normal in x direction q = surface normal in y direction
The reflectance model G(p,q) builds up the relationship between image photometric content and 3-D topography; these models relate surface gradients (slope and aspect), illumination conditions, surface photometric properties (i.e., albedo) and the resulting intensity captured in the image. Various models can be employed depending on applications and data, such as the estimation algorithm, this algorithm extracts profiles along the illumination direction named “characteristics” (Horn, 1977) and estimates the surface slopes and heights along profiles based on image intensities of the profiles, where the assumption is made that, amongst all combinations of slope and aspect, the slope along the illumination direction has the dominating effect on the resulting image reflectance. There are developments in extending photoclinometry to 2D such as (Kirk et al., 2003), but in this paper we keep the meaning of photoclinometry as 1-D profile-based.
Shape from Shading (SfS) is a 2-D based photometric surface reconstruction approach. Different from profile-based photoclinometry which controls the aspect to be sun-facing, SfS algorithms solve for both slope and aspect to explain the image intensity, thus having a high ambiguity but are more flexible.
2.3 Hierarchical shape reconstruction constrained by low-resolution DEM
The regularization of shape reconstruction is achieved by two distinct strategies: implicit regularization by computational and system design and explicit regularization by adding constraints into the optimization.
Figure 2. 3-by-3 Kernel over the DEM and its enclosed surface reflectance (i.e. G1 to G4)
At every height node of the relaxation scheme, we extract a 3x3 kernel and only the center node (i.e. the star in Figure 2) is
optimized. We define the surface normal of a cell by applying a finite difference operator on a 2x2 kernel of surface heights:
[
the center node; holding the surrounding heights as constants by the relaxation scheme retains local topography. The center height is optimized such that the four surrounding reflectances comply with the expected values computed from the piece-wise constant albedo assumption.The algorithm utilizes the Gauss-Seidel relaxation scheme which sequentially replaces the surface heights with newly computed values. As a result the sequence of computation within the relaxation algorithm has significant effects on the resulting DEM, especially at highly shaded or illuminated regions (e.g. craters, boulders). The refined DEM may apparently deviate from the desired topography due to the selection of the rendering sequence, which thus becomes another implicit shape constraint. In this paper we choose the rendering sequence to be in the same quadrant of the illumination direction: for example if the illumination is from southeast, the rendering sequence would start at bottom-right corner and end at upper-left corner.
The algorithm adopts an iterative hierarchical structure throughout the optimization process, starting from lowest resolution. We include the DEM constraint into the algorithm by encouraging the low-pass component of a group of surface normals to approach their counterparts in the previous pyramid level. As we up-sample the DEM by a factor of 2, a DEM cell is optimization because we are aware of topographic inaccuracies of the gross DEM (see Figure 5a, the crater is not captured by the gross DEM) that may further flatten the results.
As we base every shape constraint on the refined DEM of the previous pyramid level, we are aware that the result may slowly deviate from the original topography, which is not considered apparent in our experiments; on the other hand, constraining shape using original gross DEM may increase optimization stability while sacrificing some extent of local details.
2.4 Locally varying albedo
A terrain cannot be properly refined if the albedo is not reasonably estimated pixel-wise, however such an optimization system with only one image would be under-determined without regularization; therefore we did not bundle albedo optimization with shape refinement, instead, we separately estimate the albedo. While the constant albedo assumption is often plausible in lunar and planetary mapping (Horn, 1990; Kirk et al., 2003), previous works on natural image statistics (Huang and Mumford, 1999) and Shape from Shading (Alldrin et al., 2007; Barron and Malik, 2011) assume a specific statistical behaviour of the albedo, that albedo values tends to be highly concentrated and the difference between adjacent albedo is very small, effectively suggesting a piece-wise constant albedo assumption.
In our algorithm we adopt the piece-wise constant albedo assumption which maximizes surface detail recovery by a reasonable extent. Such assumption is implemented by first taking the log of Equation (1) which linearizes the relationship:
(4)
If we consider the log intensity difference between adjacent pixels, the relationship becomes
(5)
Applying the piece-wise constant albedo assumption, equation (6) can be simplified to:
(6)
The log reflectance is estimated to satisfy equation (7), and we extend the idea to a 2x2 kernel leading to the relationship
[ [*].computed using the operator in Equation (3).
The optimization of the DEM is achieved by utilizing the estimated reflectance map and minimizing the error term
∑{ [ ] } [ (
)]
(9)
where the first term refers to reflectance and the second term refers to the DEM shape constraint, while are the weights for each term.
A refined DEM is generated after optimization; it is then up-sampled for the next level of the hierarchy until the DEM resolution reaches the resolution of the image. The subsequent new albedo map is then computed from the image and the refined DEM.
3. EXPERIMENTAL ANALYSIS
3.1 Datasets
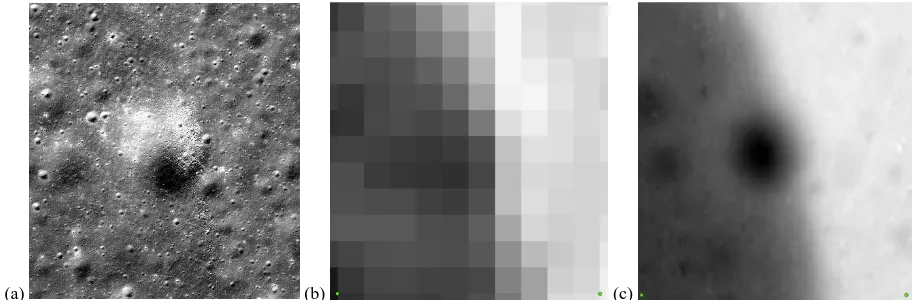
We tested our algorithm on a typical area on lunar surface (refer to Figure 3). The area was selected by its topological complexity. It contains:
An edge of a rima which splits the region into highland and lowland
A comparatively larger crater located right at the edge of the rima
Groups of small boulders scattered around the larger crater Groups of small craters all over the region
We used the LRO NAC image (0.5 m/pixel) (image pair no. M173246166, downloaded from http://lroc.sese.asu.edu/) and ortho-rectified by the software ISIS3 as the sole input image. The image is projected to a Mercator system and the region is covered by 1382x1262 pixels. For the low-resolution DEM, the co-registered SLDEM2015 of the area is utilized (http://pds-geosciences.wustl.edu/missions/lro/lola.htm). SLDEM2015 is the DEM created from LOLA data and images of the Japanese Selenological and Engineering Explorer (SELENE) terrain camera (TC) (Barker et al., 2015). The SLDEM2015 has a resolution of 60 m and covers the testing region with only 12x11 pixels (Figure 3b). The crater spans across a few cells of the SLDEM2015 and its morphology was not properly captured by the SLDEM2015, solving these issues might help to increase the performance of SAfS for low resolution DEM refinement.
Figure 3c shows another DEM (referred to as NAC DEM) with a resolution of 3 m, which was generated from stereo NAC images through photogrammetric process (Wu et al., 2014) and is employed in this study for comparison purposes.
(a) (b) (c)
Figure 3. (a) The LRO NAC image (0.5 m/pixel), (b) SLDEM2015 (60-m resolution); and (c) NAC DEM (3-m resolution) for comparison purpose.
3.2 Experimental results
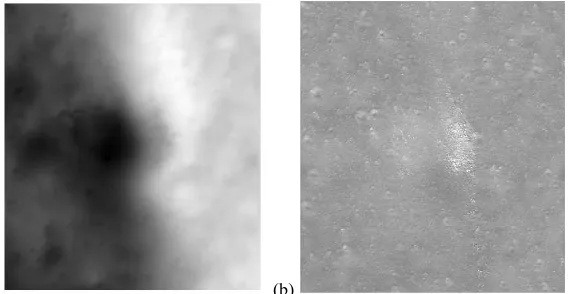
After applying our SAfS algorithm to the testing data, the final refined DEM and albedo map were obtained, which are shown in Figure 4. Figure 5 provides a side-by-side comparison of our refined DEM with the gross SLDEM2015 and the NAC DEM in 3-D visualization.
From Figures 4 and 5, it can be noticed that the refined DEM from our SAfS algorithm shows promising local detail recovery compared with the other two DEMs. We also noticed that the refined albedo map to some extent contains topographic details and slight shades, which implies that a small extent of topographic detail is suppressed by shape constraints and is eventually attributed to the albedo.
(a) (b)
Figure 4. (a) The refined DEM obtained with our SAfS algorithm and (b) the refined albedo map of the region.
(a) (b) (c)
Figure 5. 3-D views of (a) the refined DEM (0.5 m/pixel) obtained with our SAfS algorithm, (b) the SLDEM2015 (60-m resolution) used as constraint, and (c) the NAC DEM (3-m resolution) used for comparison.
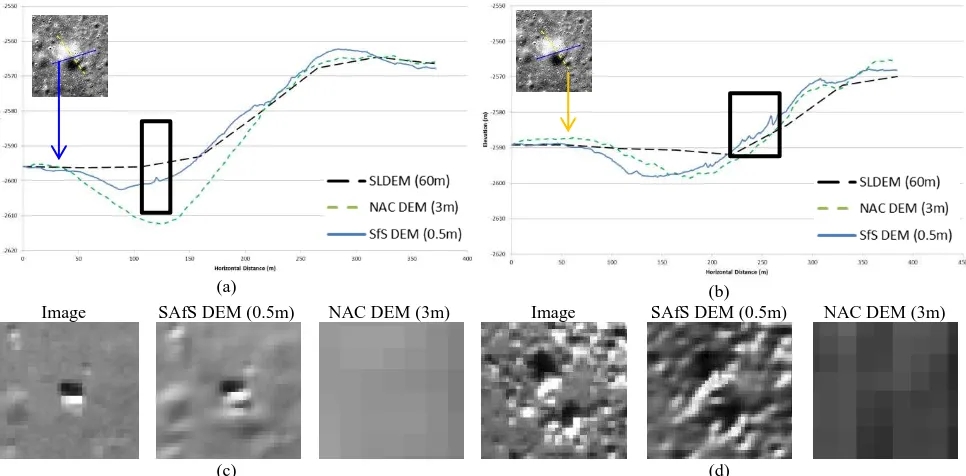
Figure 6 shows the result of a detailed profile comparison. Two reference lines crossing the crater area were selected, and for each reference line three elevation profiles were interpolated from the three DEMs. The profile comparison presents a shape that deviates from the NAC DEM, especially in Figure 6a where the depth of the crater in the refined DEM is around 10 m shallower than its counterpart in the NAC DEM. Such deviations are likely due to the large resolution differences between the input image and the gross DEM (i.e. 0.5 m resolution for the image and 60 m for the SLDEM).
(a) (b) Image SAfS DEM (0.5m)
(c)
NAC DEM (3m) Image SAfS DEM (0.5m)
(d)
NAC DEM (3m)
Figure 6. (a) Profile comparison for reference 1, (b) profile comparison for reference 2, (c) local regions of the image, SAfS DEM, and NAC DEM corresponding to the box mark in (a) showing a boulder at the bottom of the crater, and (d) local regions of the image, shaded SAfS DEM, and shaded NAC DEM corresponding to the box mark in (b) showing boulders on the crater slope.
4. CONCLUSIONS AND DISCUSSION
In this paper we have presented a SAfS algorithm. With a single image and a low-resolution DEM, a refined DEM at image pixel level as well as its corresponding albedo map have produced by the proposed algorithm.
Encouraging results have been shown, especially regarding the recovery of local detail. Areas where very small boulders and craters captured by the image are not presented in both the low resolution SLDEM (60 m) and the higher resolution NAC DEM (3 m) have been reconstructed and preserved in our refined DEM (0.5 m). Slight shadows and shades are incorporated in the albedo map, which will be our next step to improve.
On the other hand, geometric deviations between the refined DEM and the NAC DEM have been spotted. These areas are mainly craters that are covered by only a few cells in the input DEM. We conclude that inaccuracies in the low resolution DEM will cause visible effects in the large scale topography of the refined DEM, as the large scale terrain is largely determined in the initial stages of the hierarchical process. The importance of self-correction at the initial stages is thus emphasized.
Future work will be to further assess the robustness of the algorithm and to allow the algorithm to be able to correct the large scale components of the input DEM before SAfS refinement as well as reducing shading and shadow components that remain in the final refined albedo.
ACKNOWLEDGMENTS
The work was supported by a grant from the Research Grants Council of Hong Kong (Project No: PolyU 152086/15E) and a grant from the National Natural Science Foundation of China (Project No: 41471345).
REFERENCES
Alldrin, N. G., Mallick, S. P., Kriegman, D. J., 2007. Resolving the generalized bas-relief ambiguity by entropy minimization. 2007 IEEE Conference on Computer Vision and Pattern Recognition, Minneapolis, MN, USA, pp. 1-7.
Barker, M. K., E. Mazarico, G. A. Neumann, M.T. Zuber, J. Haruyama, D.E. Smith, 2015. A new lunar digital elevation model from the Lunar Orbiter Laser Altimeter and SELENE Terrain Camera, Icarus, doi:10.1016/j.icarus.2015.07.039.
Barron, J. T. and Malik, J., 2011. High-frequency shape and albedo from shading using natural image statistics. 2011 IEEE Conference on Computer Vision and Pattern Recognition, Providence, RI, USA, pp. 2521-2528.
Grumpe, A., Belkhir, F., Wöhler, C., 2014. Construction of lunar DEMs based on reflectance modelling. Advances in Space Research, 53, pp. 1735-1767.
Hapke, B., 2002. Bidirectional Reflectance Spectroscopy. 5: The coherent backscatter opposition effect and anisotropic scattering. Icarus, 157 (2), pp. 523-534.
Hapke, B., 2012. Theory of Reflectance and Emittance Spectroscopy. 2nd edition. Cambridge University Press, Cambridge, UK.
Horn, B. K. P., 1977. Understanding Image Intensities. Artificial Intelligence, 8(2), pp. 201–231.
Horn, B. K. P., 1990. Height and Gradient from Shading. International Journal of Computer Vision, 5(1), pp. 37–75.
Huang, J. and Mumford, D., 1999. Statistics of Natural Images and Models. 1999 IEEE Computer Society Conference on Computer Vision and Pattern Recognition, Fort Collins, CO, USA, Vol. 1, pp. 541-547.
Kirk, R. L., Barrett, J. M., Soderblom, L. A., 2003.
Photoclinometry made simple…?. ISPRS Commission IV, Working Group IV/9, Workshop “Advances in Planetary Mapping”, Houston, TX, USA.
McEwen, A.S., 1991. Photometric functions for photoclino-metry and other applications. Icarus, 92 (2), pp. 298-311.
Smith, D.E., Zuber, M.T., Jackson, G.B., Cavanaugh, J.F., Neumann, G.A., Riris, H., Sun, X., Zellar, R.S., Coltharp, C., Connelly, J., Katz, R.B., Kleyner, I., Liiva, P., Matuszeski, A., Mazarico, E.M., McGarry, J.F., Novo-Gradac, A.-M., Ott, M.N., Peters, C., Ramos-Izquierdo, L.A., Ramsey, L., Rowlands, D.D., Schmidt, S., Scott III, V.S., Shaw, G.B., Smith, J.C., Swinski, J.-P., Torrence, M.H., Unger, G., Yu, A.W., Zagwodzki, T.W., 2010. The Lunar Orbiter Laser
Altimeter Investigation on the Lunar Reconnaissance Orbiter Mission. Space Science Reviews, 150, pp. 209-241.
Tran, T., Rosiek, M. R., Beyer, R. A., Mattson, S., Howington-Kraus, E., Robinson, M. S., Archinal, B. A., Edmundson, K., Harbour, D., Anderson, E., the LROC Science Team, 2010. Generating Digital Terrain Models Using LROC NAC Images.
ISPRS Commission VI, Working Group VI/4, “A special joint
symposium of ISPRS Technical Commission IV & AutoCarto
in conjunction with ASPRS/CaGIS”, Orlando, Florida, USA.