OCEANOGRAPHIC MOWER CRUISE
J. Valencia a, *, G. Ercilla b, F.J. Hernández-Molina c, D. Casas d a
PhD candidate Dept. of Cartography and Land, University of Salamanca, Spain - [email protected] b
Institute of Marine Sciences, CSIC, Spain - [email protected] c
Dept. Earth Sciences, Royal Holloway Univ. London, England - [email protected] d
Geological and Mining Institute of Spain-IGME, Spain - [email protected]
Commission V
KEY WORDS: ROV, Three-dimensional, WCS, Artificial Vision, GIS, Oceanography, Modelling
ABSTRACT:
The MOWER Cruise has executed a geophysics and geologic expedition in the Gulf of Cádiz (sector adjacent to the Strait of Gibraltar) and west off Portugal, in the framework of the coordinate research project MOWER “Erosive features and associated sandy deposits generated by the Mediterranean Outflow Water (MOW) around Iberia: paleoceanographic, sedimentary & economic implications” (CTM 2012--‐39599--‐C03). The main aim of this project is to identify and study the erosional features (terraces and channels) and associated sedimentary deposits (sandy contourites) generated by the Mediterranean Water Masses around the middle continental slope of Iberia (The Mediterranean Outflow Water – MOW – in the Atlantic margins), their Pliocene and Quaternary evolution and their paleoceanographic, sedimentary and economic implications. This objective directly involves the study of along-slope (contourite) processes associated with the MOW and across--‐slope (turbiditic flows, debris flows, etc.) processes in the sedimentary stacking pattern and evolution of the Iberian margins. The MOWER project and cruise are related to the Integrated Ocean Drilling Program (IODP) Expedition 339 (Mediterranean Outflow). It is also linked and coordinated with CONDRIBER Project “Contourite drifts and associated mass--‐transport deposits along the SW Iberia margin – implications to slope stability and tsunami hazard assessment” (2013--‐2015) funded by the Fundação para a Ciência e Tecnologia, Portugal (PTDC/GEO--‐ GEO/4430/2012).
* Corresponding author.
1. INTRODUCTION
The MOWER Cruise started and ended at the Port of Vigo, was carried on board of the RV Sarmiento de Gamboa, from September 1 to October 5 in2014, and was divided into two legs. The first Leg, with an extension of 12 days, was developed in the Gulf of Cadiz. The second Leg lasted about 23 days in the Gulf of Cadiz and west off Portugal. The objectives of the MOWER Cruise have been: 1) to determine the latest (Holocene) sedimentary, oceanographic and paleoceanographic processes; 2) to establish the Pliocene and Quaternary evolution of the erosional features and associated sandy contourites, particularly dealing with sedimentological aspects and addressing geohazards deducted from such evolution; and 3) to characterize the influence and control in a large--‐scale of the continental margin prior to and during the development of the erosional features and associated sandy contourites. The data acquired during the 35 days of cruise consisted in single--‐channel seismic (airguns and parasound), scientific and multibeam echosounder systems, and sediment samplings (van been drag and box and gravity corers). On selected areas, the Portuguese ARGUS ROV system was deployed.
The cruise was led by: the XM--‐1 research group from the Dpto. de Geociencias Marinas from University of Vigo (UVI); the Continental Margins research group from the ICM--‐Consejo Superior de Investigaciones Científicas--‐CSIC (Barcelona), and members from the area of Marine Geology of the Instituto Geológico y Minero de España--‐IGME (Madrid). In addition, other national and international institutions have actively participated as the Instituto Hidrográfico de la Marina
(IHM); the University of Salamanca, and the Instituto Español de Oceanografía--‐IEO (Málaga); Royal Holloway Univ. RHUL, London (UK); Istituto Nazionale di Oceanografia e di Geofisica Sperimentale--‐ OGS, Trieste (Italy); Divisão de Geologia e Georecursos Marinhos--‐IPMA, Lisboa (Portugal); EMEPC, (Portugal); and the University of La Sapienza, Roma (Italy).
The paper is structured as follows: In section two we will overview different aspects of all the works that was developed during the cruise. Section three is devoted to explain de bathymetric works, with different developments designed to publish the information for cooperative work and for divulgative purposes. In section four the works with the ROV are described also with problems and advantages founded in its use with the developments needed for subsequent analysis of the information. In the fifth section part of the rest of geophysical work and sampling that took place during the cruise are described. Finally the conclusions and the objectives achieved are given in section six.
2. THE MOWER CRUISE
2.1 Overview
The purpose of MOWER Project is to identify and study the erosional features (terraces and channels) and associated sedimentary deposits (mainly sandy contourites / sandy silt) generated by the Mediterranean Outflow Water around the middle slope of Iberia, the MOW (Fig. 1) and its evolution in The International Archives of the Photogrammetry, Remote Sensing and Spatial Information Sciences, Volume XL-5/W5, 2015
the Pliocene and Quaternary and its paleoceanographic, sedimentary and economic implications.
This objective necessarily involves the study of longitudinal processes (contourites) associated with MOW and the transverse processes (turbidites, etc.) involved in the structure and evolution of the margin of Iberia (Hernandez - Molina et al., 2011).
Figure 1. Scheme where the circulation of the major bodies of water in the Gulf of Cadiz and west of Portugal is shown
(adapted from Hernandez - Molina et al., 2011).
The research Includes:
a) Acquisition of new data in two areas of the slope of the margins around Iberia (Gulf of Cadiz and west of Portugal) b) Compilation and analysis of previous data, either obtained
in the framework of previous projects or assigned by companies in the Alboran Sea and margins of Galicia and Cantabria
c) Integration and analysis of the results obtained recently in the IODP Expedition 339.
This scientific purpose is self - supported conceptually, but also has clear economic implications. The interaction of a body of water with the seabed generates erosive and depositional features that create large and sedimentary thicknesses contourite depositional systems (SDCs). However, sometimes mixed systems are generated when these processes are interrelated with perpendicular (down - slope) or gravitational processes. The study of these SDCs has been one of the active research areas in Marine Geology internationally over the past decade for its stratigraphic interest, sedimentological, paleoceanographic, paleoclimatology, by their relationship to sedimentary processes instability and its relationship directly with potential mineral and energy deposits.
The results of this campaign will:
1. Determine the evolution of the dynamic of MOW and its global implications.
2. Establish the interrelation of longitudinal processes (contourites) and transverse (turbidites) and its implications for the development of bad known mixed sedimentary systems, but explain the presence of levels of arenas (and / or sandy silt) reworked or selected in submarines deep sedimentary environments, something that may have economic implications for the prospect for hydrocarbons. 3. Establish a benchmark for contourites sedimentation, with
both morphological and depositional conceptual implications on continental margins.
4. Determine the paleogeography/ paleophysiography and sedimentary paleoenvironment of non contourite depositional systems that are responsible, involved or favor the creation of erosive features and sandy contourite deposits associated.
5. Check the recent tectonic role as a key factor in the medium and long term has controlled the evolution of depositional systems, particularly erosive features and associated deposits.
2.2 Leg 1: Gulf of Cádiz
The first leg of the cruise starts on September 3, 2014 at 15:42 and ends on 12 September at 00:45. This leg takes 201 hours, 14.9% of the total MOWER Cruise. At this stage recognition of erosion features and sandy deposits is prioritized by ARGUS ROV. This activity was developed during the day and during the nights surface sampling is performed in the same area by Shipek dredge and the box-corer. Further data are acquired in transit between the stations of the ROV and from multibeam echo sounder, parametric, EA 600, EK 60, and ADCP.
From the total time of the first leg, 23.5% was dedicated to transit, both between stations ROV as samples, 32% corresponds to recognition with the Argus ROV, 15% to sampling, and 29.5% to the multibeam data acquisition and parametric.
2.3 Leg 2: Gulf of Cadiz and West of Portugal
The second leg of the cruise starts on September 13 at 13:35 h. During this second leg more data are acquired in the Gulf of Cádiz, in the next part of the Strait of Gibraltar and in the West of Portugal.
The second phase of the cruise takes place in 483 hours which constitutes 59.7% of total MOWER Cruise.
3. BATHYMETRIC WORKS
3.1 Previous works and instrumental used
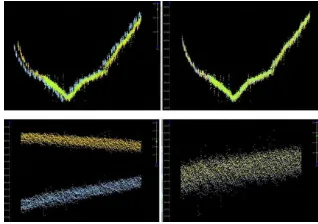
On September 3, 2014 at 19:30 a calibration tests was performed for the multibeam echo sounder, for which a CTD station was performed to calculate the profile of the speed of sound in water. This allowed the correct calibration data acquisition with multibeam echosounder during the cruise. The calibration was performed by two passes in opposite directions from a line in order to correct the pitch and the roll of the boat.
Figure 2. Pitch (above) and roll (below) correction in the calibration line.
In the works of acquisition of multibeam bathymetry sounders, is very important to have reliable data on the water column, in order to correct the data obtained by the differences in sound propagation.
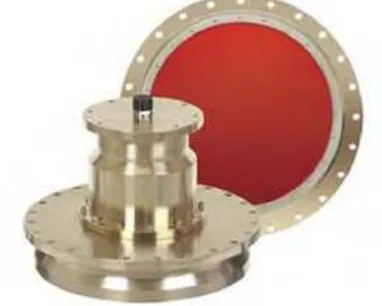
Figure 3. Sound velocity profiler AML SV Plus V2, used for the cruise.
The physical principle on which the probe multibeam to calculate the position of the acquired data is based, is a simple calculation time and path used by the acoustic signal to reach the bottom and back again to the ship. This means that, when there are errors in the applied sound velocity for each depth, eventually result in an error in the probe, both in position and in elevation, the greater the farther the probe from the vessel, a situation that happens is in side beams, which is due to a longer travel of sound in water. It is therefore very important to have reliable data propagation velocity of sound in all depths of work. For the area of the Strait of Gibraltar and adjacent to the western boundary of the Iberian Peninsula, we can summarize in general there are two bodies of water: the Atlantic at the top and the Mediterranean in the deepest area, with different salinities temperatures and conductivities. Between the two bodies of water there is what called an interface region whose position in depth can vary mainly in the Strait depending on multiple factors, such as tide time or season of the year.
To meet these physical parameters of the water column during the campaign, there have been different profiles obtained either with a profiler sound or disposable bathythermographs devices (XBT) necessary for the proper functioning of multibeam sounder, but also useful for other purposes, such as to characterize the interface, in conjunction with other sensors as the ADCP probe.
Finally, because of the complexity of ocean currents in the area of work, we have registered data streams continuously and for the entire water column.
There have also been several shots from the stern of XBT equipment (Expendable bathythermograph) making depth and temperature profiles.
Figure 4. Expendable bathythermograph system.
Another instrument used was the Doppler current profiler (ADCP). It is an equipment that shows the components of the velocity (magnitude and direction) of water in different layers of the water column (Fig. 5). The transducer is installed in the car port the ship and PC acquisition is in the laboratory of electronic equipment.
The system consists of a transducer, an electronic unit which generates pulses and pre - processes the received waves, and a computer that acquires data and processes. The ADCP uses the Doppler effect transmitting sound at a fixed frequency and listening returnees by the reflectors in the water echoes. These reflectors are small particles or plankton that reflect sound towards the ADCP. These reflectors float in water and move at the same rate as water. When the sound sent by the ADCP reaches the reflectors, it is shifted to a higher frequency due to the Doppler Effect. This frequency shift is proportional to the relative velocity between the reflectors and ADCP. Part of this sound is reflected frequencially shifted towards the ADCP where you receive moved a second time.
Figure 5. The Doppler current profiler (ADCP)
3.2 Bathymetric workflow
With the first leg 400 nm were probed and in parallel more information was acquired with parametric probe and the Doppler system. The beginning of the second phase began with the probe covering multibeam two areas in order to complete the regional bathymetric compilation and to characterize the erosive features and sandy deposits generated by the MOW in the study area.
The first data obtained by acoustic instrumentation are raw data. These contain much external noise to be removed, such as the movements of the ship, the pitch and roll, the angle of incidence, layers of different densities that can generate variations of the beams and other sound sources. The noise can lead to misinterpretation of the data, and therefore it is essential processing. This process is only filter data that is supposed to pass the data through a series of filters, which are merely imposing limits and boundary conditions to eliminate this noise, and try that data resemble as possible to reality.
The onboard processing is done by CARIS Software - HIPS, designed to process bathymetric data. This software allows cleaning of bathymetric data using filters and statistical algorithms such as creating products BASE (bathymetry associated statistical errors) with the CUBE option (combination of bathymetry statistical uncertainty). This The International Archives of the Photogrammetry, Remote Sensing and Spatial Information Sciences, Volume XL-5/W5, 2015
program allows working with large volumes of data and has several modules for each specific task sequence processing.
The sequence of work in HIPS (System Hydrographic Information Processing) is:
• Create a file of ship: you must configure the locations of the sensors and calibration values and the choice of the reference ellipsoid. This file contains the correction of roll, pitch, swath and location of the probe relative to the axis of the ship.
• Create a new project by setting the structure of the data. • Convert raw data into HDCS_Data to process them. • Load data from one or more tidal tide stations, in this case
we have used data from tide gage pressure located in the Gulf of Cádiz
• Combine the position and depth data and information from different sensors to produce geo-referenced data.
• Calculate the TPU: calculates the uncertainty to be used to generate surfaces base.
• Create a base surface with the CUBE method, combining the uncertainty previously calculated with the estimated bathymetry and generating an DTM (digital terrain model). • Create file sound velocity profile; it has all sound profiles
(xbt, ctd or svp) included; and applying the correction of sound by sound velocity correction module.
• Once the above steps starts processing; First a series of automatic filters as removing curves between lines, data correction side beams, because the ends of the beams may produce unwanted and must be eliminated, and statistical filtering which drops all those used points whose depth deviates from the mean surface. Subsequently manual processing is initiated by the Subset Editor Tool eliminating or validating points manually.
• After correction, it is necessary to generate a new filtered data bathymetry. Here the individual steps are: data management, data interpolation algorithm using a parabolic interpolation and finally digital smoothing model.
Figure 6. Processing workflow with CARIS-HIPS
3.3 Bathymetry Exchange Service
The bathymetry is the first element and one of the most important to continue the analysis of information. It is the reference for the other elements of the project and represents the
geographical baselayer on which any analysis made of the information is based.
Being MOWER a multidisciplinary international project and considering the size of the information, it is necessary to serve this information based on these criteria:
- Centralization of information. - Decentralization of the use. - Interoperability
- Standardization
- Selection and filtering information. - Usability
Therefore a service that allows access to the bathymetry from any computer, anytime, regardless of the software used and following a standardized system is designing.
For this service a WCS (Web Coverage Service) is developing. The standard WCS of the Open Geospatial Consortium provide an interface that allows requests for geographical coverage across the web using platform independent calls (Van Oosterom et al., 2011).
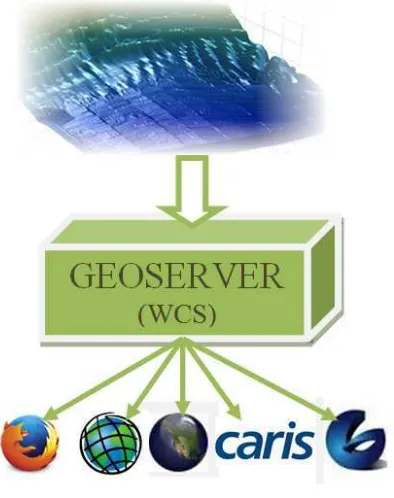
The WCS refers to the receiving of geospatial information as ‘coverages’: digital geospatial information representing space-varying phenomena. One can think of it as Web Feature Service for raster data. It gets the ‘source code’ of the map, but in this case it’s not raw vectors but raw imagery (Fig. 7).
An important distinction must be made between WCS and Web Map Service. They are similar, and can return similar formats, but a WCS is able to return more information, including valuable metadata and more formats. It additionally allows more precise queries, potentially against multi-dimensional backend formats.
Figure 7. Web Coverage Service
With this service, anyone with access to the bathymetry could access it from any computer, with any software that supports this type of service not only to view it, but also to analyse because information about altimetry is distributed with it. The The International Archives of the Photogrammetry, Remote Sensing and Spatial Information Sciences, Volume XL-5/W5, 2015
bathymetry is stored on the server in any of the possible formats elected. However, the format in which it is distributed can be as ASCGrid GeoTIFF or netCDF. It can be saved later, on the client computer according to the necessary formats.
3.4 Bathymetry Publishing Service
One of the key aspects of this project is to provide for informative manner part of the information obtained. This is to inform the academic world and the unscientific world notion of the work performed and the results obtained.
For this, a platform will be able to publish online tridimensional content with associated information. There are many desktop software capable of manage some kind of referred model and visualize it in 3D. However, the challenge is to publish the models directly on the Web, i.e. to work from a web browser with 3D models without having to install anything. Current technologies such as standard formats, libraries and plugins for 3D visualization are part of the so-called 3D Web. The most significant are (Prieto et al., 2012):
• WebGL: a cross-platform open standard API for low 3D graphics. It can be accessed as a DOM interface.
• X3DOM: experimental open source framework for integrating HTML5 specification and 3D content. It is based on Javascript and WebGL.
• HTML5: the canvas in which to embed 3D graphics. X3D thus include HTML objects.
These three technologies allow publishing on the corresponding data model files on X3D format from W3DS service. The aim is to watch the 3D information present in models, in different Web applications.
A three-dimensional model on the Web requires consideration of the spatial data and information associated with it (Rodrigues et al., 2013). So it is necessary to develop a protocol for transactions both spatial data and alphanumeric data.
For this project was chosen WebGL as a platform for online publication. It is necessary code developed to adapt developed bathymetry data and geographic information layered GIS to WebGL through the library Three.js (Fig. 8).
Figure 8. Prototype for bathymetry with Three.js
With these tools it aims to bring basic science to all those who want to know the type of work being done in these scientific campaigns.
4. THE ROV (REMOTED OPERATED VEHICLE)
The system known as Remote Operated Vehicle (ROV) is a submarine vehicle operator remotely (remotely operated underwater vehicle). It can be operated by radio or via a cord or a line that connects the vehicle to which the operator is. In MOWER Cruise has been used an ARGUS ROV. The ROV is operated by cord and belongs to the EMEPC (Portugal).
Figure 9. Picture of Argus ROV
Energy and orders are sent via a command via the ROV umbilical cord. Through the cord, data from the cameras and sonar sensors is also transmitted to the control center of the surface of the ship.
The ROV can take a variety of arms, sensors and cameras to perform work on the depths to capture images and samples of the seabed.
During the first phase of the campaign a total of 18 dives were performed using the Argus ROV, 63:28 hours total scanning, video recording and sampling, which represent 2.65 days (Fig. 10).
The effect of the speed of the stream at the bottom was a limiting factor when choosing the dive points, although these could be successfully mostly. For example, near the Strait of Gibraltar areas, speeds exceeding 3 m/s measurements were recorded.
Figure 10. Argus ROV immersion points The International Archives of the Photogrammetry, Remote Sensing and Spatial Information Sciences, Volume XL-5/W5, 2015
After several days of dives could summarize the operation of the ROV to the following tasks or actions:
1. Immersion
2. Scroll guided underwater
3. Recording HD viewing through a camera
4. Recording with different data path and positioning 5. Sampling, both direct samples as corers.
6. Surfacing
From the above the following were given: • Videos of the immersions
• Navigation and positioning files
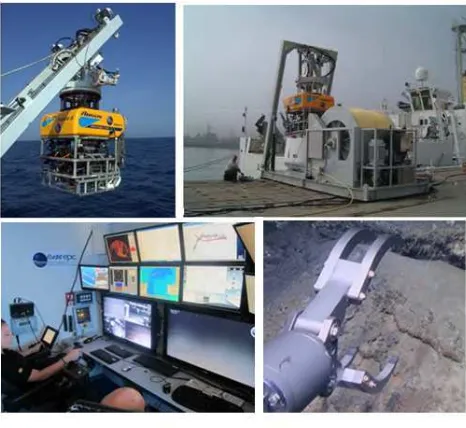
Samples were processed, sorting and filing as were collected. With the above way of work have found the following needs to be developed as potential R & D projects related to the above information (Fig. 11).
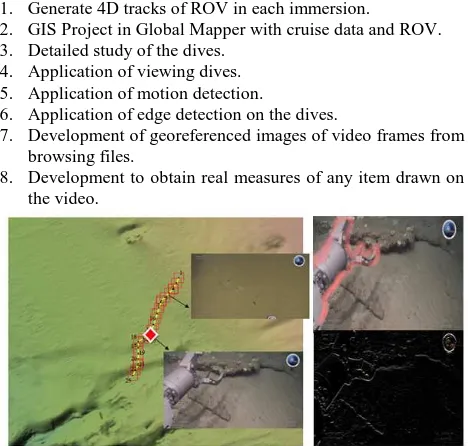
1. Generate 4D tracks of ROV in each immersion.
2. GIS Project in Global Mapper with cruise data and ROV. 3. Detailed study of the dives.
4. Application of viewing dives. 5. Application of motion detection.
6. Application of edge detection on the dives.
7. Development of georeferenced images of video frames from browsing files.
8. Development to obtain real measures of any item drawn on the video.
Figure 11. Images of some of de projects developed. 1 and 2 on the left. 5 and 6 on the right.
5. GEOPHYSICAL WORKS AND SAMPLING
5.1 Seismic information: Parasound P - 35 High resolution seismic system and Seismic reflection guns
The parametric probe PARASOUND P - 35 is a seismic reflection system High resolution, ability to work in water of any depth. It integrates into the group of systems using transducers as seismic sources. In this particular case uses a small single transducer for transmitting and receiving the seismic pulse. The features of this system lie in the generation of a narrow acoustic pulse, which can be applied in a wide range of depths, allowing information of unconsolidated sediments of the ocean floor.
PARASOUND P - 35 uses the property of nonlinear propagation of waves through water to generate a low frequency acoustic pulse from intermodulation of one or two short pulses of high frequency. The system PARASOUND P - 35 is composed of different sub-systems (Fig. 12), including transducers and the transceiver operator console, from which digital information can be recorded.
Figure 12. Parasound P – 35 Seismic system and subsystems
In MOWER Campaign parametric probe has worked with a secondary primary frequency of 4 kHz and 18 kHz. There has been a window of 200 m. The data produced by the PARASOUND P - 35 were recorded in two formats, first the raw data itself Atlas RAW format (* .ASD), while the processed signal is recorded in SEGY + PS3 format and has earned paper copy. Data were recorded contemporaneously with the seismic lines canyons and transits between stations and sampling ROV.
The interpretation of the data obtained to deduce the most recent seismic units, tectonic structures, sedimentary processes, the texture of the sediment surface and sub-surface and distinguish objects close together. This information was used to choose the most favorable sampling points.
In the Campaign MOWER there have been a series of seismic profiles with high resolution seismic source airguns, aiming to generate discrete pulses as often as possible, as the water column and the status of acoustic basement.
For the purchase of this profile have used the following configuration: two strings of hydrophones ("streamers") with a source of airguns generated, 2 compressors and a program of digital acquisition and navigation (Fig. 13).
Figure 13. Photo detail of one of the guns and operation scheme.
The working depth of the guns was 3.5 meters with a firing rate of six seconds during seismic acquisition in the Gulf of Cádiz (MOWER) and 6, 7 and 10 seconds during acquisition in western Portugal (CONDRIBER ).
The cannon shot occurs when the air pressure, the piston moves and releases the air, causing the explosion at set time intervals.
5.2 Sampling system
During the MOWER cruise it has being used different systems to collect sediments, both surface and the first meters of the sedimentary record. These systems have been the box corer, the Shipek dredge and piston corer.
5.2.1. Box corer: The box corer is used to sample types of backgrounds ranging from muddy to sandy. Collecting the sample has a length of 60 cm and is undeformed, thus making it very useful to know the vertical sediment texture, like for the inner structure.
The Box core consists of two main parts: Fixed structure and mobile structure. The fixed structure also functions as a support to give stability to box corer and this leads in a side leads 60 kg, divided between the two bands.
Moreover, the mobile structure has an axis centered, weighted with lead plates that allows the connection between the closing system and the sampling box. The sealing system or trigger consists mainly of: bolt, wire rope, pulley, arm and locking pin board.
Once the fixed structure lands the mobile structure penetrates the sediment by gravity. Once anchored in the sediment and equipment is charged to pull through steel cord that powers the guillotine by metal arm, causing the closure of the box sampling based preventing lost in sediment (Fig. 14).
Figure 14. Detail of the box corer when it reaches the bottom.
Once is again onboard the pin as a security system for the mobile part is putted, the cover between the base of the box and the guillotine is introduced to avoid the loss of the sample. Finally the box is removed by unscrewing.
5.2.2. Shipek dredge: This type of dredger, also known as cup dredger consists of a rigid, heavy body, about 40 kg, comprising a bowl which rotates about a central axis side arms joined with springs to facilitate opening and closing operations, which is actuated via a trigger. On this structure there is a ballast weighing approximately 25 kg allowing the trigger once the dredging impacts the bottom, so that the bowl rotates 180 degrees trapping sediment is placed inside.
Once the dredge is assembled, it is introduced into the water with a crane, leaving colliding against the bottom in free fall.
When the dredge comes onboard the cover is removed and the sample is photographed, which is subsequently stored in a bag with a label for the sample described (Fig. 15). To describe the sample in the binocular magnifier, an aliquot of the sample is screened by 63 microns screen to remove mud. The samples were kept refrigerated in laboratory for processing later.
Figure 15. A) Shipek dredge with the different parts; B) surface sediment sample recovered in the bowl of the Shipek dredge.
Sampling of surface sediment with Shipek dredge was made when the nature of the fund doesn’t allow the use of a box corer, as in the case of funds created by sand and gravel, although generally allows a virtually unchanged sample of any soft and/or semi consolidated bottom.
5.2.3. Gravity corer: The gravity corer is used to sample mainly muddy sediments, although one of MOWER Cruise goal is to try to extract from the Gulf of Cádiz sedimentary records from the sandy areas that exist in this area.
The gravity corer used is composed of two parts: a spead attached to a head with weight and a fixed bracket mounted on the starboard deck boat (Fig. 16).
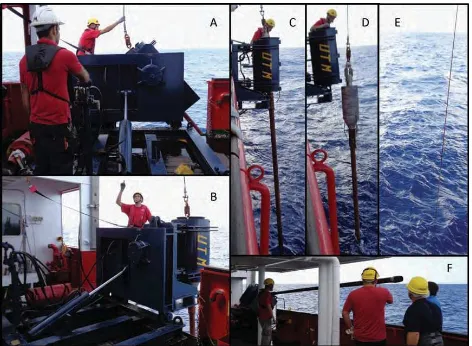
Figure 16. A and B - Detail cradle of gravity corer on the starboard deck; C, D and E - Launching the gravity corer; F - gravity corer on deck ready for extracting PVC jacket with
the sedimentary record inside.
With this comprehensive work coring is intended not only know the topography of the seabed but also the internal structure of the soil.
With all the types of samples may then infer different theories about the composition, origin, formation and dynamic of the sediments.
With all that samples the most significant cross sections will be developed (Fig. 17). A geological cross-section is a graphic representation of the intersection of the geological bodies in the subsurface with a vertical plane of a certain orientation. It is a section of the terrain where the different types of rocks, their constitution and internal structure and the geometric relationship between them are represented (Moretti and Larrère , 1989).
Figure 17. Stratigraphic documentation of a sample and cross section between two samples
But like during the entire project, it will attempt to develop more modern and complex methodologies visualization of the interior of the seabed (Tabares et al., 2010) (Fig. 18). To do that, different three-dimensional visualization libraries with the database with all samples will be developed (Zlatanova et al., 2004).
Figure 18. Three-dimensional visualization prototype of the subsoil of a grid of sampling
6. CONCLUSIONS
Throughout this paper has tried to show the complex work involved in the MOWER cruise.
From all the information collected is expected to be able to reach the following items:
a) Determine the changing of the dynamic of Mass Departure Mediterranean Water (MOW) and its global implications. b) Establish the interplay of longitudinal processes (contourites) and transverse (turbidites) and its implications for the development of little known mixed sedimentary systems, but largely explain the presence of levels of arenas (and/or sandy silt) reworked or selected submarines deep sedimentary
environments, something that may have economic implications facing the prospect for hydrocarbons.
c) Establish a benchmark for contourite sedimentation, with both morphological and depositional conceptual implications on continental margins.
d) Determine the paleogeography/paleophysiography and sedimentary paleoenvironment of non contourite depositional systems that are responsible, involve or favor the creation of erosive features and sandy contourite deposits associated. e) Check the recent tectonic role as a key factor in the medium and long term that has controlled the evolution of depositional systems, particularly erosive features and associated deposits.
From now, it will be an important technical work for the development of tools that help better and faster interpretation of data for the development of many theories.
REFERENCES
Hernández-Molina, F.J., Serra, N., Stow, D.A.V., Ercilla, G., Llave, E., Van Rooij, D. 2011. Deep Water Circulation: processes and products. Geo-Marine Letters, 31 (5-6): 315-341.
Moretti, I. and Larrère, M. (1989). LOCACE: computer-aided construction of balanced geological cross sections. Geobyte, 4(5).
Prieto, I., Egusquiza, A., Delgado, F. J., Martínez, R., 2012. CityGML como modelo de datos para la representación, intercambio y visualización de información sobre el patrimonio arquitectónico. Virtual Archaeology Review, 3(5), pp. 48-52.
Rodrigues, J. I., Figueiredo, M. J., Costa, C. P., 2013. Web3DGIS for city models with CityGML and X3D. In: 17th International Conference Information Visualisation (IV), pp. 384-388.
Tabares Ródenas, P., Martínez Santos, P., & Martínez Alfaro, P., 2010. Modelización 3D del acuífero Terciario de Torrevieja. Geometría del acuífero. Boletín Geológico y Minero, 120(1), 53-60.
Van Oosterom, P., Stoter, J., Ploeger, H., Thompson, R., Karki, S., 2011. World-wide Inventory of the Status of 3D Cadastres in 2010 and Expectations for 2014. In: FIG working week, pp. 18-22.
Varela García, F. A., Hernández Ibáñez, L. A., Taibo Pena, J., Seoane, A., 2007. Ampliación de las capacidades de visualización de un SIG libre mediante la comunicación con un navegador 3D. In: I Jornadas de SIG Libre, Girona, Spai.
Walenciak, G., Stollberg, B., Neubauer, S., Zipf, A., 2009. Extending Spatial Data Infrastructures 3D by Geoprocessing Functionality-3D Simulations in Disaster Management and environmental Research. In: International Conference on Advanced Geographic Information Systems & Web Services, pp. 40-44.
Zlatanova, S., Rahman, A. A., Shi, W., 2004. Topological models and frameworks for 3D spatial objects. Computers & Geosciences, 30(4), pp. 419-428.