A COMPREHENSIVE CALIBRATION AND VALIDATION SITE FOR INFORMATION
REMOTE SENSING
C. R. Lia, b
, L.L. Tanga, b
, L. L. Maa, b*
, Y. S. Zhoua, b
, C. X. Gaoa, b
, N. Wanga, b, X. H. Lia, b, X. H. Wanga, b, X. H. Zhua, b
a Key Laboratory of Quantitative Remote Sensing Information Technology, Chinese Academy of Sciences, Beijing 100094, China; bDepartment of EO Technology Application, Academy of Opto-Electronics, Chinese Academy of Sciences, Beijing 100094, China
KEY WORDS: Information Remote Sensing, Calibration, Validation, Performance Assessment, Test Site, RadCalNet
ABSTRACT:
As a naturally part of information technology, Remote Sensing (RS) is strongly required to provide very precise and accurate information product to serve industry, academy and the public at this information economic era. To meet the needs of high quality RS product, building a fully functional and advanced calibration system, including measuring instruments, measuring approaches and target site become extremely important. Supported by MOST of China via national plan, great progress has been made to construct a comprehensive calibration and validation (Cal&Val) site, which integrates most functions of RS sensor aviation testing, EO satellite on-orbit caration and performance assessment and RS product validation at this site located in Baotou, 600km west of Beijing. The site is equipped with various artificial standard targets, including portable and permanent targets, which supports for long-term calibration and validation. A number of fine-designed ground measuring instruments and airborne standard sensors are developed for realizing high-accuracy stepwise validation, an approach in avoiding or reducing uncertainties caused from non-synchronized measurement. As part of contribution to worldwide Cal&Val study coordinated by CEOS-WGCV, Baotou site is offering its support to Radiometric Calibration Network of Automated Instruments (RadCalNet), with an aim of providing demonstrated global standard automated radiometric calibration service in cooperation with ESA, NASA, CNES and NPL. Furthermore, several Cal&Val campaigns have been performed during the past years to calibrate and validate the spaceborne/airborne optical and SAR sensors, and the results of some typical demonstration are discussed in this study.
*
Corresponding author: [email protected] 1. INTRODUCTION
Remote Sensing (RS) technology is strongly required by industry, academy and the public for quickly providing very precise and accurate Earth information at this information economic era. In order to acquire reliable quantitative RS data, specific quality control measures based on calibration and validation are required during the whole RS data processing flow. Moreover, as a kind of the information products provided to the public, RS data quality needs to be accurately described. Therefore, it is the inevitable demand to perform sensor performance analysis, data quality assessment and product validation during the whole operation life-cycle of the RS sensors.
Since spaceborne sensors cannot be directly tested on-orbit, it is still the most common way to carry out these activities based on the ground reference targets in the current international RS community. As an infrastructure for running the ground reference targets and related instruments, the development of an excellent test site has become more and more important. In the past few decades, various calibration and validation (Cal&Val) sites have been built worldwide, and could be generally classified into four types. One is mainly used for radiometric calibration, e.g., the La Crau test site in French (Rondeaux, et al., 1998), White Sand in USA (Teillet, et al., 2001). Second is mainly used for geometric calibration, e.g., Fredrikstad test site in Norway (Nielsen, 2002), Vaihingen/Enz in German (Cramer, 2006). Third is used for image quality assessment, e.g., Stennis in USA, Sjökulla site in Finland (Eija, et al., 1994). The last is used for RS product validation, e.g., Barrax site in Spain. With the emerging of higher resolution RS sensors and higher accurate and consistent quantitative RS application requirement, how to efficiently and accurately control the quality of RS
data/product becomes an urgent need, and also a great challenges. This new technical demand calls for the following requirements in the development and operation of the Cal&Val sites. Firstly, as the typical ground reference targets for long-term quality control of mid-/low-resolution RS data, the natural scenes, may exhibit some heterogeneity for higher spatial resolution sensor. Therefore, in order to meet the demands of high resolution data quality assessment, the standard targets with higher uniformity, accuracy and stability are needed since more details could be revealed by high resolution sensors. Secondly, the direct inter-comparison between in situ measurement and sensor observation in Cal&Val must be affected by scale effect, atmospheric condition, environment changing, etc. To solve these problems, one of the feasible ways is to develop a Cal&Val system in which the surface radiance is measured by aircraft over ground target when the satellite overpasses and then transfer the measured radiance from aircraft to satellite (Smith, et al., 1998). Thirdly, RS sensor degrades during its on-orbit operation, so high-frequency calibration is required to characterize the degradation trend. In consideration of the huge costs on carrying out vicarious calibration with synchronous ground measurements, new solutions for realizing high-frequency calibration are needed, e.g., developing automatic measurement instruments. Finally, due to the fact that the metrics for characterizing the RS sensor performance are usually highly correlated with each other, it is preferred to assess the overall performances simultaneously, and thus a fully functional comprehensive site is expected.
In this paper, the Section 2 mainly introduces the Technical characteristics of the advanced Cal&Val site in details, followed by some results of Cal&Val campaigns in Section 3. The conclusion and future work are demonstrated in Section 4.
2. ADVANCED CAL&VAL SITE
2.1Basis information
Baotou comprehensive Cal&Val site is located in the Inner Mongolia, China, 50km away from Baotou city with convenient transportation. It covers a flat area of approximately 300km2 with an average altitude of 1270m. The site features a cold semi-arid climate with approximately 300 clear-sky days per year. The geography and climate condition help it become an ideal Cal&Val site. The site is dominated by various land surfaces, including lake, sand, bare soil, maize, grass, sunflower, potato, pumpkin, etc., which can be used for quantitative remote sensing data and product validation.
Figure 1. Location of Baotou site
Figure 2. Natural scenes in Baotou site
2.2Characteristics of Baotou site
2.2.1High-stable ground standard targets
As the reference for benchmark transfer, the ground standard target should own well characteristics, such as proper size, high uniformity, high stability, etc., so that the uncertainty caused by ground targets in Cal&Val could be reduced as much as possible. In Baotou site, the standard artificial portable and permanent targets are developed and distributed. They are all with uniform and stable surface characteristics and suit for accurate Cal&Val of different types of high resolution RS sensors. These targets could also benefit the standard transfer among different sensors, and support airborne RS sensor aviation testing, performance assessment and RS product validation.
2.2.1.1Permanent artificial targets
The permanent artificial target has the advantages of year-round availability, lower maintenance operations, long lifetime, and would be an excellent reference for satellite. In consideration of the local environment and climate conditions, several permanent targets are developed in Baotou site.
(a) Optical permanent artificial targets
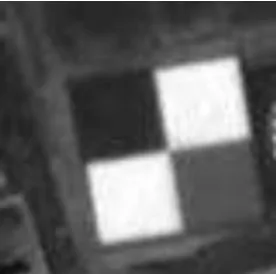
To perform radiometric calibration and assess the Modulation Transfer Function (MTF) and spatial resolution of optical sensors, a 2×2 checker-board knife-edge target and a fan-shaped target are constructed by gravels. The knife-edge target is composed of 2 white, a grey and a black uniform gravel blocks (each is 48m×48m in size). The fan-shaped target is a 155°-central-angle fan-shape area, with 31 black and white 5° sectors (50m radius, maximum sector width is 4.3m). These targets have well spectral uniformity within 2.5% in the visible and near-infrared spectrum (Li, et al., 2015). The knife-edge target is suitable for MTF assessment of optical sensors with GSD below 2.5m, and the fan-shaped target is suitable for spatial resolution evaluation of sensors with GSD below 4m.
(a) Knife-edge target (b) Fan-shaped target
(c) Spectral reflectance of different gravels Figure 3. Permanent optical artificial targets
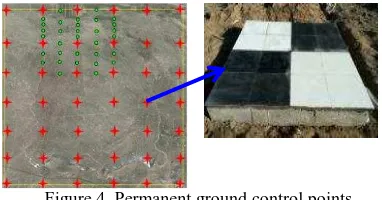
In order to perform geometric calibration, a total of 42 permanent ground control points are installed in an area of 5km×6km with elevation difference of 150m. Its surface is polished marble plate and its size is 2m×2m. The positional accuracy of control point is 3.5 cm.
Figure 4. Permanent ground control points.
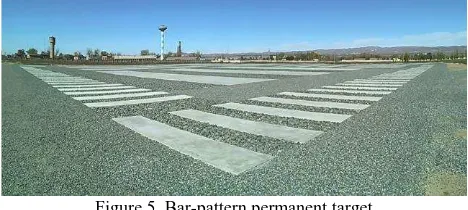
(b) Bar-pattern permanent target for both optical and microwave image resolution assessment
developed in the Baotou site to overcome the above-mentioned disadvantages. It covers an area of 4200 m2, and consists of 15 groups (the bar width of each group is ranging from 0.1m to 5m) of grey concrete flat bars and black gravel coarse bars. The target can be used for both optical and microwave image resolution assessment.
Figure 5. Bar-pattern permanent target
2.2.1.2Portable artificial targets
Portable artificial targets are the most common standard reference targets. They own the advantage of high-accuracy, uniformity, Lambertianity and flexibility when deployed for Cal&Val purpose. In the Baotou site, various portable artificial targets are developed.
(a) Optical portable artificial targets
In order to assess radiometric, spatial and spectral performances of airborne optical RS sensors, three types of standard portable artificial targets are manufactured by painting on tarpaulin, namely, fan-shaped target with a radius of 15m and small segments angle of 3°, seven grey-scale targets with a size of 7m×7m (reflectance is 5%, 20%, 30%, 40%, 50%, 60%, 70%), and 16 colored targets. Differ from the traditional planar targets, 32 point source targets are manufactured for radiometric calibration and MTF assessment.
(a) Different types of portable optical artificial targets
(b) BRDF of grey-scale target
(c) Surface reflectance of color targets Figure 6. Portable optical artificial targets
(b) Microwave portable artificial targets
Corner Reflector (CR) is the most widely used standard reference targets for microwave sensor calibration and performance assessment. 100 CRs, including triangular trihedral CR, square trihedral CR, circular trihedral CR, square dihedral CR with the leg length ranging from 0.1m to 1.5m are designed, manufactured, and equipped in Baotou site. Since the additional “tip” of a triangular trihedral CR usually yields an increase of RCS when interacting with perfectly reflecting ground plane, 10 hexagon trihedral CRs and 2 bottom-extended trihedral CRs are specially manufactured (Zhou, et al., 2014; Li, et al., 2014). All these CRs support Cal&Val activities like the Ka- to L-band SAR image quality assessment, radiometric, interferometric, polarimetric and geometric calibration.
(a) Dihedral CR (b) Triangular trihedral CR
(c)Hexagon trihedral CR (d)Bottom-extended trihedral CR
(e) Square trihedral CRs
Figure 7. Various types of CRs
In order to periodically carry out Cal&Val activities for microwave imaging sensors, 15 concrete bases are deployed in the Baotou site, while eight of them are deployed from east to west with 1km spacing distance among each of them; 4 of them are deployed from south to north with a spacing of 400m. The shape of the base is frustum of rectangular pyramid which ensures its stability for long-term use. A connection unit is embedding into the top of the base which helps installation of CRs with different foot units.
2.2.2High-accuracy Stepwise Cal&Val system
Cal&Val face many technical challenges in light of the requirement of quantitative remote sensing application. In order to reduce uncertainties introduced by scale effect, atmospheric effect in radiative transfer (RT) simulation, a stepwise Cal&Val system is preliminarily established. Its main concept is to take the proper-matched standard artificial targets and large-area natural scenes as reference, and transfer the benchmark from ground to airborne sensor and then to spaceborne sensors, with the aid of the ground spectrometer or imager which is well calibrated by the laboratory standard, so as to achieve accurate and suitable calibration results.
Figure 9. Stepwise Cal&Val system
2.2.2.1Ground measurement instruments
Ground measurement instruments with different functions are now equipped in Baotou site for acquiring long-term meteorological and atmospheric parameters, target radiometric, reflective, geometric parameters, e.g., sun photometer, automated weather station, meteorological sounding radar, GPS, multi-angular automated observation system, infrared water-leaving radiance measuring system, automated collection system for surface spectral emissivity.
(a) CE 318 sun photometer
(b) Automated weather station
(c) Meteorological sounding radar
(d) VIS-IR field spectrometers (e) Total station and GPS
(f) 3D geometric calibration system (g) Multi-angular automated observation system
(h) Infrared water-leaving radiance measuring system
(h) Automated collection system for surface spectral emissivity
Figure 10. Ground measurement system in Baotou site
2.2.2.2Standard airborne sensors
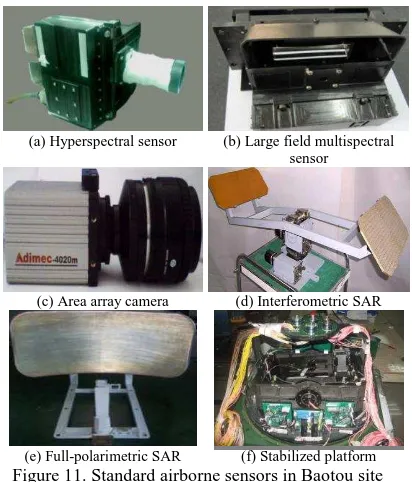
As a bridge for transferring the benchmark from ground to satellite, several types of airborne standard optical and SAR sensors are included in Baotou site, such as hyperspectral sensor, large field multispectral sensor, etc. In order to enhance the function of visible and infrared standard airborne data acquirement, more sensors, including VNIR (visible near-infrared), SWIR (shortwave infrared) and TIR (thermal infrared) hyperspectral sensors are now being developed. The three new sensors will have large field of view (extend to 60°) and high spectral resolution. In addition, there will be self-calibration sources which will assure the accuracy of obtained images.
(a) Hyperspectral sensor (b) Large field multispectral sensor
(c) Area array camera (d) Interferometric SAR
(e) Full-polarimetric SAR (f) Stabilized platform
Figure 11. Standard airborne sensors in Baotou site
2.2.3High-frequency automated radiometric calibration for RalCalNET
corresponding R&D with other three demonstrated sites, namely, La Crau site, Railroad valley site, and an under-construction site by ESA.
To meet the demands of automated radiometric calibration of RadCalNet, an automated surface spectral reflectance measurement system is being developed in Baotou site. The system is designed to observe the solar, sky and ground in sequence every 10 mins with a VIS-NIR spectrometer, and the surface reflectance at certain observing direction is calculated with hemispherical-conical reflectance and the BRDF of the surface target. This system will benefits Baotou site for providing demonstrated global standard automated radiometric calibration service in cooperation with ESA, NASA, CNES and NPL.
Figure 12. The shared vision of RadCalNet
2.3Comprehensive functions of the Baotou site
The ground standard targets, related measurement instruments, and airborne sensor in the Baotou site help carry out many types of Cal&Val missions. Table 1 summaries all of these functions.
1. Airborne remote sensing sensor aviation testing
Panchromatic
Geometric calibration, Dynamic range, Response linearity, Radiometric resolution, Signal-Noise-Ratio (SNR), Spatial resolution, MTF, Geometric positioning accuracy.
Multi-spectral /hyperspectral
Radiometric calibration, Geometric calibration, Dynamic range, Response linearity, SNR, Spatial and Radiometric resolution, MTF, Geometric positioning accuracy, Band registration accuracy, Spectral response.
Mid-infrared
Radiometric calibration, Geometric calibration, SNR, Spatial resolution, MTF, Radiometric resolution.
Thermal-infrared Radiometric calibration, SNR, Radiometric resolution.
SAR
Radiometric calibration, Geometric calibration, Polarimetric calibration, Interferometric calibration, Spatial and Radiometric resolution, PLSR, ISLR, NESZ, Radiometric accuracy, Geometric positioning accuracy, cross-talk.
2. Spaceborne sensor on-orbit radiometric calibration and performance dynamic assessment
High resolution optical sensor
Radiometric calibration (spatial resolution higher than 10m), Spectral calibration (spectral resolution higher than 5nm), Spatial resolution (spatial resolution higher than 4m), MTF (spatial resolution higher than 2m), SNR, Radiometric resolution (spatial resolution higher than 2m) Moderate resolution
optical sensor
Radiometric calibration(spatial resolution higher than 30m)
High-resolution SAR
Radiometric calibration, Spatial resolution, PLSR, ISLR, NESZ, Radiometric accuracy, Geometric positioning accuracy.
Vegetation cover rate, Vegetation index, Leaf area index, Evapotranspiration, Soil moisture, , DEM, etc.
Atmospheric and environmental characteristic product
Aerosol products, Water vapour content, Atmosphere temperature/humidity profile, Meteorological data, Solar irradiance, etc.
Table 1. General Cal&Val functions in Baotou site
3. RESULTS OF CAL&VAL CAMPAIGNS
During 2009 to 2014, several scientific campaigns were carried out in Baotou site. In those campaigns, various RS sensors, including panchromatic, multispectral, hyperspectral, InSAR, PolSAR, LiDAR, etc, were tested, and imaging data and ground measurement data were synchronously acquired. In this section, some results are presented.
3.1The calibration and performance assessment of GF-1 optical sensors
GF-1 satellite was launched in 2012. There is a 2m-resolution pan-chromatic sensor, an 8m-resolution multi-spectral sensor in visible-near infrared region onboard GF-1 satellite. In consideration of the spatial resolution of these sensors and the size of the target, with the aid of data measured with optical sensor onboard GF-1 satellite and other auxiliary measurements (aerosol optical thickness data and meteorological profiles, such as atmospheric temperature, atmospheric pressure, humidity, etc.) in Baotou site on November 4, 2013, radiometric (radiometric calibration, signal to noise ratio (SNR), dynamic range, response linearity and radiometric resolution), spatial (spatial resolution, MTF) are assessed, and some results are described as following.
(1) Radiometric Calibration
The in-flight calibration plays an increasingly important role in remote-sensing applications by connecting the response output of a sensor with the real energy it receives. To calibrate high-resolution panchromatic and multi-spectral sensors onboard GF-1 satellites, with the aid of synchronous spectral reflectance of the knife-edge permanent target and corresponding atmospheric parameters acquired during the satellite overpass, the reflectance-based method is used to calculate the calibration coefficients (L= G*DN+ B, where L is the radiance at the top of atmosphere, DN is the digital number of image, G and B is the gain and bias, respectively). The result is shown in Figure 14, and it is noted that the correlation coefficient for the calibration is 1.0.
100 150 200 250 300 350 400 450 500 550 600
200 250 300 350 400 450 500 550 600
40
200 250 300 350 400 450 500 550 600 40
150 200 250 300 350 400 450 500 550 600
20
100 150 200 250 300 350 400
10
Figure 14. Radiometric calibration result of GF-1 panchromatic and multi-spectral sensors
(2) Dynamic range and response linearity
Dynamic range impacts the brightness and contrast of the image. It is defined as the range of the maximal and minimal output of sensor. In this study, based on the radiometric calibration result, the high point (LH) and the low point (LL) of dynamic range can
be described as LH= (G*DNH+ B) and LL= B, respectively, where
DNH is equal to 2
n
-1( n is the quantization number of the sensor).Subsequently, the sensor’s response linearity (σ) can be acquired with the equation σ=Max(ΔL)/LH, where ΔL is the difference between measured TOA radiance and the fitted one. Table 2 shows the dynamic range and its response linearity for GF-1 panchromatic and multi-spectral sensors. It is noted that the pan-chromatic sensor has narrow dynamic range and has response linearity lower than 1% (Gao, et al., 2014).
Band
Table 2. Dynamic range and its response linearity for panchromatic and multi-spectral sensors
(3) SNR
SNR is usually considered as the ratio of total noise level to the signal level for an image or for a sensor. The SNR normalization method (Wang, et al., 2009) presented a practical scheme to better track changes of sensor SNR characteristics, and here is applied to the SNR assessment of GF-1/panchromatic image. Three pixel blocks (black, grey and
white blocks) are selected over the knife-edge target because of its well homogeneity. Firstly, homogeneous blocks are chosen on the black target, grey target and white target of the knife-edge target, and each block SNR is calculated by using the differential method. Secondly, the variation trend of SNR respected to TOA radiance is estimated and the normalized SNR value is obtained with the aid of the SNR values of the blocks, and the result is shown in Table 3.
Mean value of radiance
radiance=66.4 66.4 415.5
Table 3. SNR for GF-1 panchromatic image
(4) Radiometric resolution
Radiometric resolution determines how finely a system can represent or distinguish differences of intensity. The higher the radiometric resolution, the better subtle differences of intensity or reflectivity can be represented, at least in theory. In practice, the effective radiometric resolution is typically limited by the noise level, rather than by the bits number of representation. In the VIS-NIR regions of the electromagnetic spectrum, radiometric resolution is represented by the noise equivalent reflectance (NEΔρ) or the noise equivalent radiance (NEΔL), which is recognized as the corresponding reflectance or radiance when the SNR of image is equal to 1. In this study, with the aid of the SNR aforementioned and TOA radiance, the radiometric resolution (NEΔL) for the panchromatic sensor is about 0.16 W•sr-1m-2μm-1.
(5) Spatial resolution
Spatial resolution is the ability to resolve features or details within an image (ISO 12233). Spatial resolution assessment can be described as the minimum resolvable ground distance (MRGD) or the least size of object that can be distinguished. When evaluated using a fan-shaped target, spatial resolution is represented as the black or white sector width at the limit target radius where the black and white lines of target image is just can be distinguished. In this study, with the aid of the permanent fan-shaped target (see Figure 15), combined with automated detection technology (Calculated resolution) and expert interpretation (Visual resolution), the spatial resolution of panchromatic sensor onboard GF-1 satellite is determined, and the result is shown in Table 4. The calculated resolution and visual resolution is 2.16m and 2.21m, respectively. Note that the calculated resolution and visual resolution are both closer to ground spatial distance (GSD), indicating that the sensor has good spatial resolving ability.
GSD=2m Calculated resolution 2.1645 m Visual resolution 2.2157 m
Table 4. The estimated spatial resolution for GF-1 panchromatic sensor
(6) MTF
Modulation Transfer Function (MTF) is another quality metric besides spatial resolution for depicting the spatial performance of optical sensor. It is determined by the magnitude of the Fourier transform of the normalized system point-spread function. It specifies the response of the system to objects as a function of spatial (or angular) frequency (Hearn, 2005). Generally, MTF is given at the Nyquist frequency, which is defined in terms of the sampling frequency or GSD as 0.5·GSD
-1. In this study, an improved “knife-edge” method is used. The method has three aspects of improvements on the ISO 12233 method (ISO 12233, 1999): 1) the use of the Fermi function for edge detection; 2) filter the ESF curves using S-G filter for noise suppression; 3) process LSF curve with Hanmming window for avoiding spectral leakage and making more LSF central symmetry.
The improved “knife-edge” method is applied in the quality assessment of GF-1 panchromatic image. The estimated results and comparison with ISO 12233 method are shown in Table 5 and Table 6. Note that the standard deviations (SDs) of MTF and detection angle for the improved method are lower than that for ISO 12233 method, indicating that the improved method is more stable.
Improved method ISO 12233 method MTF@
Nyqiust frequency
Detection angle
MTF@ Nyqiust frequency
Detection angle
Mean 0.0467 -9.554 0.0458 -9.434
SD 0.0027 0.0446 0.00623 0.1814
Table 5. The estimated MTF of GF-1 panchromatic image (Cross-track, SNR of MTF=70)
Improved method ISO 12233 method MTF@
Nyqiust frequency
Detection angle
MTF@ Nyqiust frequency
Detection angle
Mean 0.021686 -9.6946 0.027848 -9.58489
SD 0.001689 0.121031 0.007253 0.2249 Table 6. The estimated MTF of GF-1 panchromatic image
(Along-track, SNR of MTF=68)
3.2Image quality assessment for KOMPSAT-5 SAR sensor
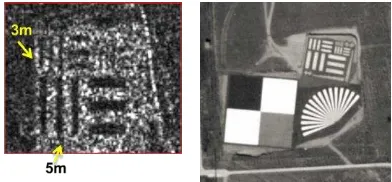
The newly developed bar-pattern target and seven CRs with relative large size are used for KOMPSAT-5 SAR image quality assessment. The CRs are deployed near local headquarters of Baotou site and along the satellite flight path.
KOMPSAT-5 SAR image of these targets was acquired at October 22, 2014. The bar-pattern target image is shown in Figure 16. The 3m-width bars could be discriminated while the 2m-width bars couldn’t, indicating that the actual image resolution is between 2 and 3m.
Zoomin of the bar-pattern target Optical image of the bar-pattern target Figure 16. Kompsat-5 SAR image of the bar-pattern targets
SAR image of the CRs is shown in Figure 17. The image quality metrics, such as spatial resolution, peak side lobe ratio (PSLR), integrated side lobe ratio (ISLR), are calculated based on the impulse response function of point targets (CRs).
Figure 17. KOMPSAT-5 SAR image of the deployed CRs
Spatial resolution is defined as the distance in meters between the points to either side of the peak in a one-dimensional cross-section through the impulse response function which are 3dB below the interpolated peak power. The range (Rg) and azimuth (Az) resolution assessed with CRs is shown in Figure 18. Note that the ground range instrument geometric resolution is 1.21m and azimuth instrument geometric resolution is 0.90m.
Figure 18. KOMPSAT-5 SAR resolution assessment result
PLSR is ratio of the intensity of the most intense peak of the IRF in the side lobe to the peak intensity in the main lobe. PLSR assessment result is shown in Figure 19. The nominal PLSR is -19dB.
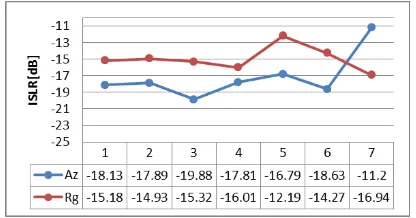
ISLR is ratio of the energy in the sidelobe to the energy in the mainlobe. ISLR assessment result is shown in Figure 20. The nominal ISLR is -13dB.
Figure 20. KOMPSAT-5 SAR ISLR assessment result
The preliminary results based on CRs show that the image quality is well consistent with the nominal value. However, the image resolution assessment result based on bar-pattern target is different from the results based on CRs. It is acceptable because they are obtained from two different resolution assessment methods. Note that the result based on the bar-pattern target is considered to be the closer one to the practical resolution for image interpretation purpose.
4. CONCLUSION AND FUTHURE WORK
A prototype of advanced Cal&Val site for information remote sensing in China is described in this paper, and some demonstrations for optical sensor onboard GF-1 satellite and SAR onboard KOMPSAT-5 are given to illustrate its capacity. After significant efforts in the past several years, the Cal&Val site could effectively support aviation testing for multiple types of airborne RS sensors (VNIR, SWIR, TIR, LiDAR, SAR), and it also can serve for on-orbit spaceborne sensor radiometric calibration, performance assessment, RS product validation, etc. To further improve the system, three aspects of work will be focused: (1) strengthening the capability of long-term operation of the Baotou site; (2) improving traceable consistency transfer calibration system, contributing to Chinese high-accuracy quality detection and controlling system of quantitative remote sensing product; (3) as a demonstration site of RadCalNet, improving automatic radiometric calibration system, and carrying out “global multi-site calibration”, so as to provide global high-frequency automated radiometric calibration standardized service for various optical sensors. The work will greatly promote the global information resources sharing, and contribute to improve the quality and applicability of Chinese EO satellite data.
ACKNOWLEDGEMENTS
The work has been supported by the National High Technology Research and Development Program of China (2013AA122102). The authors would like to thank the China Centre for Resources Satellite Data and Application for providing GF-1 satellite data.
REFERENCES
Cramer M, 2006. The ADS40 Vaihingen/Enz geomeric performance test. ISPRS Journal of Photogrammetry and Remote Sensing, 60(6), pp. 63-374.
Eija, H., Jouni, P., Eero, A., Risto, K., Juha, H., Juha, J., Harri, K., Lauri, M., Kimmo, N., Juha, S., 2008. A Permanent test field for digital photogrammetric systems, Photogrammetric Engineering & Remote Sensing, 74(1), pp. 95-106.
Gao, C.X., Ma, L.L., Liu Y.K., Wang, N., Qian,Y.G., Tang, L.L., Li, C.R., 2014. The assessment of in-flight dynamic range and response linearity of optical payloads onboard GF-1 satellite, In: Proc. SPIE Asia-Pacific Remote Sensing, Beijing, China, doi:10.1117/12.2068794.
Hearn, R.H., 2005. Spatial calibration and imaging performance assessment of the advanced land imager, Lincoln Laboratory Journal, 15(2), pp. 225–250.
ISO 12233, 1999. Photography electronic still-picture cameras, Resolution measurements, International Organization for Standardization, Geneva.
Li, C.R., Zhou, Y.S. Ma, L.L., 2014, Analysis of optimal panel geometry for self-illustration corner reflector. In: Progress in Electromagnetics Research Symposium, Guangzhou, China. pp. 1425-1429.
Li, C.R., Ma, L.L., Gao, C.X., Tang, L.L., Wang, N., Liu, Y.K., Zhao, Y.G., Dou, S., Zhan, D. D.,Li, X.H., 2015. Permanent target for optical payload performance and data quality assessment: spectral characterization and a case study for calibration. Journal of Applied Remote Sensing, 8(1) 083498 doi: 10.1117/1.JRS.8.083498.
Nielsen, B. Jr., 2002. Test field Fredrikstad and data acquisition for the OEEPE test – Integrated sensor orientation, Integrated sensor orientation – Test report and workshop proceedings, OEEPE Official Publication (C. Heipke, C. Jacobsen, and H. Wegmann, editors), Vol. 43, pp. 19–30.
Rondeaux G., Steven M. D., Clark J. A., Mackay, G., 1998. La Crau: a European test site for remote sensing validation. International Journal of Remote Sensing, 19(14), pp. 2775 -2788.
Smith, G.R., Levin, R.H., Abel, P., Jacobowitz, H., 1998. Calibration of the solar channels of the NOAA-9 AVHRR using high altitude aircraft measurements. Journal of Atmospheric and Ocean technology, 5, pp. 631-639.
Teillet P.M., Thome K.J., Fox N., Morisette J.T., 2001. Earth observation sensor calibration using a global instrumented and automated network of test sites (GIANTS). In: SPIE, (4540), pp. 246-258.
Thome, K, 2014. Radiometric calibration network of automated instruments. In: Land Product Validation and Evolution Workshop, Frascati, Italy.
Wang, X.H, Tang, L.L., Li, C.R., Y. B., Zhu, B., 2009. A practical SNR estimation scheme for remotely sensed optical imagery. In: Proc. of SPIE, Vol. 7384, pp. 738434-1~738434-6.
