Research on dimension reduction method for hyperspectral remote sensing image based on
global mixture coordination factor analysis
Shuangting Wanga, Chunyang Wanga,*
aSchool of Surveying and Land Information Engineering, Henan Polytechnic University, China - [email protected], [email protected]
KEY WORDS:Dimension reduction, Coordination factor analysis, Hyperspectral remote sensing, Feature construction, Manifold learning
ABSTRACT:
Over the past thirty years, the hyperspectral remote sensing technology is attracted more and more attentions by the researchers. The dimension reduction technology for hyperspectral remote sensing image data is one of the hotspots in current research of hyperspectral remote sensing. In order to solve the problems of nonlinearity, the high dimensions and the redundancy of the bands that exist in the hyperspectral data, this paper proposes a dimension reduction method for hyperspectral remote sensing image data based on the global mixture coordination factor analysis. In the first place, a linear low dimensional manifold is obtained from the nonlinear and high dimensional hyperspectral image data by mixture factor analysis method. In the second place, the parameters of linear low dimensional manifold are estimated by the EM algorithm of find a local maximum of the data log-likelihood. In the third place, the manifold is aligned to a global parameterization by the global coordinated factor analysis model and then the low-dimension image data of hyperspectral image data is obtained at last. Through the comparison of different low-dimensionality reduction method and different classification method for the low-dimensional data, the result illuminates the proposed method can retain maximum spectral information in hyperspectral image data and can eliminate the redundant among bands.
1. INTRODUCTION
The hyperspectral remote sensing technology is a new remote sensing technology which developed rapidly in recent years and has become one of pulling power of the remote sensing fields (Goetz, 2009). It is a comprehensive technology which integrates detector technology, precision optical machinery, weak information detection, computer technology, information processing technology. It uses lots of narrow bands of electromagnetic waves to obtain the relevant data from interesting objects and can detect features which can’t be able to be detected in the wide-band spectrum remote sensing (Tong et al., 2014). The hyperspectral data have distinctive features and contain abundance information of spatial, radiation and spectral. In imaging process, it obtains image of earth's surface by using a nano-scale spectrum resolution imaging spectrometer with dozens even hundreds bands at the same time, acquiring continuous spectrums of ground objects and obtains the spectral information, radiation information and spatial information of ground objects simultaneously. So it has a great application value and broad development prospects in related fields (Yu et al., 2013).
The hyperspectral remote sensing image have the characteristics of multi-bands, enormous data, strong band relevant and easily influenced by Hughes phenomenon (Hughes, 1968). It produced the contradiction between fine spectra and enormous data, efficiency and accuracy in some extent. Therefore, it is an important issue in remote sensing field that the hyperspectral data can be reduced the dimension to solve the problem of computing complexity under the premise of not reducing the classification accuracy (Zhang et al., 2013, Kozal et al., 2013, Luo et al., 2013).
So far, the research of hyperspectral remote sensing image dimension reduction method mainly carry out from two general orientation (Li et al., 2008). One is band selection and the other is feature transformation. The principle of band selection of dimension reduction method is to use m bands of hyperspectral data with a great sense of features to replace the original n dimensions of high dimensional hyperspectral data(m<n). The advantage of these methods is able to retain better the characteristics of the original image data, and the disadvantage is that they undermine the integrity of the hyperspectral data spectral details (Wang et al., 2012). The principle of feature transformation of dimension reduction is to use a transform method with low order approximation sets to represent the original datasets. The advantage of these methods is that the new low-order datasets have a higher compressibility, the disadvantage is that they could damage the specific physical meaning of original datasets (Hsing et al., 2005).
Due to the algorithm in feature transformation, dimension reduction method is good, and dimension reduction efficiency is high. The hyperspectral data dimension reduction is more widely applied in the field. There are two major classes of dimension reduction. One of methods is dimension reduction of linear feature transformation, and the other is the dimension reduction of nonlinear feature transformation. The dimension reduction method of linear feature transformation mainly contains hyperspectral dimension reduction method based on nonnegative matrix factorization (Bourennane et al. 2014, Robila et al. 2007), principal component analysis (Agarwal et al., 2007), independent component analysis (Song et al., 2007, Lennon et al., 2001), principal curves and manifolds (Gillis et al., 2005), kernel PCA (Khan et al., 2009), and isomap (Dong et al., 2007). The main problem of the present dimension
reduction method of linear feature transformation is that it can't keep the local information. And the spectral information loss is serious after the reduction of dimension. The advantage is fast speed, the algorithm is efficient, it is easy to implement. And the existing problem of dimension reduction methods of nonlinear feature transform for nonlinear initial conditions is difficult to estimate it, such as we can not defined the manifold’s simplicity. On the other hand, the algorithm is slow, and it is difficult to realize. The advantage is that the explicit consideration of the manifold structure of the data is given, and the local information is kept enough.
The factor analysis method is a dimension reduction method of linear feature transformation. The method can constitute a linear combination of the original features through some latent factors and finally remove the correlation of the original feature concentration. Mixtures of factor analysis is extension of the factor analysis method. The method allows different regions in the input space to build model of local factor data, that is Gaussian mixture model of dimension reduction and dimension reduction and clustering can be completed at the same time, so it is very suitable when we learn high-dimensional data generation model. This paper presents a hyperspectral data dimension reduction method of global mixture coordination factor analysis(GMCFA), first of all, it use a mixture of factor analysis method to obtain a linear low-dimensional manifold from nonlinear high-dimensional original hyperspectral data. Then this method uses the maximum log likelihood algorithm to estimate parameters of the linear low dimensional manifold. Finally, it can construct the low dimensional hyperspectral image data by using the global coordination factor analysis model. The algorithm combines features of transform linear dimension reduction method and nonlinear transform of dimension reduction methods. Under the premise of spectral information sufficient retention, the algorithm is easy to implement, has a fast speed, and it is high efficiency.
2. TITLE AND ABSTRACT BLOCK MATERIALS AND METHODS
2.1 model of mixtures factor analyzers
Suppose high-dimensional hyperspectral images is, there is a low-dimensional manifold embedded in high-dimensional space. If the low dimensional manifold is locally sufficient smooth, then a model can be constructed to approximate the linear representation of the manifold. Factor analysis models such as formula 2-1:
X
AF
(2-1)Wherein Xis observable, it is a constant vector representation mean for load matrix, is independent and normalized common factors specific variance, and independent of each other, called special factors.
Assuming thatF is independent random variable and it obeys the Gauss distribution, the probability density function of the target is obtained by Gauss mixture modeling, as shown in Figure 2-2:
The
i is the proportion of the I factor analyzer in the modeland satisfy this restriction
i1, the mean of each GaussAs can be seen from the formula 2-2, the mixed factor model is actually the Gauss mixture model of dimension reduction. Each factor analyzer fits a part of the Gauss distribution data. Because each Gauss distribution of the covariance matrix is determined by a low dimensional factor load matrix, the covariance structure of the model can be determined by theKm
parameters rather than theKn(Kn-1)/2 parameters of the Gauss
mixture model, so as to realize the dimension reduction.
2.2 Mixed factor model parameter estimation
The parameters of the mixed factor model are estimated mainly using EM algorithm at the current(Expectation Maximization). EM algorithm is an iterative method to find the maximum likelihood estimation of the subject distribution parameters under the condition of given set of observation data. The core idea is based on the existing data, with the help of the hidden variable, the likelihood function is estimated by the iteration between the expected values.
We assume that the observed data is Y, X=(Y,Z) is complete data, Z is the missing data, θis the model parameters, The posterior distribution density function of the θ based on the observation data Y is g y(
) , which is called posterior distribution. f( y z, ) indicates that the posterior distribution density function of θ is obtained after adding data Z, and is called the adding posterior distribution.k z y( , ) indicates the conditional distribution density function of the latent data Z after the givenθand the observed data Y. EM algorithm starts fromθ(0), then alternating between two steps: E expressed the expectation that M expressed maximum.The algorithm steps can be summarized as follows: E step:
2.3 The improved EM algorithm
EM algorithm in the parameter estimation method is very popular, but there are a lot of defects is the slow convergence speed. In order to accelerate the convergence rate of the EM algorithm, Verbeek, J et al. (2006) proposed the CFA algorithm (Verbeek, 2006), The main advantage of the coordinated factor
analysis (CFA) method is that it allows the global adjustment of the parameters estimation in the linear model and increases the constraint conditions.
The algorithm steps can be summarized as follows:
1(log ( )
Where log ( )p xi is the maximum likelihood value of the MFA
model is estimated using the EM algorithm. D( ) is the Kullback-Leibler Divergence.yis low dimensional data. The dominant idea of CFA algorithm is to amend the M step to adjust the covariance and get the additional information of the complete data. The steps include:
(1) Initial value: For the Equation 2-2, the mean value Λ is used of the original data and the covariance matrix Ψ is set to the identity matrix.
CFA algorithm(4) The condition of convergence: Keeping the iteration E and M steps and repeating the above three values, until
L X
( | )
L X
( | )'
,
10
5.3. THE STUDY AREA AND VALIDATION IMAGES
Fig.1 The synthesis true color image (bands 31, 21, 11) of AVIRIS data
0 20 40 60 80 100 120
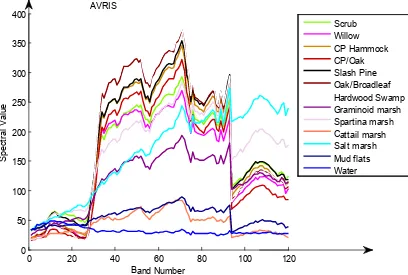
Fig.3 The spectral curves of object categories feature of AVIRIS data
4. RESULTS AND DISCUSSION
4.1 Dimension reduction effect comparison for different classifier algorithms
This experiment mainly has two purposes, one is the validation dimension reduction effect of this chapter puts forward the dimension reduction method. Participate in contrast dimension reduction method has PCA (principal component analysis), the
LDA (linear discriminant analysis) and dimension reduction method which is proposed in this paper; Participate in contrast classification method has a minimum distance method, maximum likelihood method, support vector machine (SVM) method.
The comparison of classification overall accuracy under different dimension reduction algorithm of AVIRIS data is showed in table 2.
tab name number tab name number tab name number
1 CP/Oak 459 2 willow 150 3 CP Hammock 181
4 Hardwood 197 5 Slash Pine 214 6 Oak/Broadleaf 320
7 Hardwood swamp 158 8 Graminoid marsh 332 9 Spartina marsh 370
10 Cattail Marsh 363 11 Salt marsh 310 12 Mud flats 293
13 water 829
Table 1. The information of each kind of sample size of AVIRIS data
classification method
descending dimension method before of dimension reduction PCA LDA GMCFA
minimum distance classification 65.21% 64.16% 42.94% 71.62%
maximum likelihood classification 86.99% 86.60% 74.04% 87.08%
classification method of SVM 82.35% 83.19% 67.33% 85.34%
Table 2. The comparison of classification overall accuracy under different dimension reduction algorithm of AVIRIS data
Can be seen from table 2, the accuracy decreased after use of PCA and LDA algorithm dimension reduction, fall is larger for the LDA algorithm; After use of the proposed algorithm, the classification accuracy of the method are rising.
Minimum distance classification for the classification results of before and after the test data in dimension reduction is as
(a) before of dimension reduction (b) the method of PCA
(c) the method LDA (d) GMCFA
Fig.4 The comparison of classification results map using minimum distance algorithm under different dimension reduction algorithm of AVIRIS data
(c) the method LDA (d) GMCFA
Fig.5 The comparison of classification results map using maximum likelihood algorithm under different dimension reduction algorithm of AVIRIS data
(a) before of dimension reduction (b) the method of PCA
(c) the method LDA (d) GMCFA
From fig 4 to fig 6 can be find, using PCA and LDA algorithm classification effects are decreased after dimension reduction, and the effect difference obvious; The proposed classification method with the quality of the classification results before and after the dimension reduction without apparent decline in this article.
4.2 Discussion
(1) GMCFA dimension reduction method is applied to AVIRIS type hyperspectral data, which shows a good dimension reduction performance.
(2) The effect of GMCFA dimension reduction method is better than PCA and LDA algorithm of projection dimension reduction.
(3) GMCFA dimension reduction method wipe off a large number of redundant information between the bands, classification precision is tiny variations in each classification method and classification results have no significant decline after dimensionality reduction.
5. CONCLUSION
Hyperspectral data have the characteristics of a large number of bands, large amount of data and the strong correlation between adjacent bands, the dimension often need to be cut down before deal with. Factor analysis which is linear feature transformation method can eliminate the original characteristics of the concentration of associations eventually by some latent factors constitute a linear combination of the original features, it is very suitable for the applications of high-dimensional data dimension reduction. This paper improves a dimension reduction method of factor analysis and applies to the dimension reduction of hyperspectral remote sensing image and compare with a variety of dimension reduction method. The experimental results showed that the GMCFA dimension reduction method has good universality and stability. Otherwise, it can remove a large number of redundancy between bands and keep better spectral information. Thus, the hyperspectral remote sensing data processing of classification after band dimension reduction can maintain a high classification precision and good classification.
ACKNOWLEDGEMENTS
This research is supported by Surveying and Mapping Geographic Information Nonprofit sector research and special projects under Grant 201412020.
REFERENCES
Goetz A F H., 2009. Three decades of hyperspectral remote sensing of the Earth: A personal view. Remote Sensing of Environment, pp. 113:S5–S16.
Tong Qingxi, Xue Yongqi, and Zhang Lifu, 2014. Progress in hyperspectral remote sensing science and technology in China over the past three decades.IEEE Journal of Selected Topics in Applied Earth Observations and Remote Sensing, 7(1), pp. 70-91.
Yu Xuchu, Feng Wufa, Yang Guopeng, Chen Wei, 2013. Hyperspectral image analysis and application. Science Press, Beijing.
Hughes, G., 1968. On the mean accuracy of statistical pattern recognizers. IEEE Transactions on information theory, 14(1), pp. 55-63.
Zhang Lefei, Zhang Liangpei, Tao Dacheng, Huang Xin, Du Bo, 2013. Nonnegative discriminative manifold learning for hyperspectral data dimension reduction. Lecture Notes in Computer Science, pp. 351-358.
Kozal A O, Teke M, Ilgin H A. 2013. Comparative analysis of hyperspectral dimension reduction methods. In: Signal Processing and Communications Applications Conference (SIU), 21st, pp.1 - 4.
Luo, H., Yang, L., Yuan, H., & Tang, Y. Y., 2013. Dimension reduction with randomized anisotropic transform for hyperspectral image classification. 2013 IEEE International Conference on Cybernetics (CYBCONF), Vol.8215, pp.156-161.
Li, C. H., Kuo, B. C., Lin, C. T., & Hung, C. C., 2008. Dimension reduction for hyperspectral image classification via support vector based feature extraction. IEEE International Geoscience and Remote Sensing Symposium, 2008. IGARSS 2008, Vol. 5, pp. 389 -392.
Wang, Y., Huang, S., Liu, D., & Wang, B., 2012. Research Advance on Band Selection-Based Dimension Reduction of Hyperspectral Remote Sensing Images. Remote Sensing, Environment and Transportation Engineering (RSETE), 2012 2nd International Conference, pp.1-4.
Hsing, T., Liu, L. Y., Brun, M., & Dougherty, E. R., 2005. The coefficient of intrinsic dependence (feature selection using el CID).Pattern Recognition, 38(5), pp. 623-636.
Bourennane, Zhiyong Xiao& Salah, 2014. Constrained nonnegative matrix factorization and hyperspectral image dimensionality reduction.Remote Sensing Letters, 5(1), pp. 46-54.
Robila, S. A., & Maciak, L. G., 2007. Sequential and parallel feature extraction in hyperspectral data using nonnegative matrix factorization. 2007 IEEE Long Island Systems, Applications and Technology Conference,LISAT, pp 90-96.
Agarwal, A., El-Ghazawi, T., El-Askary, H., & Le-Moigne, J., 2007. Efficient hierarchical-PCA dimension reduction for hyperspectral imagery.2007 IEEE International Symposium on Signal Processing and Information Technology, pp. 353-356.
Song, Feng Yan He Ming-yi, and Jiang-hong Wei Jiang., 2007. ICA-Based Dimensionality Reduction and Compression of Hyperspectral Images. Journal of Electronics & Information Technology, 29(12), pp. 2871-2875.
Gillis, D., Bowles, J., Lamela, G. M., Rhea, W. J., Bachmann, C. M., Montes, M., & Ainsworth, T., 2005. Manifold learning techniques for the analysis of hyperspectral ocean data. In: Proceedings of SPIE - The International Society for Optical Engineering, Vol. 5806, PART I, pp 342-351.
Khan, Asif, Intaek Kim, and Seong G. Kong., 2009. Dimensionality reduction of hyperspectral images using kernel ICA. In:Proceedings of SPIE - The International Society for Optical Engineering, Vol. 7513, pp. 10-1-10-8.
Guangjun, Dong, Zhang Yongsheng, and Ji Song., 2007. Dimensionality reduction of hyperspectral data based on ISOMAP algorithm. 2007 8th International Conference on Electronic Measurement and Instruments, ICEMI, pp. 3935-3938.
Verbeek, J., 2006. Learning nonlinear image manifolds by global alignment of local linear models. Pattern Analysis & Machine Intelligence IEEE Transactions on, 28(8), pp. 1236-1250.