USING MORPHOLOGICAL DIFFERENTIAL ATTRIBUTE PROFILES FOR CHANGE
CATEGORIZATION IN HIGH RESOLUTION SAR IMAGES
M. Boldt a, K. Schulz a, A. Thiele a, b, S. Hinz b
a Fraunhofer Institute of Optronics, System Technologies and Image Exploitation (IOSB), 76275 Ettlingen, Germany –
(markus.boldt, karsten.schulz)@iosb.fraunhofer.de
b Institute of Photogrammetry and Remote Sensing (IPF), Karlsruhe Institute of Technology (KIT), 76131 Karlsruhe,
Germany – (antje.thiele, stefan.hinz)@kit.edu
KEY WORDS: Morphological Attribute Profiles, high resolution, SAR, TerraSAR-X, change detection, change categorization.
ABSTRACT:
Change detection in urban and suburban areas through remote sensing satellite imagery is an important topic. Furthermore, it is of special interest to derive information on the category of detected changes is of special interest. In (Boldt et al., 2012), a fully-automatic change detection method based on a morphological filtered ratio image was presented. This filter step is accomplished by an alternating sequential filter (ASF), which supports the knowledge-driven analysis of the scene. For example, the focus can be set on small-scaled changes caused by vehicles or smaller construction sites. The change detection itself is performed using the automatic threshold method shown in (Sahoo et al., 2004) considering the entropies of the fore- and background of the filtered ratio image. In contrast, the presented approach makes use of morphological differential attribute profiles (DAPs) to compare changes detected in high resolution (HR) TerraSAR-X (TSX) amplitude images of Greding (Germany). DAPs are the derivatives of morphological attribute profiles (APs). APs are calculated by applying iteratively attribute openings and/or closings to an input image. Attribute openings (resp. closings) themselves are a combination of connected openings (closings) and trivial openings (closings). DAPs provide the opportunity to derive typical signatures for each pixel of the entire image (Dalla Mura et al., 2010), and, as a consequence, for each detected change segment. Aiming on the categorization of changes, it is shown in this paper that the DAPs represent a promising method for detecting changes with similar semantics automatically.
1. INTRODUCTION
Change detection using multi-temporal HR SAR images is a highly frequented field of research and still a challenging task. Due to their active sensing characteristics, SAR satellite images can be acquired during bad weather conditions without losing significant information. This makes SAR imagery capable for, monitoring tasks or time series analysis. On the other hand, the presence of speckle noise limits the usage of pixel-based analysis methods. Different methods for speckle reduction are available. For example, (Gong et al., 2012) proposed a neighborhood-based ratio approach. Furthermore, the high geometrical resolution of, for example, TSX imagery acquired in HR SpotLight mode leads to an incapability of pixel-based approaches, since one pixel represents only a part of an object. This effect is also known analyzing optical HR imagery as mentioned in (Weih et al., 2010). Since pixel-based methods are not well-suited for investigating HR imagery, object-based methods are preferred. In (Boldt et al., 2012), a fully automatic object-based method for change detection in HR SAR image pairs was presented. This method relies on a morphological alternating sequential filtering step that leads to binary change segments after thresholding. By now, several change detection methods working on SAR images have been proposed (e.g. (Bovolo et al., 2012), (Acito et al., 2012)) without analyzing the category of the detected changes. Providing support for this lack, different features for change categorization were considered in (Boldt et al., 2012). As one of these features, the morphological differential attribute profiles (DAPs) were presented. DAPs are the derivatives of morphological attribute profiles (APs). Using VHR optical remote sensing imagery, the capabilities of the DAPs aiming on change detection were
analyzed by (Falco et al., 2010). In the paper at hand, the DAP approach is applied on HR SAR amplitude images aiming on the fully automatic detection of similar changes.
This paper is organized as follows: Section 2 contains the principles and basics behind the DAPs. In Section 3, several change segments and their DAP signatures are shown. In Section 4, the proposed method for the detection of similar changes is given. Finally, Section 5 contains the conclusion and some outlook on future work.
2. DIFFERENTIAL ATTRIBUTE PROFILES
Due to the fact that DAPs are calculated from APs, morphological attribute filters are explained in the following. For more detailed information on the theoretical background, compare for example (Soille, 1998), (Serra et al., 1992), (Breen et al., 1996) and (Dalla Mura, 2011).
2.1 Morphological openings and closings
The two basic morphological transformations are erosion and dilation . Both and base on the use of a structuring element (SE) of certain shape and size. The principle behind erosion and dilation is that the SE is probed against image sets. Those sets can be foreground pixels in the binary case or pixels of a subgraph considering a grayscale image function. Erosion means that only those set pixels are retained for which the SE completely fitted into the set. In other words: Erosion delivers the intersection of these set shifts. As reference point for this probe, usually the origin of the SE is used. Dilation, in contrast, adds pixels to image sets and closes gaps within sets. It delivers the union of the SE and the image sets shifting, since it affirms International Archives of the Photogrammetry, Remote Sensing and Spatial Information Sciences,
the question: “Does the SE touch the image set?” As reference point for this probe, also the origin of the SE is used. Erosion and dilation are dual transformations with respect to complementation:
; ,
where denotes the complement and represents the image. Morphological openings and closings represent combinations of erosion and dilation. An opening is a dilation performed on an eroded image, aiming on the best restoration of the eroded image content:
.
Morphological closings are erosions applied to dilated images, aiming on the restoration of dilated image structures:
.
Since erosion and dilation are dual transformations, also openings and closings are dual to each other with respect to complementation:
; .
Further significant features of openings (closings) are that they are increasing (decreasing), anti-extensive (extensive) and idempotent.
2.2 Connected openings and closings
“Classical” morphological openings and closings as described in Section 2.1 depend on the use of SEs of certain shape and size. In contrast, connected openings and closings analyze connected components (CCs). Two pixels of an image set are connected according to a connectivity rule. This connectivity rule is mostly given by the 4- and 8-connected neighbourhood. Connected openings (closings ) are in general reconstructions by dilation (erosion). Basing on geodesic dilations (erosions), a so-called mask image is proofed against a marker image as follows: If the pixel of interest (e.g. contained in marker image) is part of the CC, then this CC is retained – otherwise it is removed. Connected openings and closings are also dual transformations with respect to complementation:
; .
2.3 Attribute openings and closings
Connected openings (closings) combined with trivial openings (closings) lead to the definition of attribute openings (closings). Trivial openings use an increasing criterion to filter sets of CCs contained in an image. An exemplary increasing criterion is the number of pixels of a CC. For each CC in the image, it is proven, whether the criterion is fullfilled or not. If yes, the CC is retained, otherwise it is removed:
{ ,
where denotes the increasing criterion, for example:
.
Trivial closings are calculated the same way as trivial openings with respect to duality:
; .
Using an increasing criterion means the following: If one CC satisfies the criterion , all other “superior CCs” containing this CC also satisfy .
Attribute openings (closings ) are defined by a trivial opening applied to a connected opened (closed) image:
.
All transformations and operations explained above can directly be applied to binary images. Considering grayscale functions, which is the default case, analyzing remote sensing imagery, the so-called threshold superposition principle has to be taken into account. Each grayscale function can be expressed as sum of all its binary threshold components. Consequently, an attribute opening of grayscale images is applied by filtering each binary threshold component image. At this point it should be mentioned, that the reconstruction of the filtered grayscale image is not the same using increasing and non-increasing attributes. For more detailed information, compare (Dalla Mura, 2011). If non-increasing attributes are used, attribute openings (closings) are no longer openings (closings), since the increasingness is lost (Section 2.1). In this case, attribute openings (closings) become attribute thinnings (thickenings).
2.4 Attribute profiles (APs) and their derivatives DAPs
Considering one attribute and a sequence of attribute values (e.g. area, [2, 4]), an AP for one input image is calculated by iterative attribute openings and closings for each attribute value. Referring to the example above, the AP itself is accomplished by stacking the filtered images as follows:
; ;I; ; ].
It can be seen, that in this example, a 1x5-sized AP results. In other words: For each pixel of the input image, a 1x5 AP vector is calculated.
DAPs are the derivatives of APs. Following the example given above, the corresponding DAP is calculated as:
; ; ; ],
where:
, ,
, .
In the present example, a 1x4 DAP vector for each pixel of the input image is derived. Consequently, aiming on the analysis of change segments, DAP vectors result for each segment. Hence, change segments can be compared by their DAP signatures. International Archives of the Photogrammetry, Remote Sensing and Spatial Information Sciences,
3. DAP SIGNATURES OF CHANGE SEGMENTS
In this study, the focus is set on the automatic detection of similar changes between two HR SAR images acquired at different dates. For this, a TSX HS300 SpotLight repeat pass image pair of Greding (Germany) is used. The images were acquired on 2008/08/08 and 2008/08/19. For change detection, the images are co-registered. Furthermore, for morphological analysis, the SAR images are scaled to a radiometric resolution of 8 bit. Due to its heterogeneous content of change segments, a scene subset covering a highway parking place near Greding (Germany) is used.
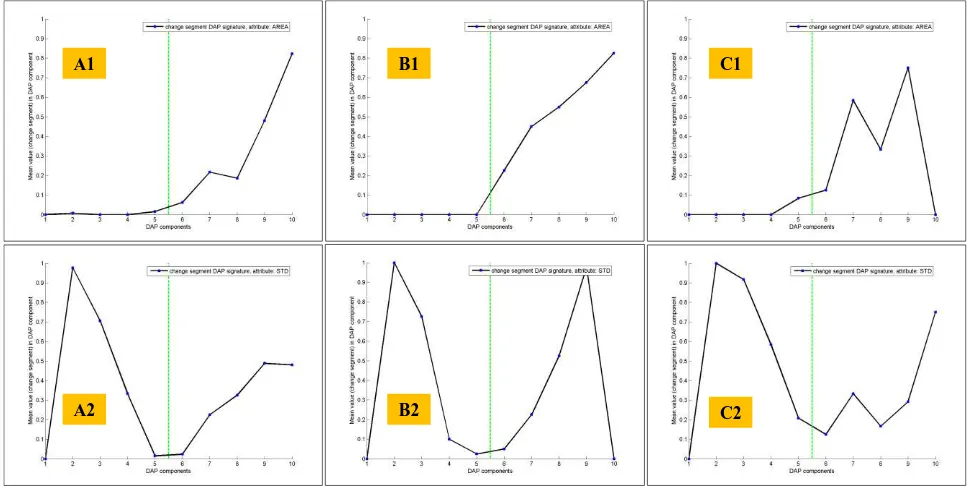
The DAP vectors for each segment contained in the binary ChangeMap (CM) are calculated as follows: First of all, one DAP for each SAR image referring to a given attribute and an attribute value sequence is calculated. Afterwards, the DAP pixel values for each change segment are extracted and normalized to [0;1]. Finally, for any change segment, one representative (mean) DAP value is calculated. As example, if the attribute area is used with the sequence of values [20, 40, 60, 80, 160], a 1x10 DAP vector for each change segment is calculated.
Since the DAP signatures of change segments are analyzed in this study, only the signatures calculated on the component of the image pair which contains the change are of interest. To get a first impression of the appearance of DAP signatures of change segments, three different changes signatures are visualized in
Figure 1. The corresponding change segments are given in
Figure 2. It can be seen that the DAP signatures of different
change segments differ from each other. Consequently, DAP signatures can be used to distinguish different changes. In the following section, a method for fully automatic detection of similar changes is proposed. DAP signatures of change segments are compared and their similarity is analyzed.
4. DETECTING SIMILAR CHANGES
The change detection method described in (Boldt et al., 2012) requires an amplitude image pair as data input. From this image
pair, a maximum ratio image is calculated. This ratio image is morphologically filtered and binarized using an automatic thresholding method. Finally, a binary CM with change segments on the foreground results.
For each pair of detected change segments, the similarity is
analyzed. Let and be two change segments. Focusing on the
area (number of CC pixels) attribute and considering an
attribute value sequence of length , this leads to:
[ ] [ ].
The similarity is analyzed using the L2-norm (Euclidian distance). Focusing on the two segments and , the distance is given as:
√∑ | | .
High similarity between two change segments exists, if is lower than a determined threshold . Analyzing the similarity using attributes, the are averaged. In this example, considering the attributes area and std ( ), two change segments are similar, if .
The detection of similar changes itself is done by a fully automatic region growing procedure, where is used as similarity (homogeneity) criterion. As consequence, similar change segments are clustered if the criterion is fulfilled. In the following, the attributes area, std (standard deviation in input image at CC location), diag (length of CC bounding box diagonal) and moi (moment of inertia of CC)are used for the detection of similar changes.
4.1 Area and std attribute
The usage of the area attribute (increasing, cf. Section 2.3) for DAP calculation denotes the analysis of the size of CCs (number of pixels).
Figure 1: DAP signatures of three different change segments. A1 (A2): Change segment on highway parking place, attribute area (std). B1 (B2): Moving target change segment, attribute area (std). C1 (C2): Other change segment, attribute area (std), see text for details.
A1
A2
B1
B2
C1
C2
In contrast, the standard deviation attribute std is an example for a non-increasing criterion (e.g., Dalla Mura, 2011). It is applied by analyzing the standard deviation in the original input image at CC locations.
Furthermore, to apply the area attribute for DAP signature calculation, the attribute value sequence of [10, 20, 40, 80, 160] was chosen. For the std attribute, the value sequence of [5, 15, 30, 40, 50] was used, which results in a 1by10 DAP vector for each change segment result.
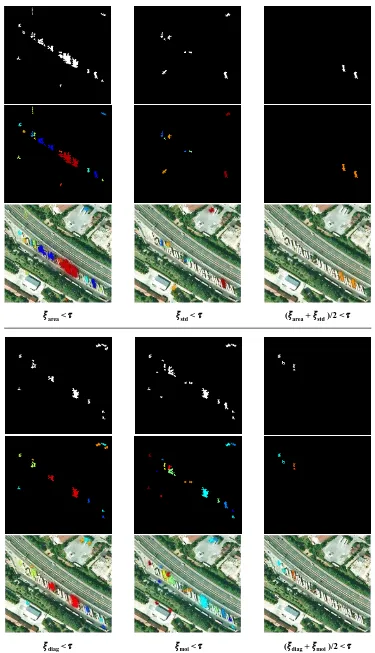
The detection of similar changes was performed using the attributes separately and in combination. The threshold was chosen in a supervised way to be 0.2. In Figure 3, the detection results are visualized. It can be seen that applying the area or the std attribute separately leads to inaccurate results (Figure 3). It is also shown that the combination of the two attributes leads to a more precise result. The detected change segments given in Figure 3 (upper half, right column) represent changes of comparable category (Boldt et al., 2012).
4.2 Furtherattributes diag and moi
Beside area and std, two further attributes analyzing the CCs are the length of the diagonal of the bounding box diag (increasing) and the moment of inertia moi (non-increasing). The moment of inertia equals approximately the first moment invariant given by (Hu, 1962) and characterizes the elongation of a CC with respect to its center of mass (Dalla Mura, 2010). In other words, the moi attribute represents a measure of compactness, since elongated CCs have higher moi values than more compact CCs.
In this study, the diag and the moi attribute were tested on their capability for the detection of similar changes. The results are
compared to the detections using the area and the std attribute in combination as described in Section 4.1.
The following attribute value sequences were chosen: [5, 10, 20,
40, 80] for the diag attribute, and [0.1, 0.3, 0.5, 0.7, 0.9] for the moi attribute, respectively.
In Figure 3 (lower half), the detection results using the diag and the moi attributes are visualized. In comparison to the usage of
the area and std attributes, it can be seen that other change
segments appear similar to each other. Furthermore, it can also be seen that the combination of both attributes leads to a more precise result compared to the single usage of one attribute.
4.3 Comparison and Assessment
Focusing on the test subset representing a highway parking place near Greding (Germany) with its surroundings, different change segments appear similar using different attribute combinations. Consequently, since different attribute combinations lead to different detection results, it can be resumed that the choice of attributes and their combination depends on the specific case of application. Furthermore, it should be generally kept in mind that the detection result depends on the choice of the attribute value sequences. Here, learning the decision threshold from training data would be helpful. Unfortunately, no real ground-truth is available for these data at the moment. The evaluation can thus only check for plausible changes in the scene. In the future, further SAR specific attributes for the DAP analysis will be investigated. For example statistical (e.g. Coefficient of variation Cov) or radiometric attributes (e.g. normalized radar cross section NRCS) will be considered.
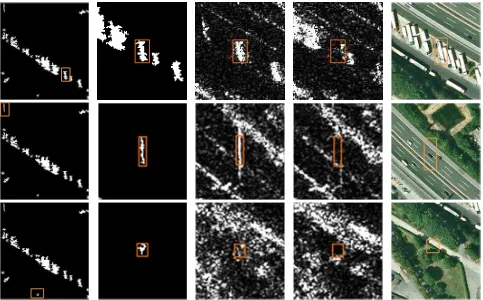
Figure 2: Matching change segments to Figure 1. Upper row: Change segment on highway parking place; center row: Moving target change segment; Lower row: Other change segment. From left to right: Location of change segment in subset of CM, change segment zoom-in, amplitude image subset t1, amplitude image subset t2, location of change segment in Google Earth imagery. International Archives of the Photogrammetry, Remote Sensing and Spatial Information Sciences,
Figure 3: Detected similar changes. Upper half: Attributes area, std seperated and combined; lower half: Attributes diag, moi seperated and combined. Upper and lower half: Detected similar changes (upper row), detected similar changes color-coded (center row),
detected similar changes color-coded visualized as overlay image in Google Earth (lower row). Additionally, clusters of similar changes containing at least two segments are random color-coded, where each cluster gets one color.
diag< moi< ( diag+ moi)/2 < area< std< ( area+ std)/2 <
5. CONCLUSION AND OUTLOOK
In this paper, a fully automatic method for the detection of similar changes using a HR SAR image pair is proposed. The detection itself is done by using the L2-norm (Euclidian distance) as similarity criterion considering the DAP signatures calculated for each change segment. Similar changes are merged to clusters using a region growing algorithm.
Four different attributes are used for the DAP vector calculation: area, std, diag and moi. It is shown that a combination of attributes (e.g., area and std) leads to more precise results compared to the use of a single attribute. Depending on the chosen attributes, different changes appear similar. This can be seen by comparing the detection results of the two attribute combinations area & std and diag & moi, where different change segments at different areas of the highway parking place are detected. In case of the area & std detection result, the similar changes have already been categorized as trailer trucks (Boldt et al., 2012) which were moved between the image acquisition dates. As a consequence, this method is able to be adapted to the specific problem. Future work will comprise the use of SAR-specific attributes (statistical, backscatter). Using ground truth data, it will be investigated which combination of attributes leads to the most precise detection results. Furthermore, the detection method proposed in this paper will be extended on the use of time series data.
ACKNOWLEDGMENT
The original SAR image data used in this study was kindly provided by Astrium Services / Infoterra GmbH in a coope-ration framework with Fraunhofer IOSB, department scene analysis.
6. REFERENCES
Acito, N., Resta, S., Diani, M., Corsini, G., Rossi, A., 2012. Unsupervised change detection in very high resolution COSMO-SkyMed SAR Images. In: Proceedings of SPIE Europe Remote Sensing 2012, vol. 8536, pp. 853602-1 – 853602-9.
Breen, E. J., Jones, R., 1996. Attribute Openings, Thinnings and Granulometries. Article No. 0066, Computer Vision and Image Understanding, 64(3), pp. 377-389. Resolution SAR Images for Surveillance Applications. In: IEEE Proceedings of International Geoscience and Remote Sensing Symposium IGARSS 2012, pp. 1992-1995.
Dalla Mura, M., Benediktsson, J. A., Waske, B., Bruzzone, L., 2010. Morphological Attribute Profiles for the Analysis of Very High Resolution Images. In: IEEE Transactions on Geoscience and Remote Sensing, 48(10), pp. 3747-3762.
Dalla Mura, M., 2011. Advanced Techniques based on Mathematical Morphology for the Analysis of Remote Sensing
Images. PhD thesis, University of Trento / University of Iceland, http://eprints-phd.biblio.unitn.it/592/, pp. 167.
Falco, N., Dalla Mura, M., Bovolo, F., Benediktsson, J. A., Bruzzone, L., 2010. Study on the Capabilities of Morphological Attribute Profiles in Change Detection on VHR Images. In: Proceedings of SPIE Europe Remote Sensing 2010, vol. 7830, pp. 783016-1 - 783016-9.
Gong, M., Cao, Y., Wu, Q., 2012. A Neighborhood-Based Ratio Approach for Change Detection in SAR Images. In: IEEE Geoscience and Remote Sensing Letters, 9(2), pp. 307-311.
Hu, M.-K., 1962. Visual Pattern Recognition by Moment Invariants. In: IRE Transactions on Information Theory, vol. 8, pp. 179 - 187.
Sahoo, P. K., Arora, G., 2004. A thresholding method based on two-dimensional Renyi’s entropy. In:Pattern Recognition, vol. 37, pp. 1149-1161.
Serra, J., Vincent, L., 1992. An Overview of Morphological Filtering. In: Circuits, Systems and Signal Processing, 11(1), pp. 47-108.
Soille, P. 1998. Morphologische Bildverarbeitung: Grundlagen, Methoden, Anwendungen, Springer Verlag Berlin Heidelberg, isbn: 3-540-64323-0, pp.: 316.
Weih Jr., R. C., Riggan Jr., N. D., 2010. Object-Based Classification vs. Pixel-Based Classification: Comparative Importance of Multi-Resolution Imagery. In: Proceedings of GEOBIA 2010: Geographic Object-Based Image Analysis, vol. XXXVIII-4/C7.