3D MODELING OF ARCHITECTURE BY EDGE-MATCHING AND INTEGRATING
THE POINT CLOUDS OF LASER SCANNER AND THOSE OF DIGITAL CAMERA
N.Kochi a,
*, K. Kitamura a, T. Sasaki a, S. Kaneko b
a R&D Center, TOPCON CORPORATION, 75-1, Hasunuma-cho, Itabashi-ku, Tokyo - (n.kochi, , )@topcon.co.jp b
Hokkaido University Graduate School of Information Science and Technology, Kita14, Nishi9, Kita-ku, Sapporo,060-0814, Hokkaido, Japan
Commission V, WG V/4
KEY WORDS: Photogrammetry, TLS, Image, Matching, Edge, Registration, Point Cloud, Architecture
ABSTRACT:
We have been developing the stereo-matching method and its system by digital photogrammetry using a digital camera to make 3D Measurement of various objects. We are also developing the technology to process 3D point clouds of enormous amount obtained through Terrestrial Laser Scanner (TLS). But this time, we have developed the technology to produce a Surface-Model by detecting the 3D edges on the stereo-images of digital camera. Then we arrived to register the 3D data obtained from the stereo-images and the 3D edge data detected on the 3D point-cloud of TLS, and thus succeeded to develop the new technology to fuse the 3D data of Camera and TLS. The basic idea is to take stereo-pictures by a digital camera around the areas where the scanner cannot, because of the occlusion. The camera, with the digital photogrammetry, can acquire the data of complicated and hidden areas instantly, thus shutting out the possibility of noises in a blink. The data of the camera are then integrated into the data of the scanner to produce automatically the model of great perfection. In this presentation, therefore, we will show (1) how to detect the 3D edges on the photo images and to detect from the scanner’s point-cloud, (2) how to register the data of both 3D edges to produce the unified model, (3) how to assess the accuracy and the speed of analysing process, which turned out to be quite satisfactory.
*
1. INTRODUCTION
We have long been developing the stereo-matching method and its system by Digital Photogrametry using digital camera to make 3D Measurement of various objects (Kochi 2003, 2009). We are also developing the technology to process 3D point clouds of enormous amount obtained through Terrestrial Laser Scanner (TLS). We are making segmentation and labeling from the obtained 3D point cloud and, out of the data thus processed, we are extracting the plane and ridgeline to make image-replenishment and registration possible (Kitamura, Kochi et al. 2010). Ordinarily, with the TLS we can obtain huge amount of highly dense 3D point cloud automatically. And by the image-sensor mounted in the TLS, we can acquire the image corresponding to all the obtained 3D point cloud by point-to point precision. Besides, the TLS enables us to measure the area with no feature on the surface of the architecture. And as the density of point cloud is high, we can make highly detailed 3D model of complicated forms. But the trouble is that it takes time. It allows, when we measure the object like architecture, the moving objects such as pedestrians, cars, trees etc, to create noise or occlusion, obstructing the accurate grasp of the 3D Measurement. On the other hand, with the 3D Measurement by a digital camera we can obtain the result just instantly and exclude the noise of car and pedestrians. So handy it is that you can not only obtain the data swiftly, but also it can get into hidden narrow areas and take pictures without cumbersome setting of instruments.
The weakness of the Digital Photogrammetry is that, it is difficult to measure the area without features. Without orientation we cannot make a model. And to make measurement of the absolute size we need 3D control points. We are trying now, therefore, to overcome the weak points of both systems
and combine their strong points in our 3D Measurement. We acquire the highly dense point clouds by TLS and the parts in occlusion or the place where we cannot use scanner we can offset by 3D Measurement of digital camera. And then we combine the 3D Measurement data of both scanner and camera. And finally we can construct the real size 3D model by acquiring the control points from TLS. Here the problem is (1) to make stereo-matching in the scene where there is no feature, (2) to make orientation and (3) to register the 3D point-cloud obtained by TLS and the 3D data obtained by the digital camera. In order to solve these problems, however, we have developed a new technology of 3D Edge-Matching, which enabled (1) Automatic orientation by detection of the edges, (2) Production of model from the camera’s images and (3) Registration of corresponding points between the 3D edges of point cloud obtained from the TLS and from the 3D edges of camera’s images.
2. OUR NEW RECCOMENDED METHOD
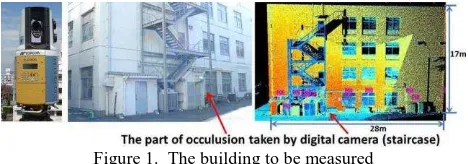
To obtain the point clouds, we use the Topcon Laser Scanner GLS-1500 (Figure 1 Left). To process the point clouds, we use the software (Topcon Scan-Master) which we are actually developing to integrate the segmentation, labeling, and 3D edge detecting function (Kitamura, Kochi et al. 2010).
For Digital Camera Photogrammetry, we use a digital SLR camera (Nicon D200:3872 x 2592 pixels)with 28mm lens.
For analysis software we use Topcon software “Image-Master,” to which have added a new function of Edge-Matching, which we are now developing. For accuracy assessment, we took pictures, placing the scale bar against the building. For International Archives of the Photogrammetry, Remote Sensing and Spatial Information Sciences, Volume XXXIX-B5, 2012
registration of the entire building, we pasted retro-targets against the wall and measured with the total station. The object measured is a part of Topcon office (28 x 17m). We obtained its point cloud by TLS. As to the occluded area (about 3m x 2m), including the overlapping area for registration, we took pictures by camera, and made modeling (Figure 1).
Figure 1. The building to be measured
Left: Laser Scanner, Middle: Photograph, Right: Point-cloud
The flow of measuring process is as follows.
(1) To acquire the 3D point clouds of architecture by TLS (2) To acquire the stereo pictures of the areas of the same object,
which the scanner could not take. Here we take pictures overlapping with the image taken in (1)
(3) To make segmentation and labelling out of the point cloud obtained from TLS to extract the plane and 3D edges (Chapter3).
(4) We detect the edges on the more than two or more stereo pictures obtained by the digital camera (Chapter 4.1). (5) We make the automatic orientation, using the both ends of
the straight line of the edge (Chapter 4.2).
(6) After the orientation (a) we make Edge-Matching, using the rectified stereo-images. (b) We detect the 3D edges, and (c) we make a model (Chapter 4.3)
(7) (a) We estimate the correspondence between the 3D edges obtained by the Image processing and the 3D edges obtained from the process of point cloud of TLS. (b) Next, we rectify the scale of model created by photogrammetry. (c) Simultaneously, we make registration of 3D edges of point cloud of TLS and the 3D edges of camera images (Chapter 5.1).
In each following chapter, we will explain (3)-(8), following the order of procedure as written above. And in the chapter 6, as the assessment of our recommended method, we will explain the accuracy, the amount of time of measuring as well as the amount of time spent for the analysing process.
3. THE DETECTION OF 3D EDGES BY LASER POINT CLOUD
In this section we explain the segmentation algorithm applied to the data as pre-processing of the registration procedure. For this process is adopted the method which we had developed previously (Kitamura, Kochi et al. 2010). The flowchart of Figure 2 depicts the different steps. At first, a 2D image is obtained from the point cloud. Because TLS controls the direction of the emitted beam by precise vertical and horizontal angles, these two types of angles can be considered as the two axes of an image and a 2D representation (range image) of the point cloud can thus be generated. This process is performed for each viewpoint. The single range images are then segmented by the region growing method. Normal vectors are computed for each point, as well as the distance from the point of interest to neighbours. The angle differences of the vectors and the distance between them are compared, the same label is then assigned if these values are less than predetermined thresholds.
After the segmentation, edges are extracted as the intersection line of two differently labelled planes. The final result of the segmentation process consists thus of a set of extracted planes, each of them have information about its center of gravity, its normal vector, the number of points, its area and its boundaries. Figure 3 shows, for three viewpoints, the Building which is used for experiments (Left), the results of the segmentation process, different colours represent different planes (Middle), and the result of 3D edges detection (Right).
Figure 2. Flow chart of Point Cloud processing
Figure 3. Left: Point Cloud data, Middle: Segmentation result, Right: 3D Edge detection result
4. THE 3D EDGE DETECTION BY THE IMAGE MATCHING OF STEREO IMAGES
The detection of the 3D edges from model producing images, the model production is done by the following procedure. (1) We detect the edges from the right and left stereo-images.
As to the edge detection, the inclination of the edge is shown as its intensity. So, we use the data to find both the intensity and length of the edge.
(2) From thus detected features we automatically detect orientation points and with these points we make orientation. (3) After the orientation, we make rectified Images.
(4) Again, we make edge detection.
With the ends of edge as template, we make stereo-matching and look for corresponding points. If we find the 2 ends constituting the edges (straight line) identical, we understand that the edge-matching has been successful and take it out as the 3D edges.
(5) Surface-Model production. And with this 3D edges we make stereo-matching and produce a Surface (Photogrammetry) Model.
Here we explain edge detection, automatic orientation, 3D edge detection as well as the Edge-Matching to produce the model.
4.1 Edge Detection
For edge detection, we usually use Canny Edge Detector (Canny ,1986), but for detecting the straight lines which constitute the feature of a structure, there are lots of unnecessary noises, which make it difficult to discern the edge. We have also well known “Hough Transformation” (Dura, 1972) for the detection of straight line from the edge, but it takes too much time. We have, therefore, developed a new method as shown in the flow chart Figure 4 Left. For the process of edge detection we make first preliminary process (smoothing, brightness adjustment etc.), before we proceed to the edge detection. And we extract the element of a straight line by eliminating the International Archives of the Photogrammetry, Remote Sensing and Spatial Information Sciences, Volume XXXIX-B5, 2012
corner of the edge. After that, with the edge inclination as its intensity, we assess the intensity and length and determine what is above the threshold as edge (2 ends of edge are registered as straight line),
Figure 4. Left: Flow chart of edge detection, Right: Corner detection
4.1.1 Method of Edge Detection: For detecting an edge we used “Sobel Filter”. We first made the edge line as skinny as possible to raise the accuracy by the process of NMS (Non Maximum Suppression: Canny, 1986) which discerns with the edge intensity and direction. And then we made threshold test with the edge intensity. The NMS is the process in which as long as the attended pixel has the maximum value, it remains as the edge, and if not, it is deleted, while comparing the attended pixel’s direction and the intensity of vertical position to the edge. Since the faithful detection of the contours is done with the straight line detection, the threshold value is set low so that many edges can be extracted. This time, we eliminated the edge whose intensity I was below 20. (equation (1))
4.1.2 Straight Line Detection: As to the straight line detection, we detected the corner of the straight line which is attended to and after discarding this corner we detected it as a straight line. To detect the corner we calculated the angle of the intersecting two vectors of the two pixels (preceding and following pixel) at the center of the pixel attended to. If theθis
more than 30 degrees, we judged it to be the corner (Figure 4 Right).
4.1.3 Edge Criterion: The Edge is defined and labeled as an Edge, when the highest intensity I x Edge length L exceeds a certain threshold. And all the rest which are below this line were discarded as noises. As to the threshold, we acquired it by our experiments. This time we defined it as the value, which is 5 (=k) times of the highest intensity of the edge spreading on the image (equation (1)).
xsi ysi xei yei else Noisei
The Figure 5 on the Left shows the Edges detected by a Canny Edge Detector. Right shows the edges detected by our new method. We can see that the Canny Detector leaves lots of noises, but our system obtained only straight lines with satisfactory accuracy.
Figure 5. Edge Detection Result Left : Canny Detector, Right: Our System
4.2 Automatic Orientation by Edge Detection
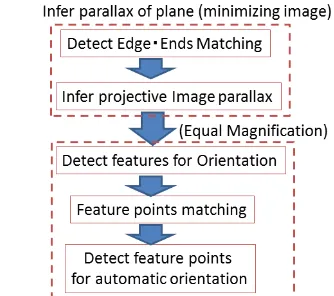
In order to make Stereo-Matching on the photographed Images, and to obtain the 3D coordinates as well as to produce the Surface-Model, it is necessary to get the exterior orientation parameters. For this time took a building, as the object of measurement. The object of measurement is, therefore, basically consisted of horizontal edges and vertical edges. So, we worked on matching with this premise and obtained automatically the features for the orientation. The Figure 6 shows the flow of the process for the automatic orientation. In this process we applied NMS to make skinny lines. We supposed the object as a flat plane and calculated the amount of parallax between the corresponding points on the right and left stereo-image.
Figure 6. Processing flow of the Automatic Orientation
That is to say, we set up both ends of edge line as template. And using the features, which were obtained by the matching, and supposing the object of measuring as a flat plane, we calculate the parameters for projective transformation. We determined the estimated parallax by using the points where the amount of divergence of the two positions is small, that is, the position of the features obtained after the projective transformation and the position of the features obtained after matching. Next, using the data of the real size of the image (equal magnification) we detect the feature points. And we determine the “searching area” for the corresponding points of stereo Image of the feature points using the estimated parallax. And then we work on the matching. The future points thus obtained now become the future points of orientation. By taking all these steps, we can minimize the erroneous correspondence and acquire the feature points for highly accurate orientation. And based on the obtained orientation points, we make relative orientation and bundle adjustment to acquire the element of external orientation of the camera.
Figure 7 Left is the end points obtained from the edge deduction (The end points detected from the equation (1)). Figure 7 Right is the feature points obtained by automatic orientation.
Figure 7. Result of feature points detection Left: Ends of edges, Right: Feature points for automatic orientation
4.3 3D Edge Detection by Edge Matching and Model Production
We make rectification image by the external orientation parameters which has been automatically obtained. Out of these Images we detect 3D edges, on which we make area-based Surface-Matching to create Surface (photogrammetry) Model As we are producing the final Surface-Model, we make matching of the feature points which are not limited to the horizontal plane.
The flow of the process (Figure 8) is: (1) Estimation of Parallax for Matching, (2) The detection of 3D edges by Edge-Matching. (3) The area-based Surface Matching to produce the Surface-Model with the TIN-LSM method (Kochi, Ito et al. 2003), into which 3D edges obtained in (2) are inserted.
Here, we will explain following the flowchart of Figure 8. First, for estimation of the parallax, we make the OCM (Orientation Code Matching: Ulah, Kaneko et el. 2001) using OCR (Orientation Code Richness: Kitamura, Kochi, Kaneko et al. 2009). And then we clean the error correspondences, based on the acquired corresponding points. This is done by Back-Matching Method. The acquired corresponding points are also used in the parallax estimation, necessary for Edge-Matching. OCM is known as robust for lighting condition and occlusions. So, it is effective to make highly reliable parallax estimation when we make Edge-Matching, which we are planning to do later.
Next, we make Edge-Matching. Here we detect 3D edges by stereo-matching with the end of edge as template. Further, we seek to make the Surface-Model with the obtained 3D edges integrated into LSM, which uses Coarse to Fine process.
Figure 8. Flow of Matching Process
The LSM integrated with Coarse to Fine method (TIN-LSM: Kochi, Ito, et al. 2003) is not only robust to geometric distortion but very speedy. The Edge Surface-Matching, therefore, as it takes over the strong capability in detecting lighting effects as well as occlusions, it is the effective method, when we have to acquire the corresponding points with high speed and accuracy even for the geometric distortion. Figure 9 shows the effect of these processes.
Figure 9(a) shows the result of only TIN-LSM method. (b) shows the result of 3D edge detection by the Edge-Matching. (c) shows the result of the Surface-Matching into which 3D edge is integrated. (d) shows the result of the superposition of the 3D edges on (c) which had been texture-mapped.
With only TIN-LSM method (a), the area of the staircase is crushed, but with our new method (c), it is clearly detected.
Figure 9. Matching Result (a) Only TIN-LSM method. (b) Edge-Matching (3D Edge). (c) Edge Surface-Matching. (d) Superposition of 3D Edge onto the texture-mapped Edge
Surface-Matching result
5. RESISTRATION OF MODEL BY 3D EDGES
5.1 Scale Adjustment and Registration by 3D edges
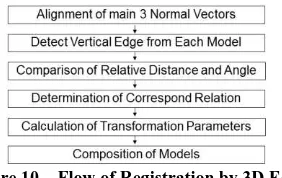
Here we make the registration of 3D model which was made from the point-cloud data of TLS by the method of the third chapter and the 3D model produced from the 3D data of photogrammetry which was made from Surface-Matching of the fourth chapter. But as the model of the photogrammetry has no actual size yet at this stage, we have to make it with the registration. In this chapter we recommend the method to register by using the 3D edges obtained from each model as shown in Figure 10.
Figure 10. Flow of Registration by 3D Edge
First, on the Manhattan-World Grammars (Venegas, 2010), which considers basically that the building is composed of 3 vectors perpendicular to each other, we obtain the main 3 direction normal vectors from each model, and make roughly the alignment of models direction. Next, we detect the vertical 3D edges from the model and look for the combination of the edges which have the similar positioning of distance and angle between the edges. As explained before, the model of photogrammetry has no actual scale yet, here we use the relative positional value. Figure 11 shows the bird view of the vertical edges, which are shown in as black circles. Here, we explain first, the calculation of the distance by the equation of the figure 11 Left. First, choosing one of the vertical edges as a standard International Archives of the Photogrammetry, Remote Sensing and Spatial Information Sciences, Volume XXXIX-B5, 2012
edge (Es), we calculate the distance (l1, l2, l3)between the
standard edge and the rest of the edges (E1, E2, E3) and normalize one of the distances. Second, as to the calculation of the angle, we use the equation of the Figure 11 Right.
As we have already done the model position alignment on the basis of hypothesis Manhattan World, we consider the angle calculating value as the absolute value. And we calculate the angle difference (a1, a2, a3) between the vector, which is drawn from the standard edge to the rest of the edges, and x axis. Thus, after we have calculated the relative distances between standard edge and the rest of the edges, as well as the set of the angle (ln, an), we finally come to determine the combination which has high similarity as the corresponding edge. The degree of similitude was obtained by the following equation;
Once the corresponding edge is determined, we put the data of the photogrammetry model into the point-cloud model. This is done by affine transformation; that is, using the affine parameters, which equalize the scale of the 3 axis. In this way, we can give photogrammetry model the actual size and at the same time work on the registration.
Fugure 11. Glance at 3D Edge Matching Left: Calculation from the Standard Edge, Right: Calculation of Angle from the Standard Edge
Figure 12. Left: The Edge detected from the rectified image. Right: The result of 3D Edge-Matching.
The red line: the 3D edges of the Photogrammetry model. The blue: the 3D edges of the Point Cloud model
The red line on Figure 12 Left is the vertical edges detected out of rectified Image. Here we chose the 6 longest edges in the length order for the registration and searched for the best combination with the point cloud edges. The Figure 12 Right is the result of registration. The red line is the edges detected from
photogrammetry model. The blue lines are the edges detected from the point cloud model.
Here as a prerequisite, we use the relative distance when we compare the edges, at least three vertical edges have to be detected from each model. Furthermore, after this process, when we have to increase the accuracy of the scale estimation and the registration, we must make one of the two following processes. One is to make the detailed Edge-Matching between the camera image and scanner image (range image) in the overlapping area. Or, we have to make registration, using ICP method (Besl and McKay, 1992). ICP method requires initial value which has a certain degree of accuracy. And by using this 3D edge registration process as its first position registration process, we can make the registration with higher accuracy.
5.2 Model Integration
Figure 13 shows the integration model obtained by our recommended method. The left Image shows only the point-cloud before integration, and the right image shows the result of integration of the point-cloud of TLS and the photogrammetry Model. We can notice here that the model of the part of the staircase, which had been hidden and unable to measure by Laser Scanner point-cloud, was successfully integrated.
Figure 13. Model Integration.
Left: Before Integration. Right: After Integration
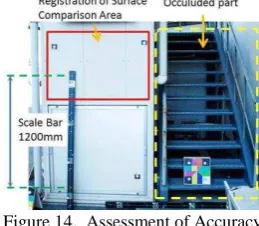
6. ASSESSMENT OF RESULT comparing the position of the planes after the adjustment of the planes of both point-cloud model and photogrammetry model (Figure 14).
Figure 14. Assessment of Accuracy
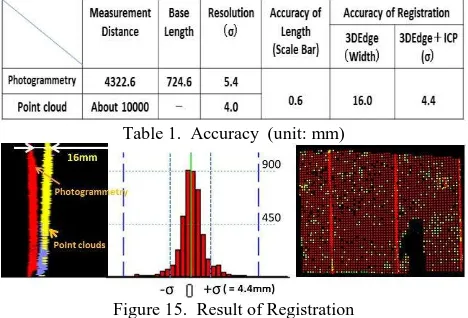
The result is shown in Table 1. The scale bar was 1199.2mm in length, with the accuracy of 0.1mm. We used it on the integrated model after scale adjustment and registration, the length was 1199.8mm and error was 0.6mm. To confirm the accuracy of registration, we compared the amount of gap after the registration of the planes of 1m x 1.5m shown in Figure 14 upper left. The number of points compared was 3362, which was obtained by the stereo-matching.
Figure 15 Left shows the amount of discrepancy of registration by 3D Edge method. The figure is that of the side of the compared plane after it had been turned 90 degrees from the front position (the direction of Figure 14). Evidently it is 16mm inclined from top to bottom. Furthermore, with this state of things as the initial value, we made detailed registration with ICP. As a result, the amount of discrepancy was found to be 4.4mm at a standard deviation (σ). Figure 15 Middle shows
the error histogram of the result of more detailed registration by ICP. Figure 15 Right shows the distribution of errors on the plane. In the figure Right, the red colour shows the points, which is within ± σ, and the yellow points show the points
within ±2σ. At this place of the building, the image
resolution of photogrammetry model (σ) is: the horizontal
plane resolution Δxy= 0.9mm, the depth resolution Δz=
5.4mm, the resolution of TLS is 4mm at a standard deviation. This means the result is quite satisfactory because registration accuracy is the same with that of Photogrammetry and TLS.
Table 1. Accuracy (unit: mm)
Figure 15. Result of Registration
Left: 3D Edge Method, Middle: Histogram of 3D Edge +ICP , Right: Distribution of errors of 3D Edge +ICP
6.2 Time for Acquiring Data and Analysis
In our case, the data acquiring time and analysing time as in Table 2. For the building of size 28 x17m, though it would take about 60 minutes to obtain point-cloud, the time we spent for the actual analysis of point-cloud took 67 seconds with 2,500,000 points. And as to the photogrammetry, 1 Model (stereo-image) needs only 180 seconds from shot to analysis. As to the model integration, we spent 1 second. The total analysing process was 187 seconds. Thus, we were able to attain extremely high speed performance with our maneuverability.
Table 2. Data acquisition and analysis time
7. CONCLUSION
We have developed a new effective method to produce 3D model by integrating the point-cloud obtained by TLS and the 3D data obtained by photogrammetry. Important is the fact that we have integrated Edge-Matching method into stereo-matching method of photogrammetry. With this new method we
succeeded to automatize all the steps of image production, including orientation, 3D edge detection and the model production. Even in the area of measuring building which has not much features and which the area matching method was not strong, the new method can produce a model in a very short time. Besides, with the point cloud obtained by TLS, we can now make segmentation, labelling and detection of 3D edges. And we came to register together the model produced by photogrammetry and the model produced by TLS point-cloud by the 3D edges detected by both methods with the accuracy of 16mm, which was further improved up to 4.4mm by more detailed registration. This is the satisfactory accuracy equivalent to measurement resolution of photogrammetry and TLS. The advantage of our method is that we can get the data of occulusion area or small areas or complex areas where the TLS cannot work, but a handy Digital Camera can easily work. And now we can obtain and analyse all the data automatically in a very short time. This means also that with our photogrammetry, as we can work with relative model scale we do not require scale nor control points, we no longer need target to measure. And in our case we actually spent only 3 minutes from the Image acquisition to complete a model.
Furthermore, even measurement of bigger buildings and its detailed model production would become so much easier and faster. If we combine Laser Scanner and Digital Camera with all its automatic operation, we can economize huge amount of time. We are planning to improve yet more our matching method, making it more robust and accurate. And for the measurement of much bigger areas, our technology of combining images by automatic orientation and automatic analysis will provide you a valuable help.
We really wish to establish this new technology to support many entrepreneurs.
References :
Besl, P.J., and McKay, N.D., 1992. A Method for Registration of 3-D Shapes. IEEE Transaction on Pattern Analysis and Machine Intelligence, vol.14, no.2, pp.239-256,
Canny, J., A 1986. Computational Approach To Edge Detection. IEEE Trans. Pattern Analysis and Machine Intelligence, 8:679-714,
Duda, R. O. and P. E. Hart, 1972. Use of the Hough Transformation to Detect Lines and Curves in Pictures. Comm. ACM, Vol. 15, pp. 11–15.
Kochi, N., Ito, T., et al, 2003. PC-Based 3D Image Measuring Station with Digital Camera an Example of its Actual Application on a Historical Ruin. International Archives of Photogrammetry and Remote Sensing, Vol.XXXIV-5/W12, p.117-120
Kochi, N., 2009. Photogrammetry, Handbook of Optical Metrology : Principles and Applications, Yoshizawa,T.’(Ed.), Taylor and Francis, Chapter 22
Kitamura , K., Kochi , Kaneko ,S., et al. 2009. Human Body Measurement by Robust Stereo-matching. 9th Conference on Optical 3-D Measurement Techniques, Vol.2 pp254-263
Kitamura, K., D'Apuzzo, N., Kochi, N., and Kaneko, S., 2010. Automated Extraction of Break Lines in TLS Data of Real Environment. ISPRS, Vol. XXXVIII, Com V, pp.331-336
Ullah, F., Kaneko, S., and Igarashi, S., 2001.Orientation code matching for robust object search, IEICE Trans. of Inf. & Sys, E84-D(8), pp.999-1006.
Vanegas, C. A., Aliaga, D. G., Benes, B., 2010. Building Reconstruction using Manhattan-World Grammars. CVRP, pp.358-365