LASER-BASED SLAM WITH EFFICIENT OCCUPANCY LIKELIHOOD MAP
LEARNING FOR DYNAMIC INDOOR SCENES
Li Li, Jian Yao∗
, Renping Xie, Jinge Tu, Chen Feng
School of Remote Sensing and Information Engineering, Wuhan University, Wuhan, Hubei, P.R. China Email: [email protected] Web: http://cvrs.whu.edu.cn/
Commission THS, WG ThS9
KEY WORDS:Scan Matching, Unmanned Ground Vehicle (UGV), Occupancy Likelihood Map, Simultaneous Localization and Mapping (SLAM)
ABSTRACT:
Location-Based Services (LBS) have attracted growing attention in recent years, especially in indoor environments. The fundamental technique of LBS is the map building for unknown environments, this technique also named as simultaneous localization and mapping (SLAM) in robotic society. In this paper, we propose a novel approach for SLAM in dynamic indoor scenes based on a 2D laser scanner mounted on a mobile Unmanned Ground Vehicle (UGV) with the help of the grid-based occupancy likelihood map. Instead of applying scan matching in two adjacent scans, we propose to match current scan with the occupancy likelihood map learned from all previous scans in multiple scales to avoid the accumulation of matching errors. Due to that the acquisition of the points in a scan is sequential but not simultaneous, there unavoidably exists the scan distortion at different extents. To compensate the scan distortion caused by the motion of the UGV, we propose to integrate a velocity of a laser range finder (LRF) into the scan matching optimization framework. Besides, to reduce the effect of dynamic objects such as walking pedestrians often existed in indoor scenes as much as possible, we propose a new occupancy likelihood map learning strategy by increasing or decreasing the probability of each occupancy grid after each scan matching. Experimental results in several challenged indoor scenes demonstrate that our proposed approach is capable of providing high-precision SLAM results.
1. INTRODUCTION
In outdoor environments, the Global Navigation Satellite System (GNSS) can provide accuracy position and navigation services for the robots. However, in indoor environments, GNSS is unavailable due to the signals are very weak or even not received, which results in that the moving location of the robots in an indoor scene cannot be simply obtained. For an intelligent robot, it must know itself where it is before it makes the next decision and completes a specific task. In general, this problem is formulated as the simultaneous localization and mapping (SLAM) in the robotics society, which is a chicken and egg problem. It is a process of building and updating a map of an unknown environment based on the data collected by the sensors mounted on some mobile robot platform (e.g., a mobile Unmanned Ground Vehicle (UGV) used in this paper), and simultaneously determining itself where it is located on the map.
SLAM is a classical and fundamental problem in the fields of robotics society and computer vision, and has received increasing attention over recent years. In efforts to solve this problem, a va-riety of methods based on different sensors have been developed. Those approaches can be divided into three main categories: vision-based [16], RGBD-based and LiDAR-based approaches. Vision-based SLAM is the cheapest approach, which only uses a monocular camera or stereo one to achieve autonomous navi-gation and mapping in unknown environments [16,11,6], but it may be failed in the regions with poor texture. To improve the robustness of SLAM in poorly-textured regions, many researches had developed a series of robust techniques based on RGBD cameras, such as Kinect sensor [10,8]. However, these RGBD-based approaches are only suitable for relatively small indoor scenes due to the effective range of most popular RGBD cameras.
∗Corresponding author
Another kind of representative approaches is the use of a laser scanner [15,27,26], which has been successfully used on UGVs, Unmanned Surface Vehicles (USVs) and Micro Air Vehicles (MAVs), and so on. Our work in this paper also applies the laser scan data collected by a laser scanner mounted on a UGV to solve the SLAM problem for the indoor environments.
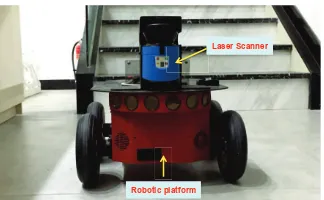
Laser Scanner
Robotic platform
Figure 1: A photo of the mobile UGV used in our paper, which is comprised of a laser scanner SICK LMS-100 and a robotic platform Pioneer 3-AT.
real-time correlative scan matching approach by formulating this problem in a probabilistic framework, which used an exhaustive sampling based approach to find the rigid-body transformation that maximizes the probability of the observed data.
However, most of scan matching methods above mentioned gen-erally operate on consecutive pairs of scans, without maintaining any historical data. Therefore, any small error in each scan matching will be retained and accumulated as time goes on, resulting in drift. To solve this issue, many people proposed to apply the grid-map based method to process the laser scan matching [12,20, 1,22, 15, 2, 23, 24,18, 21]. Generally, it first generates a grid-based occupancy likelihood map based on all previous scans, and then applies the scan-to-map matching to find the optimal rigid-body transformation which is used to align the points of current scan to the whole map. Kohlbrecher et al. [15] developed a system for fast learning of occupancy grid maps by using a fast approximation of map gradients and a multi-resolution grid. They applied the Gauss-Newton approach to find the rigid-body transformation between current scan with the existing map learned from all previous scans. Bachrach et al. [2] proposed a novel estimation, navigation and control system for a MAV system in GPS-denied environments. It follows the contour-slope model proposed in [20] of measure-ment likelihood of subsequent scans as a generative probabilistic model given by a Gaussian blur of a polygonal reduction of previous scans, which was also utilized in [1]. Tang et al. [23] developed a mobile UGV indoor position system using the grid-based laser scan matching with an improved probabilistically-motivated Maximum Likelihood Estimation (IMLE) algorithm. Their developed system applies a totally brute search matching method to find the rigid-body transformation between current scan and the likelihood grid map with refined search scope which is provided by the ICP algorithm. They also proposed a simple line-feature-based and three-level strategy of likelihood value determination to generate the likelihood map by combining the grid-point occupation method [22] and the contour-slope method [20]. However, we find that the above methods generate the likelihood map by only applying 1-D (1-Dimension) Gaussian blur along the contours or the points and then find the optimal transformation between current laser scan and the existing map via the brute search method or the gradient ascent method. These above methods haven’t considered the effect of dynamic objects existed in the indoor environments, so may be failed in the dynamic scenes.
In addition, most of SLAM methods assume that all the points in one scan are acquired simultaneously while most of the available rangefinders measure points by rotation sequentially. Hence, those methods may be failed under a fast motion due to that they ignore the scan distortion caused by the motion of robots. Bezet and Cherfaoui [4] proposed a method to correct the error produced by time stamping error in sensor data acquisition, and
obtain the data at the same time. Hong et al. [14] proposed a novel scan matching method called VICP which is a family of ICP algorithms. In this algorithm, they estimated and updated a velocity of a rangefinder numerically over ICP iterations. In this way, the distortion of a scan which comes from time differences during scanning is compensated by using the estimated velocity refined in each iteration. Zhang and Singh [26] modeled the LiDAR motion with constant angular and linear velocities during a sweep. They simply linearly interpolated the pose transform within a sweep for the points received at different times, and then solved the LiDAR motion with the Levenberg-Marquardt method [13].
In this paper, we propose a novel approach for SLAM in dynamic indoor scenes based on a 2D laser scanner mounted on a mobile UGV aided by the grid-based occupancy likelihood map. Firstly, we propose a new method to generate the occupancy likelihood map via applying a 2-D Gaussian blurring along the contours, which is more reasonable than only using a 1-D Gaussian blurring. Secondly, to compensate the scan distortion caused by the motion of the robot platform, we propose to integrate a velocity of a laser range finder (LRF) into the scan match-ing optimization framework. Thirdly, to ensure the accuracy and robustness of the recovered transformation, we propose to combine the brute search and gradient ascent to find the optimal solution. At last, to reduce the influence of dynamic objects existed in indoor environments as much as possible, we propose a new occupancy likelihood map learning strategy inspired by the background modeling algorithm [25]. The probability value of each grid will be increased or decreased after each scan matching. We tested our proposed SLAM approach in several challenged indoor environments, whose experimental results sufficiently demonstrate that our approach can generate the whole map without drift in most cases and localize the robot’s positions everywhere with a high accuracy.
2. OUR APPROACH
2.1 Algorithm Overview
Given two sequential laser range scansSt−1andStat timest−1 andt, the laser scan matching algorithm is used to find the rigid-body transformationTthat aligns the current laser scan with the previous one. However, if we apply this method for each pair of laser scans one by one, the pose drifting problem will appear due to that the matching error between two laser scans will be accumulated gradually and affect the accuracy of next matching.
In our work, rather than explicitly matching pairs of scansSt−1 and St, we match current scan St to a grid-based occupancy likelihood mapMt−1 generated by all previous scans. We use probabilistic scan-matching algorithms due to their robustness to large discontinuities in the range measurements. Each cell of the mapMt−1stores the likelihood value of the space region in 2D space measured by the laser points in all previous scans. Assum-ing that each point measurement in a laser scan is independent, according to Bayes’s rules, the sum likelihood of an entire scan can be computed as:
P(St|Mt−1) = X
x∈StP(x|
Mt−1) (1)
whereP(x|Mt−1)represents the probability of the pointx∈St at that location in the mapMt−1. The best rigid-body transfor-mationT∗can be found from all candidates by maximizing the likelihood of the laser scan according to:
T∗= argmax T
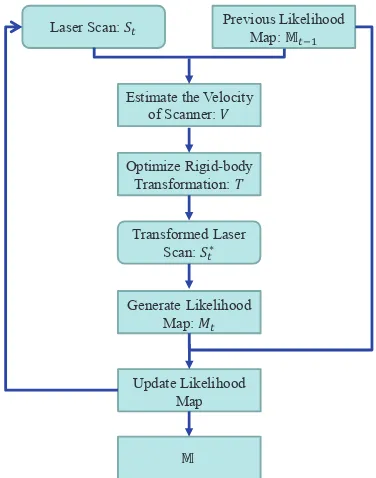
Previous Likelihood Map: ॸ௧ିଵ Laser Scan: ܵ௧
Estimate the Velocity of Scanner: ܸ
Optimize Rigid-body Transformation: ܶ
Transformed Laser Scan: ܵ௧כ
GenerateLikelihood Map: ܯ௧
Update Likelihood Map
ॸ
Figure 2: The flowchart of our proposed SLAM algorithm.
whereT⊗Stis the set of laser pointsSttransformed by the rigid body transformationT.
The key issues of a grid-based probabilistic scan-matching al-gorithm can be summarized as follow: the generation of the occupancy likelihood map from all previous maps, and an op-timization framework that allows us to find the optimal rigid-body transformation. In this paper, we propose a series of efficient techniques to solve those problems. Figure1shows the mobile UGV with a single laser scanner SICK LMS-100 used in this paper. The flowchart of our proposed SLAM algorithm is illustrated in Figure 2. Let St be the current laser scan at the time tand Mt−1 be the occupancy likelihood map at the previous timet−1, which is learned from all previous scans. Firstly, we estimate the rigid-body transformation T between the current scanSt with the previous mapMt−1by combining the brute search and the gradient ascent implemented by the Levenberg-Marquardt (LM) algorithm. At the same time, to reduce the influence of the scan distortion caused by the motion of the UGV, we integrate the velocity of the laser scanner into the LM optimization framework. Secondly, we transform St into the same coordinate system of Mt−1 based on the rigid-body transformation T, which is denoted as S∗
t = T ⊗St. The likelihood map Mt of S∗t can be generated by applying the 2-dimension Gaussian blurring operation along the contours connected by the points of the laser scan S∗
t. At last, we learn the new occupancy likelihood mapMtat the current time t via a novel strategy inspired by the background subtraction method proposed by Yao and Odobez [25]. All the above steps are repeated with the acquisition of laser scans and the final occupancy likelihood mapMcan be robustly achieved.
2.2 Likelihood Map Generation
The fundamental component of the grid-based scan matching algorithm is the occupancy likelihood map generated from all previous scans, which allows us to compute the occupancy likelihood of each point. One common approach for map generation is to first store all points from all previous scans. Then, for each pointxin the current scanSt, the distance to the closest pointx′is computed. Next, we apply the Gaussian probability
model to simulate the laser measurement noise. In this way, the occupancy likelihood of each point can be defined as:
P(x|Mt−1)∝exp (−d(x,x′)/σ), (3)
where d(x,x′) denotes the distance between x and x′, and
σ stands for the standard deviation of the sensor measurement noise.
However, this approach probably fails in some situations due to that it attempts to find correspondences for all points in the scans even though a number of points may not correspond to the current scan. As we know, the main structure of indoor environments is comprised of planar surfaces, which results in a set of piecewise linear line segments in a 2D laser scan. For the points in the current scan, we maybe can’t find the corresponding points in all previous scans, but have the bigger chance to locate on the same surfaces represented by contours. Therefore, for a point
xin the current scan, computing its occupancy likelihood with
the distanced(x,C)to the closest contourCextracted from all
previous scans is more reasonable, such as
P(x|Mt−1)∝exp (−d(x,C)/σ). (4)
In this contour-based approach, the grids crossed by the contours have the same and the biggest probability, and the occupancy likelihood values of the remaining grids are obtained by applying 1-D Gaussian blurring along the contours. An example of the last likelihood map is illustrated in Figure3(b). However, this approach assume that the grids crossed by the contours are all the robust features in this environment, and completely ignores the error of the contours. Sometimes, the error of contour connection maybe occurs, especially when the distance between two adjacent points become longer with increasing of the point distance to the center of the laser scanner. For example, we assume that there is an open door on the wall, and two adjacent wall points located in different sides of an open door are possibly connected into a same contour which represents the wall. In this way, the grids covered by this door region are regarded as robust features. Obviously, it is unreasonable. Thus, in some cases, the traditional contour-slope model maybe can’t accurately represent the scanned scenes.
In this paper, we propose a new improved contour-based ap-proach and combine the above-mentioned two common map generation approaches. Firstly, all contours from the laser scan need to be extracted. All distances{dk|dk=kxk−xk−1k}Kk=2 between all pairs of adjacent points are sorted in an ascending order, where K denotes the number of all points in the laser scan. A pair of adjacent points (xk−1,xk) is selected as the seed of an initial contour if it satisfies following constraints: dk is the smallest and smaller than the predefined distance threshold, andxk−1orxkis not jointed by other extracted contours. The adjacent points {xi}are iteratively joined until no more ones satisfy the following constraints:
di≤dth,
max(di, dj)
min(di, dj)
≤rth,
(5)
wheredidenotes the distance betweenxi−1andxi, i.e.,di =
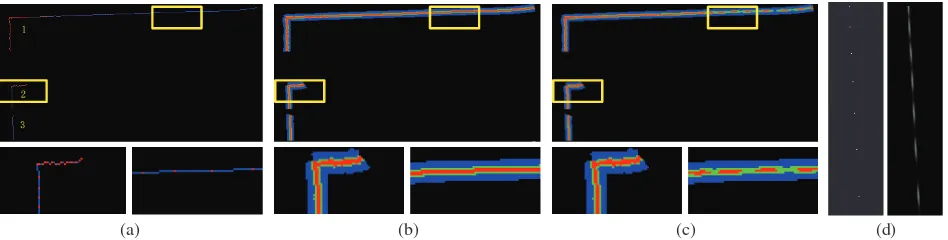
(a) (b) (c) (d) Figure 3: Illustrations of the contour extraction and the occupancy likelihood map generation: (a) three contours in blue extracted from the raw laser measurements alongside the raw laser readings in red dots; (b) the likelihood map generated from the contours by applying a 1-Dimension Gaussian blurring operation along the contour using the method presented in [20]; (c) the occupancy likelihood map generated by our proposed method; (d) a detailed view for our proposed method (Left: the original laser points in a contour; Right: the occupancy likelihood map by applying our propsed 2D Gaussian blurring operation).
Figure 4: An illustration of the normal estimation by RDPCA:(Left) the partial points of a laser scan; (Right) the corresponding orientations of the point normals marked in red lines, which were computed by RDPCA.
Compared with the traditional contour-based approach, we re-place the 1-D Gaussian blurring operation with the 2-D one. For each pair of points(xi,xj)in the same contour, we regard the direction of the line connecting xi and xj as thex-axis and they-axis is defined as the vertical direction of thex-axis. The likelihood of a pointxis computed as follow:
P(x|M)∝exp (−dx(x,C)/σx−dy(x,C)/σy), (6)
whereσxandσystand for two standard deviations in thex- and y-axes, respectively, which were set as1.5and10in this paper. dx(x,C)anddy(x,C)denote the distances to the contour along
thex- andy-axes, respectively, which are computed as follow:
(d
x(x,C) = min
xk∈C(dx(x,xk)),
dy(x,C) =d(x,C),
(7)
wheredx(x,xk)represents the distance fromxtoxkalong the direction of the x-axis. Figure 3(c) shows an example of the occupancy likelihood map created by this new approach. From Figure 3(a), we can find that this laser scan is comprised of three contours, which are numbered as1,2and3, respectively. The distance between two adjacent points becomes bigger as the extension of contours, especially for the longest contour numbered as1. Compared with the occupancy likelihood map shown in Figure3(b), we can find that the occupancy likelihood value of each grid crossed by the contour is not always the same and the biggest as shown in Figure 3(c), which is also determined by the distance to the closest point along thex-axis, especially in the local regions marked by the upper-right box. But if the distance between two points is small, the likelihood map is similar for two methods, as shown in the local region marked by the lower-left box. Our proposed 2D Gaussian blurring results are more easily observed in a detailed view of partial contour as shown in Figure3(d).
2.3 Scan-to-Map Matching
Scan matching is the process of aligning laser scans with each other or with an existing occupancy likelihood map. Our ap-proach aligns the new laser scan to the likelihood map learned from all previous scans as described in Section2.4. Given the previous occupancy likelihood mapMt−1 and the current laser scanSt, the scan-to-map matching aims to find the optimal rigid-body transformationT∗betweenStandMt−1by minimizing the following energy function:
E(St,Mt−1) = X
x∈Stw(x)(1−P(T⊗x| Mt−1))
2 , (8)
wherexstands for one point in the scanSt, the operationT⊗x
means that the pointxis transformed byT, andP(T⊗x|Mt−1) denotes the occupancy likelihood value of the transformed posi-tion inMt−1. We know that the robustness of the recovered rigid-body transformation depends on at least two non-planar surfaces. To efficiently balance the contribution of surfaces with different orientations, we propose to set different weights for different points. The weightw(x)of the pointxis used to balance the
influence of each point in the optimization framework, which is computed as follows. We first compute the normal n = (nx, ny)⊤ of each point x via the Robust Diagnostic PCA
(RDPCA) algorithm [17], as shown in Figure4, and then compute the histogram of normal orientations Hcomprised of B bins whereB = 12used in this paper. In indoor scenes, there often exists one or several main planar surfaces in a laser scan due to the limited viewpoint and measurement distance. The points in each bin have the same weightwbdefined by the following Sigmoid function:
wb=
1
Hb
× 1
1 + exp ((100− Hb)/50)
, (9)
whereHbstands for the frequency of theb-the bin inH.
we find the initial rough estimated transformation via the brute search method with narrow search windows(wθ, wx, wy), and large search steps(sθ, sx, sy)in the three parameters of a rigid-body transformation, i.e., a rotation angleθ, two translationstx andtyin thex- andy-axes.
However, in the above mentioned scan-to-map matching ap-proach, the laser scan distortion caused by the motion of the UGV has been ignored, so this approach is prone to be erroneous under a fast motion. This problem can be solved by compensating the scan distortion of the laser scan as VICP [14] does. In the VICP algorithm, it first estimates the velocity of the rangefinder and corrects the scan distortion at the same time, and then applies the ICP algorithm to finish the process of scan matching. In our approach, we integrate the estimated velocity into the LM optimization framework instead of the ICP algorithm.
In order to compensate the scan distortion, the velocity of the rangefinger has to be estimated. LetTt andTt−1 be the rigid-body transformation of the laser scanStandSt−1with respective to the map M. So the relation between St and St−1 can be andSt, respectively, andKis the number of points in one laser scan. We assume that the velocity is constant during the scan time
∆t. According to the method presented in VICP, we approximate Vt, i.e., the velocity of the rangefiner at the timet, as:
Vt=
1 ∆tlogT
−1
t−1Tt. (11)
Then we use the estimated velocity to compensate the points in Stone by one as follows: representing the elapsed time between two adjacent points.
According to Eq. (12), we can transform all points in St into the time when the first point ofStis scanned. The compensated points are used to optimize the energy function presented in Eq. (8) in the LM optimization framework. After each iteration of the LM algorithm, we re-estimate the velocityVtand re-calculate the compensated points {ˆxtk}Kk=1 before the next iteration be-ginning based on the current transformation Tt. In this way, bothVtandTtare iteratively refined simultaneously by using the previous estimated results as the initial estimation for the next iteration in the LM optimization framework. The procedures of our proposed scan matching and compensation algorithm is summarized in Algorithm1, whereSˆtdenotes the compensated scan,Imaxis the maximal iteration number of the LM algorithm, and LM( ˆSt,Mt−1,Tt)denotes one optimization iteration in the LM algorithm.
2.4 Likelihood Map Learning
Given the current laser scanStand the transformationTtobtained by the scan-to-map matching algorithm, the occupancy likelihood mapMt−1need to be updated before the use of aligning the next laser scan, and the newly updated map is defined asMt. Gener-ally, we need to regenerate the occupancy likelihood map based on the stored points or contours. However, this method needs to operate the process of the likelihood map generation before each laser scan matching and also needs large memory to store the points or contours and high computation. In addition, the
Algorithm 1Scan Matching and Compensation
Require: St: the laser scan at the timet;Tt−1,Vt−1: the rigid-body transformation and the velocity of the previous laser scanSt−1;Mt−1: the occupancy likelihood map learned at the timet−1.
Ensure: Tt,Vt: the rigid-body transformation and the velocity of the current scanSt.
1: Vt=Vt−1,Tt=e ∆tVt−1
Tt−1,i= 0
2: Brute Searching: Find the initial rough estimated transformationT′tfrom the search windows
3: Tt=T′t
biggest disadvantage of this method is that it hasn’t considered the influence of dynamic objects in indoor environments. In this paper, we propose a new strategy inspired by the background subtraction method [25] to update the occupancy likelihood map. Background subtraction is an effective technique to detect the foreground objects from a video stream captured from a stationary camera. The basic component of the background subtraction method is the background model learned from all previous image frames. The background model needs to be updated while new image frame comes. The similar strategy used in background subtraction can be applied in the updating and learning process of the occupancy likelihood map.
While at the first scanning timet= 1, the occupancy likelihood mapMtis directly set as the likelihood map ofSt, i.e.,Mt=Mt. In the sequential laser scans, the new occupancy likelihood map is updated as follows. We first align the laser scanSt into the coordinate system of Mt−1, and then generate the likelihood map Mt of St via the approach presented in Section 2.2. For some grid, we need to store three components, i.e., M(g) =
{Mp(g),Mpˆ(g),Mn(g)}, whereMp(g)∈[0,1]andMpˆ(g)∈ [0,1]stand for the current occupancy likelihood value and the maximal one that the gridgis achieved in the past, respectively,
andMn(g)denotes the times of this grid that has been observed
in all previous laser scans. The likelihood value of each grid will be updated with one of the following four ways:
• No updating: If both the likelihood valuesMp
t−1(g)and
Mpt(g)in mapsMt−1 andMtare zero, i.e., Mp
t−1(g) = 0 andMpt(g) = 0, no updating occurs at this gridgdue to that it is pointless.
• Increasing likelihood: If there exists at least one point located inginM, i.e.,Mpt(g)>0andM wherewuis the likelihood increasing rate calculated as:
wu=wl(1 +τM ˆ p
• Decreasing likelihood: If there exists no point inginMt, i.e.,Mpt(g) = 0, we decrease the likelihood valueM
p t(g)just while there exist no enough points ingin previous scans,
i.e.,Mn
t−1≤nth, as follows:
Mpt(g) = (1−wd)Mpt−1(g), (15)
wherewdis the decreasing rate defined as follow:
wd=
wl
1 +τMptˆ−1(g)
. (16)
• Likelihood interpolation:The remaining grids are updated by interpolating the values fromGuandGdstanding for the grids increased and decreased, respectively. Given a gridg
to be updated, we compute the increased and the decreased likelihood valuespuandpdas follows:
andgk, andσldenotes the standard deviation of the used Gaussian interpolation function, which was set asσl= 1.5 in this paper. We setp = puif|pu| > |pd|, otherwise,
According to the above updating strategy, if one grid inMt−1 is occupied by the points of a dynamic object, the likelihood of this gird will be decreased gradually during map updating. In contrast, the likelihood will be increased. In this way, the likelihood values of dynamic objects become smaller but those of static objects become bigger in the last mapM.
2.5 Multi-Resolution Map Representation
Until now, we have presented a complete grid-based probabilistic scan-matching algorithm in a certain resolution. Although we find a rough estimated transformation for the LM optimization algorithm via brute searching. But it also has risk of getting stuck in local minimum. To alleviate this problem as far as possible, we also apply a multi-resolution map representation similar to the pyramid approaches used in computer vision. The resolution of each fine grid-map is double of the preceding coarse one. Our proposed scan-to-map matching algorithm starts at the coarsest map level whose resulting estimated rigid-body transformation and velocity are used as the initial estimations for the next level until the bottom one. To update the likelihood map for each level via the strategy presented in Section2.4, we must first know the accurate rigid-body transformation in each level and compute them by transferring the transformation estimated in the bottom level to other based on their resolutions. The updated likelihood maps in all levels are used as the reference maps for the next incoming scan.
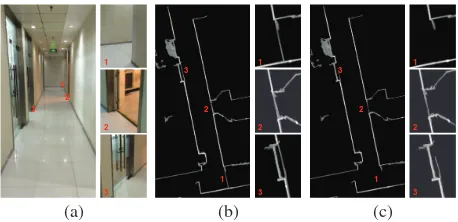
Figure 5: Comparative results of the traditional and our proposed contour-based likelihood generation approaches: (a) an indoor corridor scene with several sunk doors; (b) the last likelihood map generated by the traditional contour-slope model; (c) the last likelihood map generated by our proposed method. Brighter intensities indicate higher likelihood values.
3. EXPERIMENTAL RESULTS
To illustrate that our proposed algorithm is effective, we conduct-ed the experiments in several indoor environments. The experi-mental data were all collected by the UGV platform presented in Figure1, whose moving velocity is about1.2m/s. The used laser scanner is SICK LMS-100 with a scanning range[0.5m,20m], a scanning angle of270◦
, a resolution of0.5◦
, and an acquisition frequency of50Hz. In total, there are 540 points in each laser scan.
Figure5shows the comparative results of the occupancy likeli-hood maps generated by the traditional contour-slope model and our proposed method in a representative indoor scene, an office corridor with several sunk doors. In this test scene, there are several sunk doors on both sides of the corridor and a turning corner in the end of the corridor, as shown in Figure5(a). The traditional contour-slope model can’t generate a very reasonable likelihood map representing this scene accurately mainly because that there possibly exist non-occupied regions, e.g., suck doors and the turning corner, inside the connected contours as whole walls. Therefore, in Figure5(b), due to the errors of the contours, we found that the grids in the regions of the sunk doors and the turning corner are also connected in the occupancy likelihood map generated by the traditional contour-slope model, especially in the turning corner marked by the red number1. However, in the occupancy likelihood generated by our proposed method, this problem is alleviated greatly with the same connection results of contours, as shown in Figure5(c). This comparative experiment proves that our proposed method is more reasonable than the traditional contour-slop model due to much less connection errors in contours.
(a) (b)
Figure 6: The occupancy likelihood maps of a narrow and closed-loop indoor office corridor with a length of about100m associated with the moving trajectories (marked in red lines) of the UGV generated by considering the scan distortion compensation in (a) and without it in (b).
(a) (b) (c)
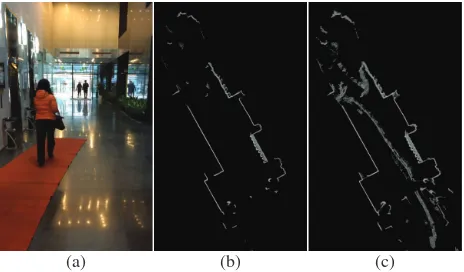
Figure 7: Comparative results of different likelihood updating strategies in an indoor office corridor with a walking pedestrian: (a) a scene photo; (b)-(c) the last likelihood maps with our proposed learning strategy with decreasing and without it, respectively. Brighter intensities indicate higher likelihood values.
compensation is very necessary.
To illustrate that our algorithm can deal with the dynamic scene more efficiently, we first tested our algorithm in an indoor office corridor, as shown in Figure 7(a). The main objects in this scene are comprised of a walking pedestrian, three elevators, two plants and the corridor walls. With our proposed occupancy likelihood map learning strategy, only static structures of this scene are visible in the finally learned occupancy likelihood map while the dynamic objects almost disappear with extremely low likelihood values, as shown in Figure7(b). If we don’t consider the deceasing strategy in the occupancy likelihood map learning process, the dynamic objects are also obviously visible in the finally learned map, as shown in Figure7(c). Except that the main dynamic object, a walking pedestrian marked in the red box shown in Figure 7(c), disappeared in Figure 7(b), other disturbed grids marked in the yellow boxes in Figure7(c) caused by laser data noise also disappeared in Figure7(b). Furthermore, we tested our learning strategy in another indoor scene with multiple dynamic objects, walking pedestrians, as shown in Figure8, from which the same conclusions can be drawn. These two comparative experiments sufficiently demonstrate that our proposed occupancy likelihood map learning strategy is much robust to dynamic objects and data noises. With such much better occupancy likelihood map, the localization would be improved to some extent.
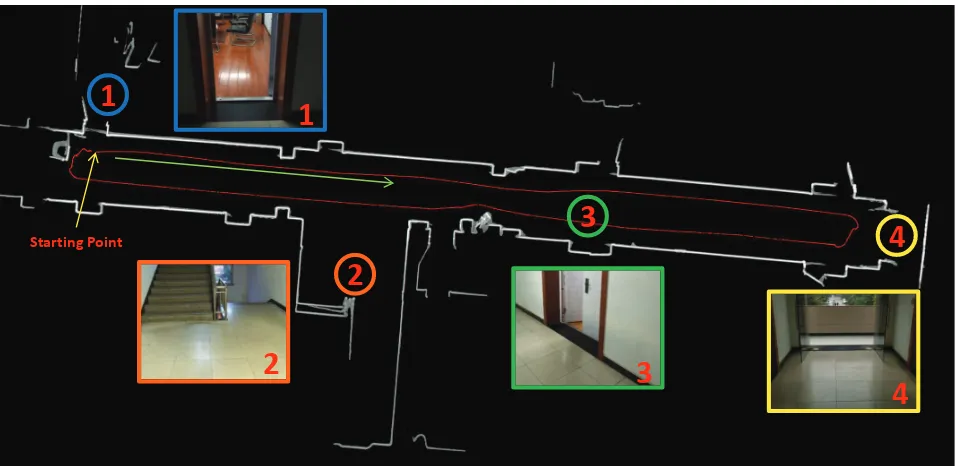
Finally, we tested our SLAM algorithm in another narrow long indoor corridor with a length of about100m. The last occupancy likelihood map and the complete moving trajectory of the mobile UGV platform generated by our proposed SLAM algorithm are illustrated in Figure9. The mobile UGV for data acquisition
(a) (b) (c)
Figure 8: Comparative results of different likelihood updating strategies in an office lobby with multiple walking pedestrians: (a) a scene photo; (b)-(c) the last likelihood maps with our proposed learning strategy with decreasing and without it, respectively. Brighter intensities indicate higher likelihood values.
started at one end of the corridor, moved to another end along the corridor, and finally come back near the starting location. From the moving trajectory shown in Figure9, we observed that there no exists the drifting error in our SLAM results for this challenged scene.
4. CONCLUSION
Based on the data collected by a 2D laser scanner mounted on a UGV platform, a new indoor SLAM algorithm via the laser scan matching aided by the grid-based occupancy likelihood map was proposed in this paper. Instead of computing the occupancy likelihood value of each grid based on the point-to-point distance or point-to-point-to-contour one, we combined those two measurements by applying a 2-D Gaussian blurring operation along the contours. In the scan-to-map matching process, to reduce the influence of scan distortion caused by the motion of the laser scanner, we estimated its velocity, and all points can be transformed by compensating the distortion via the estimated velocity as if they were measured at the same time, all of these ideas are integrated into the LM optimization framework to find the optimal rigid-body transformation. Besides, to ensure the accuracy and robustness of the laser scan matching, we estimated a rough initial transformation via brute search for the LM opti-mization and implemented the whole optiopti-mization framework in multiple resolutions. At last, inspired by background subtraction, we creatively proposed a novel strategy to update the occupancy likelihood map to greatly reduce the affect of dynamic objects often existed in most indoor scenes and data noises caused by the laser scanner itself. Experimental results on several data sets acquired from typical indoor environments demonstrate that our proposed SLAM algorithm can provide high-precision positioning and mapping results in most cases.
ACKNOWLEDGMENT
2
2
4
4
3
3
1
1
Starting Point
Figure 9: The occupancy likelihood map with a recovered moving trajectory (marked in red line) generated by our proposed SLAM algorithm in a narrow and long corridor with a length of about100m.
REFERENCES
Bachrach, A., He, R. and Roy, N., 2009. Autonomous flight in unknown indoor environments.International Journal of Micro Air Vehicles1(4), pp. 217–228.
Bachrach, A., Prentice, S., He, R. and Roy, N., 2011. RANGE–robust autonomous navigation in GPS-denied environments. Journal of Field Robotics28(5), pp. 644–666.
Besl, P. J. and McKay, N. D., 1992. Method for registration of 3-D shapes. In:Robotics-DL tentative.
Bezet, O. and Cherfaoui, V., 2006. Time error correction for laser range scanner data. In:International Conference on Information Fusion. Biber, P. and Straßer, W., 2003. The normal distributions transform: A new approach to laser scan matching. In: IEEE/RSJ International Conference on Intelligent Robots and Systems (IROS).
Bourmaud, G. and M´egret, R., 2015. Robust large scale monocular visual SLAM. In:IEEE Conference on Computer Vision and Pattern Recognition (CVPR).
Censi, A., 2008. An ICP variant using a point-to-line metric. In:IEEE International Conference on Robotics and Automation (ICRA). Choi, S., Zhou, Q.-Y. and Koltun, V., 2015. Robust reconstruction of indoor scenes. In:IEEE Conference on Computer Vision and Pattern Recognition (CVPR).
Diosi, A. and Kleeman, L., 2005. Laser scan matching in polar coordinates with application to SLAM. In: IEEE/RSJ International Conference on Intelligent Robots and Systems(IROS).
Endres, F., Hess, J., Sturm, J., Cremers, D. and Burgard, W., 2014. 3-D mapping with an RGB-3-D camera. IEEE Transactions on Robotics
30(1), pp. 177–187.
Engel, J., Sch¨ops, T. and Cremers, D., 2014. LSD-SLAM: Large-scale direct monocular SLAM. In:European Conference on Computer Vision (ECCV), Springer.
Grisetti, G., Stachniss, C. and Burgard, W., 2007. Improved techniques for grid mapping with rao-blackwellized particle filters.
IEEE Transactions on Robotics23(1), pp. 34–46.
Hartley, R. and Zisserman, A., 2003. Multiple view geometry in computer vision. Cambridge university press.
Hong, S., Ko, H. and Kim, J., 2010. VICP: Velocity updating iterative closest point algorithm. In:IEEE International Conference on Robotics and Automation (ICRA).
Kohlbrecher, S., Von Stryk, O., Meyer, J. and Klingauf, U., 2011. A flexible and scalable SLAM system with full 3D motion estimation. In:
IEEE International Symposium on Safety, Security, and Rescue Robotics (SSRR).
Lemaire, T., Berger, C., Jung, I.-K. and Lacroix, S., 2007. Vision-based SLAM: Stereo and monocular approaches. International Journal of Computer Vision74(3), pp. 343–364.
Nurunnabi, A., West, G. and Belton, D., 2015. Outlier detection and robust normal-curvature estimation in mobile laser scanning 3D point cloud data.Pattern Recognition48(4), pp. 1404–1419.
Oh, T., Lee, D., Kim, H. and Myung, H., 2015. Graph structure-based simultaneous localization and mapping using a hybrid method of 2D laser scan and monocular camera image in environments with laser scan ambiguity.Sensors15(7), pp. 15830–15852.
Olson, E. B., 2009. Real-time correlative scan matching. In: IEEE International Conference on Robotics and Automation (ICRA). Olson, E. B., Teller, S. and Leonard, J., 2008. Robust and efficient robotic mapping. PhD thesis, Massachusetts Institute of Technology, Department of Electrical Engineering and Computer Science. Rapp, M., Barjenbruch, M., Hahn, M., Dickmann, J. and Dietmayer, K., 2015. Clustering improved grid map registration using the normal distribution transform. In:IEEE Intelligent Vehicles Symposium (IV). Steux, B. and Hamzaoui, O. E., 2010. tinySLAM: A SLAM algorithm in less than 200 lines c-language program. In:International Conference on Control Automation Robotics & Vision (ICARCV).
Tang, J., Chen, Y., Jaakkola, A., Liu, J., Hyypp¨a, J. and Hyypp¨a, H., 2014. NAVIS–an UGV indoor positioning system using laser scan matching for large-area real-time applications. Sensors14(7), pp. 11805–11824.
Tang, J., Chen, Y., Niu, X., Wang, L., Chen, L., Liu, J., Shi, C. and Hyypp¨a, J., 2015. LiDAR scan matching aided inertial navigation system in GNSS-denied environments. Sensors 15(7), pp. 16710– 16728.
Yao, J. and Odobez, J.-M., 2007. Multi-layer background subtraction based on color and texture. In:IEEE Conference on Computer Vision and Pattern Recognition (CVPR).
Zhang, J. and Singh, S., 2014. LOAM: LiDAR odometry and mapping in real-time. In:Robotics: Science and Systems Conference (RSS). Zlot, R. and Bosse, M., 2014. Efficient large-scale three-dimensional mobile mapping for underground mines. Journal of Field Robotics