EXPLOITATION OF STEREOPHOTOGRAMMETRIC MEASUREMENT OF A FOOT
IN ANALYSIS OF PLANTAR PRESSURE DISTRIBUTION
B. Pankova a,*, T. Koudelka b, K. Pavelka c, M. Janura d , K. Jelen a
a Charles University in Prague, Faculty of Physical Education and Sport, Dept. of Anatomy and Biomechanics, José Martího 31,
Prague 6, 602 52 Czech Rep. * [email protected] b
Czech Technical University in Prague, Faculty of Civil Engineering, Dept. of Mechanics, Thákurova 7, Prague 6, 166 29Czech R. c
Czech Technical University in Prague, Faculty of Civil Engineering, Dept. of Geomatics, Thákurova 7, Prague 6, 166 29 Czech R. d
Palacký University Olomouc, Faculty of Physical Culture, Dept. of of Natural Sciences in Kinantropology, Třída Míru 117, 771 11 Olomouc
Commission V, TeS V/5
KEY WORDS: Stereophotogrammetry, Digital model, 3D analysis, Biomechanics, Foot, Stress distribution
ABSTRACT:
Stereophotogrammetry as a method for the surface scanning can be used to capture some properties of the human body parts. The objective of this study is to quantify the foot stress distribution in 3D during its quasi-static stand using a footprint into an imprinting material when knowing its mechanical properties. One foot of a female, having the mass of 65kg, was chosen for the FEM foot model construction. After obtaining her foot imprint to the dental imprinting material, its positive plaster cast was created, whose surface was possible to scan using stereophotogrammetry. The imprint surface digital model was prepared with the help of the Konica-Minolta Vivid 9i triangulation scanner. This procedure provides the measured object models in a high resolution. The resulting surface mesh of the foot imprint involved 9.600 nodes and 14.000 triangles, approximately, after reduction due to the FEM analysis. Simulation of foot imprint was solved as the 3D time dependent nonlinear mechanical problem in the ADINA software. The sum of vertical reactions calculated at the contact area nodes was 320.5 N, which corresponds to the mass of 32.67 kg. This value is in a good agreement with the subject half weight – the load of one foot during its quasi-static stand. The partial pressures resulting from this mathematical model match the real pressures on the interface of the foot and imprinting material quite closely. Principally, these simulations can be used to assess the contact pressures in practical cases, e.g., between a foot and its footwear.
1. INTRODUCTION
Topographical scanning of the surface, which is nowadays very actual, is also used to view the surface of the human body various parts (Urbanová, 2015). In the case of the foot area, however, not only the unloaded condition, but, in particular, the moment of the foot weight bearing is interesting, when the pressure distribution across the whole foot surface in 3D is not completely known. Although the research of the biomechanics of the foot is widely developed, it still offers further improvements and refinements of this structure capturing, particularly in the field of mathematical models.
In recent studies, the plaster cast from the foot imprint was created, which was possible to scan using stereophotogrammetry. The foot 3D mathematical model was then created with help of the FEM computer simulation to capture the partial pressures on the interface of the foot and imprinting material and its surroundings, respectively. In recent literatures, many other theoretical models, such as kinematic models (Scott, 1993), mathematical models (Jelen, 2005; Tětková, 2009), and finite element models (Halloran, 2009; Cheung, 2005a; Cheung, 2005b) of the foot had been developed. The two most common approaches, as the result of the simulations, are the finite element method and multi-body method (Fanta, 2013). Finite element method has been used increasingly in many biomechanical investigations with great success due to its capability of modelling structures with irregular geometry and complex material properties, and the ease of simulating complicated boundary and loading conditions in both static and dynamic analyses. Therefore, it has become a
suitable method for the investigation of foot stress distributions. (Chen, 2001)
The use of anatomically accurate finite element (FEM) models of the human foot in research studies has increased rapidly in recent years. Some studies creates a 3D mathematical model using the reconstruction of the foot by MRI or CT (Cheung, 2005a; Cheung, 2005b; Camacho, 2002; Chen, 2001), or the foot scanning (Lochner, 2014; Telfer, 2010). Both methods (from MRI and CT) for developing patient-specific anatomical geometry are time consuming, expensive and impractical for use on a per-patient basis.
The study of Camacho uses CT scans to make the foot FEM model. However, it has had several limitations. One important consideration has been the small amount of load applied to the cadaver foot, while being scanned (Camacho, 2002).
Most of the linearly elastic FEM models reported used a relatively large value of soft tissue stiffness in their analysis (Chen, 2001). These values overestimated the actual plantar soft tissue stiffness, and reduced the adapting ability of the plantar soft tissue to the supporting surface. This will lead to inaccuracy in predicting the plantar pressure and contact area especially when a geometrical accurate plantar foot contour was defined (Cheung, 2005a).
To simplify the analysis in the study of Cheung et al., homogeneous and linearly elastic material properties were assigned to the bony and ligamentous structures and the ligaments within the toes and other connective tissue, such as the joint capsules, were not considered. The FEM model developed can be refined to simulate more realistically the actual situations by incorporating nonlinear and viscoleastic material properties for the ligamentous and soft tissue ISPRS Annals of the Photogrammetry, Remote Sensing and Spatial Information Sciences, Volume III-5, 2016
structures. The use of the surface contact simulation enables a direct comparison of the plantar pressure and contact area to the experimental measurement, especially for the comparison between highly contoured surfaces (Cheung, 2005a).
Besides the mathematical simulation, many experimental techniques were developed and employed for the quantification of foot biomechanics, such as the gait analysis (Curtis, 2009; Stebbins, 2006), the pressure sensing platforms (Mickle, 2011), the in-shoe pressure transducers (Woodburn, 1996), the cadaveric experiments (Nester, 2007b) and the in-vivo force measurements (Arndt, 2007; Lundgren, 2008; Nester, 2007a). Despite the ongoing controversy about the reliability, validity and variation in the measurement techniques of the foot (Cobey, 1981), the footprint-based parameters are systematically used to assess the configuration of the arch (Nikolaidou, 2006; Onodera, 2008; Rose, 1985; Volpon, 1994; Engel, 1974; Hawes, 1992; Kanatli, 2001; Kernozek, 1990; Wearing, 2004). Most common indexes are Cavanagh and Rodgers Arch Index (AI) (Cavanagh, 1987), Chipaux-Smirak Index (CSI) (Chippaux, 1947; Smirak, 1960; Forriol, 1990; Villaroya, 2009), Footprint Angle (FPA) (Clarke, 1993), (Villaroya, 2009) a Staheli Index (SI) (Staheli, 1987).
The above-mentioned measurement techniques are commonly used in predicting the joint kinetics and quantifying the plantar pressure distributions. Methods using the 2D footprint of the foot have an advantage in a simple application and calculation. According to some sources they show a good repeatability (Nikolaidou, 2006) and inter- and intra-observer reliability (Queen, 2007). However, the bones, the soft tissue, and the associated joint stresses inside the foot were less investigated and remained unclear. It is very difficult to quantify the in-vivo bone and soft tissue stress with the existing experimental techniques. As for in vitro studies, the loading conditions were often different from the actual physiological loading situation as the foot structure was compromised. Therefore, no overall stress distributions of the whole foot is known using the currently available measuring techniques (Chen, 2001).
Footprints that watch only the foot-ground contact may not reflect the position of the higher structures that the method cannot capture. Moreover, by these methods it is not possible to capture the contact forces between the foot and its surroundings over its entire contact surface. move nearer to an advanced material model, which involves in itself both the effect of plastic deformation and then creep obtained in the previous work. Also such instruments were prepared that enabled the transition from a single-layer model to a full 3D modelling of the footprint including its surroundings. The calculation is considering the effects of large deformation and large displacement. taken by means of sinking both feet in the Phase Plus Chromatic plastic substance, while being in the resting stance. This substance is used in stomatology and orthodontics to teeth imprinting for fabrication of dental equipment, ordinarily. We used this material because of its well known, exactly defined, repeatable process for preparing. The dimensions of two bounding boxes with the mass were 28x20x7cm, where the depth of the imprinting mass was 27mm. The female subject was asked to lean with both hands, slowly and gradually integrate her both feet each into one box with the material until the full load. After 60 seconds, when the process of plunging had been finally stopped, she was asked to leave the box with the mass again in the same manner. From this imprint, the positive plaster cast was created, whose surface was possible to scan using stereophotogrammetry.
2.3 Stereophotogrammetric measurements of plaster cast
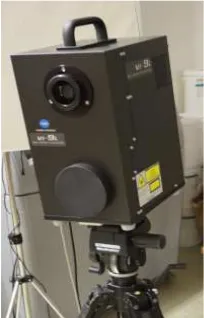
The measurement of the settlement of individual points on the foot surface has been carried out by the stereophotogrammetric method performed in the laboratory of the Department of Geomatics. The digital model of the imprint surface was prepared with the help of triangulation scanner Konica-Minolta Vivid 9i. This device contains a red strip laser which displays a moving trace on the scanned object that is being tracked by the digital camera. The laser and camera are located one above the other in the exactly known distance. The individual points of the laser trace (the trace shape), are measured in the picture coordinates automatically and their positions are computed with the help of triangulation method.
This procedure provides model of the measured object in a high resolution (the hundreds of thousands of points for the object size about 30 cm).
Figure 1. Triangulation scanner Konica-Minolta Vivid 9i
In this case, the plaster cast was scanned from the several directions due to the incorporation of shielded parts of the object. The scanner was placed on a fixed tripod, while the object was rotated in order to attain the complete model. Particular scanned images were transformed into the global coordinate system in the software Polygon Editing Tools. This software was also exploited for the preparation of triangular irregular network (TIN), which represents the surface of the scanned object on the basis of measured 3D points of the object. ISPRS Annals of the Photogrammetry, Remote Sensing and Spatial Information Sciences, Volume III-5, 2016
Figure 2. The digital model of the imprint
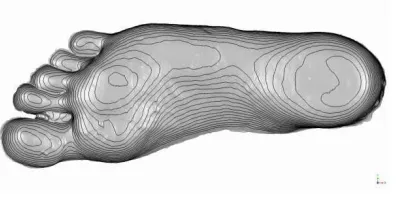
The scanned object was relatively small and therefore the average distance among nodes was 0.2 mm. The resulting mesh was smoothed due to the noise reduction in the measurement and it was also cut on the foot boundary. Generally, the model precision is not influenced by the smoothing because the plaster material of the imprint has good emissivity and therefore it is suitable for the measurements. The contour lines, with the raise of 1 mm, were also created from the 3D points measured and they are depicted in Figure 3.
Figure 3. Contour lines of the imprint
The resulting model was exported in the standard STL format for the further processing. The number of points in the high resolution was quite huge for the capabilities of the standard FE computational software and therefore the model was reduced with new average node distance about 3 mm. Resulting surface mesh of the foot imprint involved 9.600 of nodes and 14.000 triangles approximately.
2.4 Numerical simulation of foot imprint
The simulation of the foot imprint with the help of Finite Element Method (FEM) starts from the original undeformed state of the imprint mass specimen whose form was given by the bounding box used. The load with the foot had been applied by the gradually increasing displacements prescribed in the contact area, until the final imprint shape was attained. The foot contact area had been planar at the beginning of simulation and therefore the mesh, provided by the stereophotogrammetric measurement, could not be used directly for the FEM analysis. The FEM method has also different requirements on the property of particular triangle/tetrahedron elements. For these reasons, only the 2D shape of foot contour was extracted from the mesh measured and used as the input to the T3D generator (Rypl, 2004) of 3D finite element (FE) mesh. Resulting FE mesh involved 21.000 nodes and 108.000 tetrahedron elements (see Figure 4).
Figure 4. FE mesh of the initial state of imprint mass
Extraction of prescribed values of vertical displacements from the measured values was another task in the FEM input data preparation process. The nodes on the mesh measured were projected onto the XY plane and the nodes in the contact area of FE mesh were also projected onto XY plane. For the each contact area node of FE mesh, the corresponding triangular element of the mesh measured was searched, which the given FE node lied in. The resulting z-coordinate on the measured surface of the FE node was then calculated by the linear interpolation of nodal z-coordinates defining the given element on the surface measured. Modelling of three middle fingers (II., III. and IV.) was omitted because of too complex geometry which resulted in very high demands on computer memory in ADINA software.
2.5 Mechanical properties of the imprint material
The mechanical properties of the imprint material were studied in laboratory experiment where the rigid cylinder with the given weight was put on the surface of the mass specimen and its vertical displacement was measured in the regular time intervals. The resulting diagrams of the settlement creep curves are depicted in Figure 5.
Figure 5. Creep curves (time vs. settlement) of the imprint mass
It can be observed from these experiments that the behaviour of the imprint material is nonlinear and time dependent. In the ADINA software, the nonlinear time dependent behaviour can be simulated with a plastic-creep material, where the J2 yield criterion is defined as
, , (1)
where is the second invariant of stress deviator, is the yield stress function and q is the hardening parameter. This yield function is used together with the following definition of creep strains
¯ ¯ , (2)
where , and are parameters defining the shape of creep curve, is the effective stress (scaled the second invariant of stress deviator) and t is the time. The resulting creep curves from the measurements were used for the fitting of the material model parameters in the ADINA simulation of the experiment. Figure 6 depicts the distribution of shear stresses in the final stage of the simulated experiment on the half of 2D section.
Figure 6. Creep experiment simulation – shear stress distribution [Pa]
2.6 Numerical analysis of the pressure distribution
The foot imprint simulation in the dental imprint mass was solved as 3D time dependent nonlinear mechanical problem in the ADINA software. The simulation started from the undeformed state of prismatic specimen. The nodes on the specimen bottom surface and its sides were fixed during the whole simulation while the nodes on the top surface, out of the contact area, were free. The nodes in the contact area were subjected to the foot load generated as the vertical prescribed displacements that were increased gradually in the course of time. These nodal prescribed displacements were proportional to the z-coordinate obtained from the stereophotogrammetric measurement. Resulting distribution of vertical stress component is depicted in Figure 7a, while the deformed shape of FE mesh can be seen in Figure 7b.
(a)
(b)
Figure 7. Distribution of the vertical stress component on the top surface [Pa] (a), the mesh deformed [N] (b)
3. CONCLUSIONS
The deformed shape from the ADINA simulation matches the measured values almost exactly because these values were prescribed directly from the measurement. A minor error can be caused because of the linear approximation of the z-coordinate due to the transfer of the values from the measured mesh to the FEM mesh. Another error stems from the fact that three middle toes were not modelled because of too complex geometry, which resulted in an excessive demands on the computer memory. On the other hand, the pressure values between the middle fingers and the imprint material are not too high in the steady stand and they do not play a significant role in the total pressure balance. Thus the validation of the foot imprint model had to be performed with the help of knowledge of the total mass of the female subject, which was 65 kg. In this case, the sum of vertical reactions calculated at the nodes in the contact area was 320.5 N, which corresponds to 32.67 kg. This value is in a good agreement with the female subject half weight – the load of one foot during the quasi-static stand. For these reasons, we can state that the partial pressures resulting from this mathematical model match the real pressures on the interface of the foot and imprinting material and its surroundings, respectively, quite closely. Principally, these simulations can be used to determine the contact pressures in practical cases, e.g., ISPRS Annals of the Photogrammetry, Remote Sensing and Spatial Information Sciences, Volume III-5, 2016
between the foot and its footwear. There are expected further methodological steps with the possibility to be used, e.g., in the design of footwear construction.
ACKNOWLEDGEMENTS
GACR P407/10/1624, PRVOUK 038, SVV 2016 - 260346
REFERENCES
Arndt, A., Wolf, P., Liu, A., Nester, C., Stacoff, A., Jones, R., Lundberg, A., 2007. Intrinsic foot kinematics measured in vivo during the stance phase of slow running. J Biomech, 40(12), pp. 2672-2678.
Camacho, D. L. A., Ledoux, W.R., Rohr, E.S., Sangeorzan, B.J., Ching, R.P., 2002. A three-dimensional, anatomically detailed foot model: A foundation for a finite element simulation and means of quantifying foot-bone position. Journal of Rehabilitation Research and Development, 39(3), pp. 401-410.
Cavanagh, P. R., Rodgers, M. M., 1987. The arch index: a useful measure from footprints. J Biomech, 20, pp. 547-551.
Clarke, H. H., 1993. An objective method of measuring the height of the longitudinal arch in foot examinations. Res Quart, 4, pp. 99-107. gait. Gait Posture, 30(1), pp. 118-121.
Engel, G. M., Staheli, L. T., 1974. The natural history of torsion and other factors influencing gait in childhood. Clin Orthop Relat Res, 99, pp. 12-17.
Fanta, O., Hadraba, D., Lopot, F., Kubovy, P., Boucek, J., Jelen, K., 2013. Pre-activation and muscle activity during frontal impact in relation to whiplash associated disorders. Neuro Endocrinol Lett, 34(7), pp. 708-716.
Forriol, F., Pascual, J., 1990. Footprint analysis between three and 17 years of age. Foot Ankle, 11, pp. 101-104.
Halloran, J. P., Erdemir, A., van den Bogert, A. J., 2009. Adaptive surrogate modeling for efficient coupling of musculoskeletal control and tissue deformation models. J Biomech Eng, 131(1), pp.011-014.
Hawes, M. R., Nachbaeur, W., Sovak, D., Nigg, B. M., 1992. Footprint parameters as a measure of arch height. Foot Ankle, 13, pp. 22-26.
Chen, W.-P., Tang, F-T, Ju, Ch-W., 2001. Stress distribution of the foot during mid-stance to push-off in barefoot gait: a 3-D finite element anylysis. Clin Biomech 16, pp. 614-620.
Cheung, J. T., Zhang, M., 2005a. A 3-dimensional finite element model of the human foot and ankle for insole design. Arch Phys Med Rehabil, 86(2), pp. 353-358.
Cheung, J. T., Zhang, M., Leung, A. K., Fan, Y. B., 2005b. Three-dimensional finite element analysis of the foot during standing--a material sensitivity study. J Biomech, 38(5), pp. 1045-1054.
Chippaux, C., 1947. Elements d’anthropologie. Marseille: Le Phar. radiographic analysis of the feet. J Pediatr Orthop, 21, pp. 225-228.
Kernozek, T. W., Ricard, M. D., 1990. Foot placement angle and arch type: effect on rearfoot motion. Arch Phys Med Rehabil, 71, pp. 988-991.
Lochner, S. J., Huissoon, J. P., Bedi, S. S., 2014. Development of a patient-specific anatomical foot model from structured light scan data. Comput Methods Biomech Biomed Engin, 17(11), pp. 1198-1205.
Lundgren, P., Nester, C., Liu, A., Arndt, A., Jones, R., Stacoff, A., Wolf, P., 2008. Invasive in vivo measurement of rear-, mid- and forefoot motion during walking. Gait Posture, 28, pp. 93-100.
Mickle, K. J., Munro, B. J., Lord, S. R., Menz, H. B., Steele, J. R., 2011. Gait, balance and plantar pressures in older people with toe deformities. Gait Posture, 34(3), pp. 347-351.
Nester, C., Jones, R. K., Liu, A., Howard, D., Lundberg, A., Arndt, A., Wolf, P., 2007b. Foot kinematics during walking measured using bone and surface mounted markers. J Biomech, 40, pp. 3412-3423.
Nester, C. J., Liu, A. M., Ward, E., Howard, D., Cocheba, J., Derrick, T., Patterson, P., 2007a. In vitro study of foot kinematics using a dynamic walking cadaver model. J Biomech, 40(9), pp. 1927-1937. longitudinal plantar arch assessment and when does arch maturation occur? The Foot, 18, pp. 142-149.
Queen, R. M., Mall, N. A., Hardaker, W. M., Nunley, J. A., 2007. Describing the medial longitudinal arch using footprint indices and a clinical grading system. Foot Ankle Int, 28, pp. 456-462.
Rose, G. K., Welton, E. A., Marshall, T., 1985. The diagnosis of flat foot in the child. J Bone Joint Surg, 67B, pp. 71-78.
Rypl, D., 2004. T3D Mesh Generator Guide. Retrieved from http://mech.fsv.cvut.cz/~dr/t3d.html
Scott, S. H., Winter, D. A., 1993. Biomechanical model of the human foot: kinematics and kinetics during the stance phase of walking. J Biomech, 26(9), pp. 1091-1104.
Smirak, J., 1960. Prispevek k problematice ploche nohy u skolni a pracujici mladeze. Praha: SPN.
Staheli, L. T., Chew, D. E., Corbett, M., 1987. The longituidinal arch. J Bone Joint Surg, 69A, pp. 426-428.
Stebbins, J., Harrington, M., Thompson, N., Zavatsky, A., Theologis, T., 2006. Repeatability of a model for measuring multi-segment foot kinematics in children. Gait Posture, 23(4), pp. 401-410.
Telfer, S., Woodburn, J., 2010. The use of 3D surface scanning for the measurement and assessment of the human foot. J Foot Ankle Res, 3, p. 19.
Tětková, Z., Jelen, K., 2009. 3D tvarová analýza struktur nohy pod zatížením. Dissertation Thesis, Charles University Prague.
Urbanová, P., Hejna, P., Jurda, M., 2015. Testing photogrammetry-based techniques for three-dimensional surface documentation in forensic pathology. Forensic Science International, 250, pp. 77-86.
Villaroya, M. A., Esquivel, J. M., Tomas, C., Moreno, L. A., Buenafe, A., Bueno, G., 2009. Assessment of the medial longitudinal arch in children and adolescents with obesity: footprints and radiographic study. Eur J Pediatr, 168, pp. 559-567.
Volpon, J. B., 1994. Footprint analysis during the growth period. J Pediatr Orthop, 14, pp. 83-85.
Wearing, S. C., Hills, A. P., Byrne, N. M., Hennig, E. M., 2004. The arch index: a measure of flat or fat feet? Foot Ankle Int, 25, pp. 575-581.
Woodburn, J., Helliwell, P.,S., 1996. Observation on the F-Scan in-shoe pressure measuring system. Clin Biomech, 11(5), pp. 301-304.
![Figure 6. Creep experiment simulation – shear stress distribution [Pa]](https://thumb-ap.123doks.com/thumbv2/123dok/3217966.1394873/4.595.311.528.71.457/figure-creep-experiment-simulation-shear-stress-distribution-pa.webp)
