INTEGRATION OF SPECTRAL INFORMATION
AND PHOTOGRAMMETRIC DSM FOR URBAN AREAS CLASSIFICATION
F. Nex a, M. Dalla Mura b, F. Remondino a
a 3D Optical Metrology unit, Bruno Kessler Foundation (FBK) – <franex, remondino>@fbk.eu, http://3dom.fbk.eu b GIPSA-Lab, Grenoble Institute of Technology – [email protected],
http://www.gipsa-lab.grenoble-inp.fr
Commission III, WG 4
KEY WORDS: Classification, Urban, DSM, Matching, Spectral
ABSTRACT:
The automated classification of urban areas in one of the main topic in the Geomatics domain. Several papers dealing with this topic have been already presented in the last decade. Most of these approaches uses multi-spectral or LiDAR data or both of them as input. In this paper, an algorithm for urban areas classification based only on overlapping RGB images is presented. The integration of radiometric and geometric information derived from aerial images is exploited in order to extract the three main classes of urban areas (i.e. building, vegetation and road) in automated way and without prior information. A photogrammetric Digital Surface Model (DSM) is firstly generated applying dense image matching techniques and this information as well as some spatial features provided by morphological filters are combined to derive a first classification. Subsequently, a thematic classification of the surveyed areas is performed considering the surface’s reflectance in the visible spectrum of the used images and the multi-image information provided by the overlapping images. Range and image information are so merged in an algorithm that allows the reciprocal and iterative sharing of information in order to increase the reliability and completeness of the classification process. After a detailed description of the algorithm, the achieved results over dense urban areas are shown and discussed.
1. INTRODUCTION
It is well known that remote sensing images can be extremely useful for the monitoring of Earth’s surface evolution (Richards and Jia, 2006) and in particular for urban areas analyses (Donnay et al., 2001). In most cases, a thematic classification of the surveyed scene is requested. Different typologies of data, regardless their origin (LiDAR acquisitions, photogrammetry, cadastral maps) have already proven to provide valuable information for classification purposes. Some works considered the use of LiDAR data, as the multi-echo (or full waveform) information can be very useful for the vegetation extraction and the building detection (Lafarge and Mallet, 2012; Fujii and Arikawa, 2001). Other papers consider the integration between LiDAR and spectral images (Guo et al. 2011; Awrangjeb et al., 2010). On the other hand, aerial and satellite images are normally employed for classification purposes exploiting the information provided by different bands on urban scenes (Ok et al., 2013; Licciardi et al., 2012; Longbotham et al., 2012; Pedergnana et al., 2012; Longbotham et al., 2011; Pedergnana et al., 2011; Sirmacek and Ulsalan, 2011) or forest areas (Dalponte et al., 2008). Only some of them exploit the 3D information achievable from multispectral images (Zebelin et al., 2006; Krauss and Reinartz, 2010).
In the practical cases, up-to-date and dense LiDAR data or multispectral images might not be available. The problem becomes more complex when the availability of both this data is needed. The availability of overlapping images acquired over the same scene is a common scenario thanks to the acquisitions of photogrammetric blocks from airborne sensors. Their spatial coverage is usually limited with respect to satellite imagery whilst they can provide a richer description of the scene thanks to the higher spatial resolution and the angular information. The main application of photogrammetric blocks (with panchromatic and multispectral images) is the generation of DSMs of the surveyed area via image matching approaches and of ortho-rectified images.
In this work we focus on the analysis of photogrammetric blocks acquired in the visible domain (i.e. RGB images). Thus,
no information is available in the Near InfraRed (NIR) region. This choice is motivated by the fact of using existing aerial images and also by the constantly increasing spread of UAVs mounting commercial SRL or even compact cameras which acquire only RGB images.
hand, the classification based only on spectral pixel values can be guided and integrated with 3D coordinates information increasing the capabilities of the classification process with respect to the only use of colour information. Since in this work we are interested in an unsupervised approach, no information on the scenes analysed is considered. Thus, the discrimination into the three land cover types of interest is given by performing a sequence of operations based on the different characteristics of the classes. The proposed architecture is thus based on some
a priori assumptions (e.g., buildings are off-ground objects,
In the following sections, the classification performed using DSM and image data separately will be firstly described. Then it is presented how this information is shared and merged. Finally the results achieved over two dense urban areas (Torino and Marseille) are reported and commented.
2. METHODOLOGY
In this section the description of the adopted classification methodology is described. It can be divided in two main steps that are then merged together in order to share their complementary information: (i) the DSM classification and (ii) the image classification. For the sake of simplicity, these parts are initially described separately in the following sections. Their integration for the final classification process is described in the last section.
2.1 DSM geometric classification
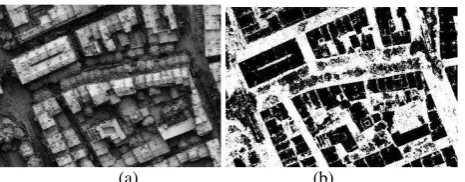
The classification of a photogrammetric DSM can be a demanding task, as no multi-echo information is available. The classification itself must consider only the geometric information of the “single return” DSM provided by dense image matching techniques (Pierrot-Deseilligny and Paparoditis, 2006; Hirschmuller, 2008; Krauss et al., 2008). In the presented approach the MicMac (Pierrot-Deseilligny and Paparoditis, 2006) software have been used for DSM extraction. Photogrammetric DSMs (Figure 1a) are usually denser but noisier than the LiDAR data and can have several mismatches in correspondence of occluded areas and shadows. For this reason a preliminary DSM filtering is normally performed. Man-made objects on urban areas are usually characterized by local flat areas (roofs, roads, etc.) with reduced slope variations. On the other hand, matching blunders are usually characterized by chaotic and rough depth variations. Thus the estimation of the local reliability of points’ height can give a good indication about of each point location. The local reliability is computed considering the height variations in 8 different directions. A point is considered unreliable when its height is different from the values of its neighbourhood (Nex and Remondino, 2012): a threshold of 2-3 GSD (Ground Sampling Distance) is usually adopted. An example of the achieved reliability maps is shown in Figure 1b. Unreliable areas are usually excluded from the DSM in order to prevent errors in the successive classification processes. The filtered DSM is finally used as input for the successive off-ground region extraction (Chen et al., 2006; Lee et al., 2008; Awrangjeb et al., 2010; Habib et al., 2010). In particular, the areas in correspondence of buildings and vegetation are extracted with an iterative regular grid filtering (Nex and Remondino, 2011). This method starts from the
assumption that the height of a point on the ground is locally lower than the height of neighbouring non-ground points.
(a) (b)
Figure 1: Original DSM (a) and unreliable areas in white (b).
The approach splits the DSM in patches and considers two different problems: (i) the ground height variations over a large patch and (ii) the presence of buildings of large dimensions that makes the retrieval of the ground height more complex if a too small DSM patch is considered. The ground height is thus iteratively computed on different DSM patch dimensions. At each iteration (4-5 iterations are normally performed) the patch is halved and the most representative value of the ground height is determined. The minimum height values on DSM patches are initially considered and their consistency with the ground value of the former iteration is checked in order to achieve reliable results in dense urban areas with buildings of very different heights and dimensions. Off-ground points are defined considering points higher than a defined threshold (2.5-4 m) with respect to the ground height value. The approach has shown to be reliable even when the terrain slope increases and the parameter settings do not significantly influence the achieved results (Figure 2a).
(a) (b)
Figure 2: Off-ground region for the DSM of Figure 1a (a) and filtered vegetation (b).
correspondence of irregular shaped regions (i.e. vegetation). Therefore, considering also the contours of the regions, areas characterized by irregular contours and high values of variability in height can be classified as vegetation while areas with regular contours and low variability maps are defined as buildings. The variability threshold is usually set equal to the image GSD (Ground Sampling Distance) dimension, but this threshold could differ according to the quality of the data. The perimeter/area ratio has a threshold ranging between 1 and 2. An area is classified as vegetation when both the thresholds are overcome. These two features do not allow a complete distinction and classification but they usually provide an overall good indication of some of the vegetated areas which are then used as training areas by the image classifier (Figure 2b).
2.2 Image classification
As mentioned, an unsupervised approach for land cover mapping was chose to overcome the unavailability of a training set or the limitations related to an incomplete set of samples. For performing the classification we considered k-means (Duda and Hart, 1973), a widely used clustering algorithm that assigns each pattern in the classification problem to the cluster with closest centroid. The algorithm requires the user to specify the number of clusters to search and performs iteratively the updating of an arbitrary initial grouping until a stable configuration is reached. Since this algorithm considers all the samples in the process and requires the computation of distances between each pairs of patterns (here considered as Euclidean distances), the computational load can be very high for large datasets. For this reason the algorithm is run only on a subset of pixels selected randomly from the full image. The experimental tests showed the clustering are not significantly influenced by the size of the subsets considered.
A supervised algorithm is also used for deriving a final classification map of the scene and considering the results of the initial clustering as labeled samples for the training phase. This operation was performed in order to “propagate” the decision given by the k-means on a subset of pixels to all the others in the image. Random Forest (RF) is considered as classifier due to the robustness and high performances achieved in the classification of remote sensing images (Breiman, 2001). RF is an ensemble of Classification And Regression Trees (CART). They are considered together, forming a forest, in order to derive the decision for each pixel. Each tree in the forest is constructed considering only a random subset of all the labelled samples for training and a random subset of the available features. These characteristics avoid the classifier to over-fit the known data. The final decision is obtained by majority voting on all the decisions of the single trees. In all the experiments, 50 trees were considered in the forest and the number of features considered in each split was set to the square root of the total number of features - suggested default value in (Breiman, 2001).
2.3 Integrated classification workflow
The photogrammetric DSM and image spectral analysis provide complementary information that can be merged together in order to improve the results achieved separately by each typology of classification. The proposed integration methodology can be divided in two main steps:
(i) the training phase (that automatically defines the suitable training samples for the classifier);
(ii) the final classification.
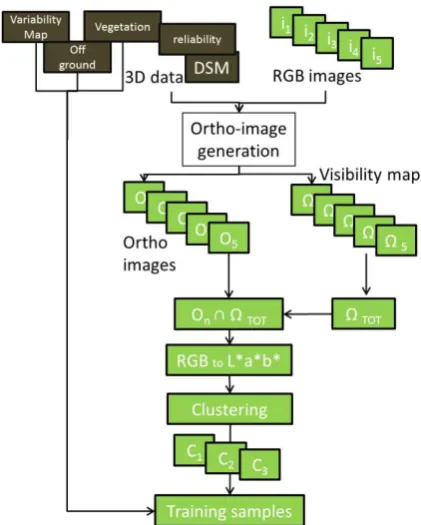
The training phase can be divided in several sequential steps, as shown in Figure 3. The input data is provided by the available
Figure 3: Scheme of the training methodology.
overlapping images. The samples available for training the classifier are not given a priori but are generated by the unsupervised clustering performed on 3D data.
The DSM, the vegetation map, the variability and off-ground regions are derived according to the methodology presented in section 2.1. An ortho-image (Oi) and the visibility map (Ωi) for
each image are also computed. Then, the intersection of all the
Ωi is performed in order to define areas that is visible from all
the image (ΩTOT): only this area will be considered on the ortho-images (Oi ∩ ΩTOT). Then the RGB space is converted in the L*a*b* space. In L*a*b* space the color information is confined in the a* and b* channels and the luminance of the color in L*, whereas these are mixed in the RGB space. Thus, by considering the a* and b* channels it is possible to perform more effectively an analysis focused on the color information rather than considering the RGB version of the data.
Each Oi is then clustered in 3 different classes: C1, C2 and C3. Behind this step there is the assumption that the samples belonging to neither of the three classes are much less in number with respect to the other classes. If this assumption is not valid, it will be likely to have mixed results. The found clusters are intersected with the maps obtained from the analysis of the DSM (variability, vegetation and off-ground) in order to extract suitable training samples for the building, vegetation and road classes. To do that, the following rules are considered:
(2)(22
(2)
After having found the training samples the training samples are used as input in the second part of the methodology, when the classification of the whole urban area is performed (Figure 4). Each image of the dataset is converted to L*a*b* space and it is classified separately using the RF classifier trained on the available samples labelled by the clustering algorithm (10000 samples per class were considered in the experiments). The classifications achieved on each image are then merged in a unique map with a majority rule. In this way, most of the noise and the uncertainties that can be detected on a single image can be compensated by the multi-image approach. This spectral-based classification allows to achieve reliable results in most of the cases. Anyway, several misclassification can be still detected: some regions on buildings can be still classified as vegetation and roads. For this reason, the 3D information provided by the DSM and off-ground classification is used to correct the topological discrepancies. Points initially classified as roads (i.e. roof niches) and located in the off-ground region (and connected to other roofs) are re-classified as roofs. Then, little isolated regions (i.e. little roof region in the vegetation area) are re-classified using the information provided by the neighboring points.
Figure 4: Scheme of the classification methodology
3. INPUT DATA AND PERFORMED TESTS
Two different datasets were used for testing the developed methodology. For both image blocks a photogrammetric DSM was derived using an optical flow algorithm implemented in MicMac. The spatial resolution of the achieved point cloud was set equal to the image GSD.
3.1 Torino dataset (Italy)
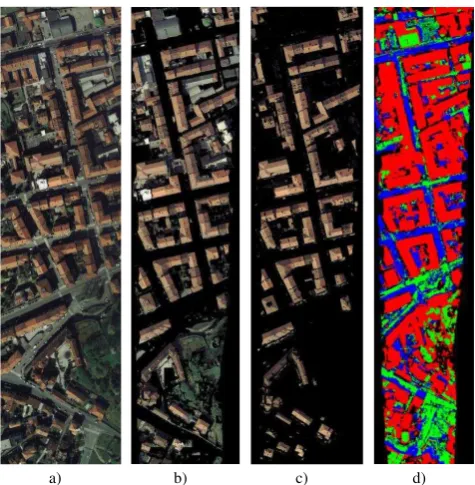
The dataset is composed of three aerial RGB 8-bit images acquired with a DMC camera over an area of Torino (Italy) and covers about 0.5×0.5 km. The image GSD is 12 cm. The surveyed scene is representative of a dense European urban area and it features several high buildings (up to 25 m), trees, roads, a terrain height variation and shadows in the streets. Only a
subset of the original images was considered in the experiments, in particular the area visible in all the images (Figure 5a). The achieved results show the off-ground region (Figure 5b), the roof region exploiting the spectral information (Figure 5c) and the final classification (Figure 5d): red represents the building class, blue roads and green vegetation; black areas are in correspondence of unclassified regions (due to missing data in the DSM). The roof region can be generally reconstructed in a quite correct way. Several problems still remains in the vegetation and shadow regions: these problems could be due to the number and radiometric quality of the images. The achieved results were compared with a ground truth (defined by visual inspection) as proposed in (Dalla Mura et al., 2012; Congalton and Green, 2009). A quantitative evaluation was performed by computing class-wise and global accuracies (Table 1).
Buildings Vegetation Roads User Accuracy (%) 97.59 8.03 81.06 Producer Accuracy(%) 98.87 18.86 44.36
Overall Accuracy (%) 90.62 Kappa Coefficient 0.61
Table 1: Accuracy evaluation of the Torino test area.
From the obtained results, it is possible to state that overall the classification of buildings is achieving good results whereas vegetation and roads are less accurately discriminated, in particular for vegetation.
a) b) c) d)
Figure 5: The analysed scene (a), the off-ground classification (b), the roof class provided by the spectral information (c) and
the final 3-classs classification (d). Classification results: building in red, roads in blue and vegetation in green.
3.2 Marseille dataset (France)
more accurate DSM (higher image overlap and better image quality). The vegetation areas are extracted in more precise way and the classification is generally more correct. Some problems arise on the buildings borders that are sometimes not very sharp. Some misclassifications are still visible in correspondence of some trees. Some unclassified areas are mainly concentrated on the ground and in correspondence of narrow, shadowed and occluded roads.
a)
b)
c)
Figure 6: The analysed area over Marseille (a) with the generated DSM (b) and the classification results (c): building (red), roads (blue), vegetation (green) and missing data (black).
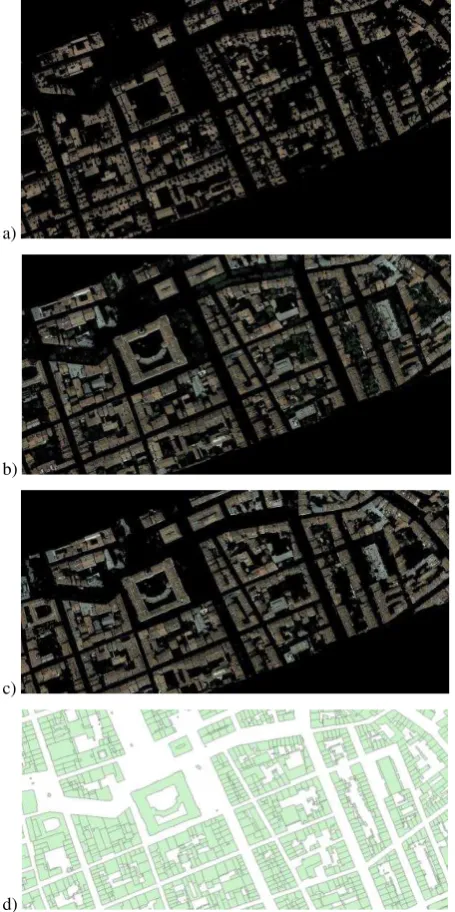
The advantages of integrating spectral and geometric information are clear by looking at Figure 7 which shows the roof classification results achieved using only spectral information (Figure 7a) only geometric information (Figure 7b) and combining DSM-based features and spectral information (Figure 7c), as proposed in this article. The first two approaches produced holes and incorrect classifications while the proposed integrated method allowed to improve the quality of the results. The achieved results were compared to a vector cadastral map provided by the French IGN (Figure 7d) to qualitatively compare their completeness and reliability. The map shows the outline of buildings as available to the cadastral census. In order to be able to quantitatively evaluate the results of the proposed classification process the cadastral map was rasterized and resampled at the same spatial resolution of the classification map and registered to it. We assumed that all the areas that are not buildings in the cadastral map should either be vegetation or roads. The accuracy evaluation was performed by considering two classes: buildings and vegetation + roads (Table 2).
Buildings Vegetation + roads User Accuracy (%) 85.72 91.84 Producer Accuracy (%) 97.49 63.42
Overall Accuracy (%) 87.03 Kappa Coefficient 0.68
Table 2: Accuracy evaluation of the Marseille test area.
The low success rate for the buildings is mainly due to small buildings surrounded by higher palaces that partially occluded or shadowed them in most of the images: the quality of the DSM in that areas was very poor and the spectral information was partial or unreliable for classification purposes.
a)
b)
c)
d)
Figure 7: Spectral (a) and geometric (b) classifications of the building class. Results obtained combining both information (c).
Digital map of the test area for completeness analyses (d).
4. CONCLUSIONS AND FUTURE DEVELOPMENTS
provide significant improvements (Dalla Mura et al., 2012). On the opposite, the use of 3D data in the selection of proper training samples and in the correction of topological inconsistencies has increased the classification results.
The achieved results has provided quite promising results in the analysed areas especially in the classification of buildings. Vegetated areas proved to be difficult to extract mainly due to their spectral vicinity to roads (especially in Torino data set) and not accurate characterization in the DSM. The comparison with available reference maps has quantitatively shown the potential of the proposed method.
Several improvements still need to be done. The used sequential approach could be critical as errors can cumulate in the process: further improvements to increase the stability of the process will be performed. The building outlines are sometimes not precise and some misclassifications can be still detected especially in correspondence of the vegetation class: the detection of this class is partially influenced by the DSM quality. The influences on the number and positions of overlapping images on the classification results will be considered too. New tests will also be performed on more extended areas in order to evaluate the reliability of the method in different operative conditions.
REFERENCES
Awrangjeb, M., Ravanbakhsh, M., Fraser, C.S., 2010. Automatic detection of residential buildings using LiDAR data and multispectral imagery. ISPRS Journal of Photogrammetry and Remote Sensing, Vol. 65, pp. 457-467.
Breiman, L., 2001. Random forests. Machine Learning, Vol. 45(1):5-32.
Chen, L.C., Teo, T.A., Hsieh, C.H., Rau J.Y., 2006. Reconstruction of building models with curvilinear boundaries from laser scanner and aerial imagery. LNCS, Vol. 4319, pp. 24-333.
Congalton, R., Green, K., 2009. Assessing the accuracy of remotely sensed data: Principles and practices. 2nd Edition. CRC/Taylor & Francis, Boca Raton (FL), USA, 183p.
Dalla Mura, M., Nex, F., Remondino, F., Zanin, M., 2012. Integration of photogrammetric DSM and advanced image analysis for the classification of urban areas. Image and Signal Processing for Remote Sensing XVIII, Proc. of SPIE, Vol. 8537.
Dalla Mura, M., Benediktsson, J. A., Waske, B., Bruzzone, L., 2010. Morphological attribute profiles for the analysis of very high resolution images. IEEE Trans. Geoscience and Remote Sensing, Vol. 48, pp. 3747-3762.
Dalponte, M., Bruzzone, L., Gianelle, D., 2008. Fusion of hyperspectral and lidar remote sensing data for classification of complex forest areas. IEEE Trans. Geoscience and Remote Sensing, Vol. 46(5), pp. 1416-1427.
Donnay, J., Barnsley, M., Longley, P., 2001. Remote sensing and urban analysis. GISDATA Series, Taylor & Francis.
Duda, R. O., Hart, P., E., 1973. Pattern classification and scene analysis. Vol. 3.Wiley Editors, New York.
Fujii, K. and Arikawa, T., 2002. Urban object reconstruction using airborne laser elevation image and aerial image. IEEE Trans. Geoscience and Remote Sensing, Vol. 40(10), pp. 2234-2240.
Guo, L., Chehata, N., Mallet, C., Boukir, S., 2011. Relevance of airborne LiDAR and multispectral image data for urban scene classification using Random Forests. ISPRS Journal of Photogrammetry and Remote Sensing, Vol.66, pp. 56-66.
Habib, A.F., Zhai, R., Kim, C., 2010. Generation of complex polyhedral building models by integrating stereo aerial imagery and LiDAR data. Photogrammetric Engineering & Remote Sensing, Vol. 76, pp. 609-623.
Hirschmuller, H., 2008. Stereo processing by semi-global matching and mutual information. IEEE Trans. PAMI, Vol. 30, pp. 328-341.
Krauss, T., Lehner, M., Reinartz, P., 2008. Generation of coarse 3D model of urban areas from high resolution stereo satellite images. ISPRS Int. Archives of Photogrammetry, Remote Sensing and Spatial Information Sciences, Vol. 37, pp. 1091-1098.
Krauss, T. and Reinartz, P., 2010. Enhancement of dense urban digital surface models from VHR optical satellite stereo data by pre-segmentation and object detection. Int. Archives of Photogrammetry, Remote Sensing and Spatial Information Sciences, Vol. 38(1).
Lafarge, F., Mallet, C., 2012. Creating large-scale city models from 3D-point clouds: a robust approach with hybrid representation. International Journal of Computer Vision, Vol. 99(1), pp. 69-85.
Lee D.H., Lee K.M., Lee S.U., 2008. Fusion of LiDAR and imagery for reliable building extraction. Photogrammetric Engineering & Remote Sensing, Vol. 74(2), pp. 215-225.
Licciardi, G. A., Villa, A., Dalla Mura, M., Bruzzone, L., Chanussot, J., Benediktsson, J., 2012. Building height retrieval from Worldview-2 multi-angular imagery using attribute profiles and geometric invariant moments. IEEE Journal of Selected Topics in Applied Earth Observations and Remote Sensing, Vol. 5(1), pp. 71-79.
Longbotham, N., Chaapel, C., Bleiler, L., Padwick, C., Emery, W., Pacifici, F., 2012. Very high resolution multiangle urban classification analysis. IEEE Trans. Geoscience and Remote Sensing, Vol. 50(4), pp. 1155-1170.
Longbotham, N., Bleiler, C., Chaapel, C., Padwick, C., Emery, W., Pacifici, F., 2011. Spectral classification of Worldview-2 multi-angle sequence. Proc. IEEE Joint Urban Remote Sensing Event (JURSE), pp. 109-112.
Nex, F., Remondino, F., 2012. Automatic roof reconstruction from photogrammetric DSM. ISPRS Annals of Photogrammetry, Remote Sensing and Spatial Information Sciences, Vol.(I-3), pp.257-262.
Nex, F., Remondino, F., Rinaudo, F., 2011. Integration of range and image data for building reconstruction. Videometrics, Range Imaging and Applications XI - Proc. of SPIE Optical Metrology, Vol. 8085.
Pedergnana, M., Marpu, P., Dalla Mura, M., Benediktsson, J., Bruzzone, L., 2012. Classification of remote sensing optical and lidar data using extended attribute profiles. IEEE Journal of Selected Topics in Signal Processing, Vol. 6, pp. 856-865.
Pedergnana, M., Marpu, P. R., Dalla Mura, M., Benediktsson, J. A., Bruzzone, L., 2011. Fusion of hyper-spectral and LiDAR data using morphological profiles. Image and Signal Processing for Remote Sensing XVII , Proc. SPIE, Vol. 8180.
Pierrot-Deseilligny, M., Paparoditis, N., 2006. A multiresolution and optimization-based image matching approach: an application to surface reconstruction from spot5-hrs stereo imagery. ISPRS Int. Archives of Photogrammetry, Remote Sensing and Spatial Information Sciences, Vol. 36(1/W41).
Ok, A.O., Senaras, C., Yuksel, B., 2013. Exploiting shadow evidence and iterative graph-cuts for efficient detection of building in complex environments. ISPRS Int. Archives of Photogrammetry, Remote Sensing and Spatial Information Sciences, Vol. 40(1/W1).
Richards, J. A., Jia, X., 2006. Remote sensing digital image analysis: an introduction. Springer Verlag.
Sirmacek, B., Unsalan, C., 2011. A probabilistic framework to detect buildings in aerial and satellite images. IEEE Trans. Geoscience and Remote Sensing, Vol. 49(1), pp. 211-221.
Zebedin, L., Klaus, A., Gruber-Geymayer, B., Karner, K., 2006. Towards 3D map generation from digital aerial images. ISPRS Journal of Photogrammetry and Remote Sensing, Vol.60, pp.413-427.
ACKNOWLEDGEMENTS