Lampiran 1
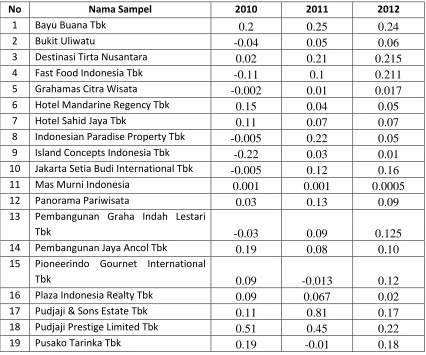
Tabel Net Working Capital to Total Assets (X1)
No Nama Sampel 2010 2011 2012
1 Bayu Buana Tbk 0.2 0.25 0.24
2 Bukit Uliwatu -0.04 0.05 0.06
3 Destinasi Tirta Nusantara 0.02 0.21 0.215
4 Fast Food Indonesia Tbk -0.11 0.1 0.211
5 Grahamas Citra Wisata -0.002 0.01 0.017
6 Hotel Mandarine Regency Tbk 0.15 0.04 0.05
7 Hotel Sahid Jaya Tbk 0.11 0.07 0.07
8 Indonesian Paradise Property Tbk -0.005 0.22 0.05
9 Island Concepts Indonesia Tbk -0.22 0.03 0.01
10 Jakarta Setia Budi International Tbk -0.005 0.12 0.16
11 Mas Murni Indonesia 0.001 0.001 0.0005
12 Panorama Pariwisata 0.03 0.13 0.09
13 Pembangunan Graha Indah Lestari
Tbk -0.03 0.09 0.125
14 Pembangunan Jaya Ancol Tbk 0.19 0.08 0.10
15 Pioneerindo Gournet International
Tbk 0.09 -0.013 0.12
16 Plaza Indonesia Realty Tbk 0.09 0.067 0.02
17 Pudjaji & Sons Estate Tbk 0.11 0.81 0.17
18 Pudjaji Prestige Limited Tbk 0.51 0.45 0.22
Lampiran 2
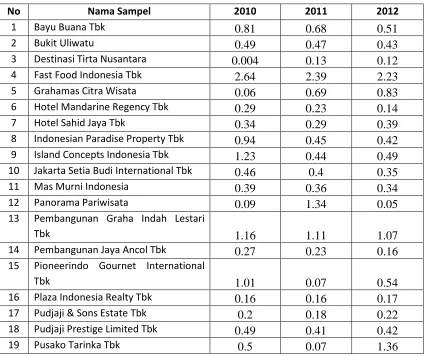
Tabel Retained Earnings to Total Assets (X2)
No Nama Sampel 2010 2011 2012
1 Bayu Buana Tbk 0.81 0.68 0.51
2 Bukit Uliwatu 0.49 0.47 0.43
3 Destinasi Tirta Nusantara 0.004 0.13 0.12
4 Fast Food Indonesia Tbk 2.64 2.39 2.23
5 Grahamas Citra Wisata 0.06 0.69 0.83
6 Hotel Mandarine Regency Tbk 0.29 0.23 0.14
7 Hotel Sahid Jaya Tbk 0.34 0.29 0.39
8 Indonesian Paradise Property Tbk 0.94 0.45 0.42
9 Island Concepts Indonesia Tbk 1.23 0.44 0.49
10 Jakarta Setia Budi International Tbk 0.46 0.4 0.35
11 Mas Murni Indonesia 0.39 0.36 0.34
12 Panorama Pariwisata 0.09 1.34 0.05
13 Pembangunan Graha Indah Lestari
Tbk 1.16 1.11 1.07
14 Pembangunan Jaya Ancol Tbk 0.27 0.23 0.16
15 Pioneerindo Gournet International
Tbk 1.01 0.07 0.54
16 Plaza Indonesia Realty Tbk 0.16 0.16 0.17
17 Pudjaji & Sons Estate Tbk 0.2 0.18 0.22
18 Pudjaji Prestige Limited Tbk 0.49 0.41 0.42
Lampiran 3
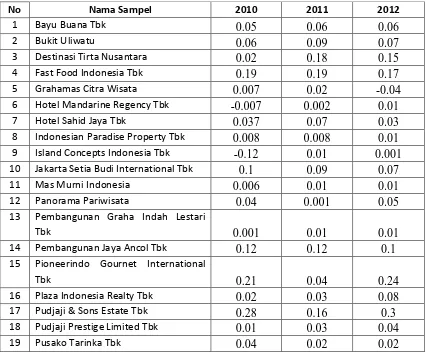
Tabel Earnings Before Interest And Taxes to Total Assets (X3)
No Nama Sampel 2010 2011 2012
1 Bayu Buana Tbk 0.05 0.06 0.06
2 Bukit Uliwatu 0.06 0.09 0.07
3 Destinasi Tirta Nusantara 0.02 0.18 0.15
4 Fast Food Indonesia Tbk 0.19 0.19 0.17
5 Grahamas Citra Wisata 0.007 0.02 -0.04
6 Hotel Mandarine Regency Tbk -0.007 0.002 0.01
7 Hotel Sahid Jaya Tbk 0.037 0.07 0.03
8 Indonesian Paradise Property Tbk 0.008 0.008 0.01
9 Island Concepts Indonesia Tbk -0.12 0.01 0.001
10 Jakarta Setia Budi International Tbk 0.1 0.09 0.07
11 Mas Murni Indonesia 0.006 0.01 0.01
12 Panorama Pariwisata 0.04 0.001 0.05
13 Pembangunan Graha Indah Lestari
Tbk 0.001 0.01 0.01
14 Pembangunan Jaya Ancol Tbk 0.12 0.12 0.1
15 Pioneerindo Gournet International
Tbk 0.21 0.04 0.24
16 Plaza Indonesia Realty Tbk 0.02 0.03 0.08
17 Pudjaji & Sons Estate Tbk 0.28 0.16 0.3
18 Pudjaji Prestige Limited Tbk 0.01 0.03 0.04
Lampiran 4
Tabel Market Value of Equityto Total Liabilities (X4)
No Nama Sampel 2010 2011 2012
1 Bayu Buana Tbk 1.8 0.83 0.9
2 Bukit Uliwatu 1.09 1.47 1.67
3 Destinasi Tirta Nusantara 1.84 1.15 1.25
4 Fast Food Indonesia Tbk 1.22 1.24 1.91
5 Grahamas Citra Wisata 1.51 1.8 3.08
6 Hotel Mandarine Regency Tbk 2.38 1.28 1.16
7 Hotel Sahid Jaya Tbk 1.27 1.08 1.48
8 Indonesian Paradise Property Tbk 1.01 2.77 2.41
9 Island Concepts Indonesia Tbk 0.11 0.22 0.31
10 Jakarta Setia Budi International Tbk 1.09 1.28 1.2
11 Mas Murni Indonesia 10.99 7.11 5.06
12 Panorama Pariwisata 0.43 2.68 0.39
13 Pembangunan Graha Indah Lestari
Tbk 6.93 5.44 4.53
14 Pembangunan Jaya Ancol Tbk 1.31 2.11 1.21
15 Pioneerindo Gournet International
Tbk 0.53 0.51 1.39
16 Plaza Indonesia Realty Tbk 0.99 1.18 1.29
17 Pudjaji & Sons Estate Tbk 0.9 1.45 1.82
18 Pudjaji Prestige Limited Tbk 3.49 2.40 2.38
Lampiran 5
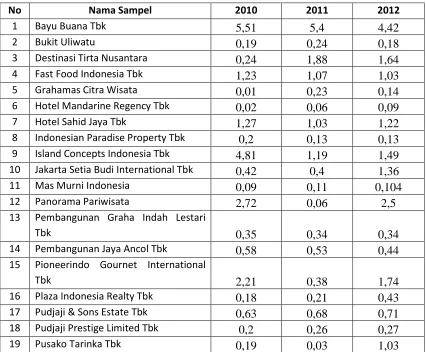
Tabel Sales to Total Assets (X5)
No Nama Sampel 2010 2011 2012
1 Bayu Buana Tbk 5,51 5,4 4,42
2 Bukit Uliwatu 0,19 0,24 0,18
3 Destinasi Tirta Nusantara 0,24 1,88 1,64
4 Fast Food Indonesia Tbk 1,23 1,07 1,03
5 Grahamas Citra Wisata 0,01 0,23 0,14
6 Hotel Mandarine Regency Tbk 0,02 0,06 0,09
7 Hotel Sahid Jaya Tbk 1,27 1,03 1,22
8 Indonesian Paradise Property Tbk 0,2 0,13 0,13
9 Island Concepts Indonesia Tbk 4,81 1,19 1,49
10 Jakarta Setia Budi International Tbk 0,42 0,4 1,36
11 Mas Murni Indonesia 0,09 0,11 0,104
12 Panorama Pariwisata 2,72 0,06 2,5
13 Pembangunan Graha Indah Lestari
Tbk 0,35 0,34 0,34
14 Pembangunan Jaya Ancol Tbk 0,58 0,53 0,44
15 Pioneerindo Gournet International
Tbk 2,21 0,38 1,74
16 Plaza Indonesia Realty Tbk 0,18 0,21 0,43
17 Pudjaji & Sons Estate Tbk 0,63 0,68 0,71
18 Pudjaji Prestige Limited Tbk 0,2 0,26 0,27
Lampiran 6 Discriminant
Notes
Output Created 14-Apr-2014 14:15:40
Comments
Input Active Dataset DataSet0
Filter <none> Weight <none> Split File <none> N of Rows in
Working Data File
57
Missing Value Handling Definition of Missing
User-defined missing values are treated as missing in the analysis phase.
Cases Used In the analysis phase, cases with no user- or system-missing values for any predictor variable are used. Cases with user-, system-missing, or out-of-range values for the grouping variable are always excluded.
Syntax DISCRIMINANT
/GROUPS=Y(1 4)
/VARIABLES=X1 X2 X3 X4 X5 /ANALYSIS ALL
/SAVE=CLASS SCORES PROBS /METHOD=MAHAL
/PIN=.05 /POUT=.10 /PRIORS EQUAL /HISTORY
/STATISTICS=MEAN STDDEV UNIVF BOXM COEFF RAW CORR COV GCOV TCOV
/PLOT=COMBINED SEPARATE /PLOT=CASES
/CLASSIFY=NONMISSING POOLED.
Resources Processor Time 0:00:01.841
Elapsed Time 0:00:03.776
Modified Dis1_1 Discriminant Scores from Function 1 for Analysis 1
Dis2_1 Discriminant Scores from Function 2 for Analysis 1
Dis3_1 Discriminant Scores from Function 3 for Analysis 1
Dis1_2 Probabilities of Membership in Group 1 for Analysis 1
Dis2_2 Probabilities of Membership in Group 2 for Analysis 1
Dis3_2 Probabilities of Membership in Group 3 for Analysis 1
Dis4_2 Probabilities of Membership in Group 4 for Analysis 1
Number of unweighted cases written to the working file after classification
57
Analysis Case Processing Summary
Unweighted Cases N Percent
Valid 57 100.0
Excluded Missing or out-of-range group codes
0 .0
At least one missing discriminating variable
0 .0
Both missing or out-of-range group codes and at least one missing
discriminating variable
0 .0
Total 0 .0
Total 57 100.0
Tests of Equality of Group Means
Wilks' Lambda F df1 df2 Sig.
NWC TO TA .841 3.335 3 53 .026
EBIT TO TA .940 1.136 3 53 .343
EQ TO TL .861 2.860 3 53 .045
S TO TA .813 4.059 3 53 .011
Pooled Within-Groups Matricesa
NWC TO TA RE TO TA EBIT TO TA EQ TO TL S TO TA
a. The covariance matrix has 53 degrees of freedom.
Covariance Matricesa
EQ TO TL .010 -.031 -.005 .372 -.199
a. The total covariance matrix has 56 degrees of freedom.
Analysis 1
Box's Test of Equality of Covariance Matrices Log Determinants
KEBANGKRUTAN Rank
Log
Pooled within-groups 4 -4.183 The ranks and natural logarithms of determinants printed are those of the group covariance matrices.
Test Results
Box's M 228.563
F Approx. 5.746
df2 923.743
Sig. .000
Tests null hypothesis of equal population covariance
matrices.
Stepwise Statistics
Variables Entered/Removeda,b,c,d
Step
Min. D Squared
Exact F
Entered Statistic
Between
At each step, the variable that maximizes the Mahalanobis distance between the two closest groups is entered.
a. Maximum number of steps is 10.
b. Maximum significance of F to enter is .05. c. Minimum significance of F to remove is .10.
d. F level, tolerance, or VIN insufficient for further computation.
Variables in the Analysis
Step Tolerance
RE TO TA .898 .011 .463 3,00 and 4,00
S TO TA .624 .000 .635 1,00 and 2,00
EQ TO TL .605 .000 .961 3,00 and 4,00
Variables Not in the Analysis Step Tolerance Min. Tolerance
Sig. of F to
Summary of Canonical Discriminant Functions Eigenvalues
Functio
n Eigenvalue % of Variance Cumulative %
1 1.841a 95.6 95.6 .805
2 .056a 2.9 98.5 .231
3 .028a 1.5 100.0 .165
a. First 3 canonical discriminant functions were used in the analysis.
Wilks' Lambda Test of
Function(s) Wilks' Lambda Chi-square df Sig.
1 through 3 .324 58.586 12 .000
2 through 3 .921 4.295 6 .637
3 .973 1.437 2 .487
Standardized Canonical Discriminant Function Coefficients
Function
Pooled within-groups correlations between discriminating variables and standardized canonical discriminant functions
Variables ordered by absolute size of correlation within function.
*. Largest absolute correlation between each variable and any discriminant function a. This variable not used in the analysis.
Canonical Discriminant Function Coefficients Unstandardized coefficients
Functions at Group Centroids KEBA Unstandardized canonical
discriminant functions evaluated at group means
Classification Statistics
Classification Processing Summary
Excluded Missing or out-of-range group codes
0
At least one missing discriminating variable
0
Used in Output 57
Prior Probabilities for Groups KEBA
NGKR
UTAN Prior
Cases Used in Analysis
Unweighted Weighted
1.00 .250 25 25.000
2.00 .250 5 5.000
3.00 .250 17 17.000
4.00 .250 10 10.000
Total 1.000 57 57.000
Classification Function Coefficients KEBANGKRUTAN Fisher's linear discriminant functions
Casewise Statistics Case
Numb er
Highest Group
Second Highest Group
Actua
Centroid Group
P(G=g | D=d)
Squared Mahalanobi
s Distance to Centroid