997
REMOTE SENSING IMAGE-BASED ANALYSIS OF THE URBAN HEAT ISLAND IN
DENPASAR, INDONESIA
Abd. R. As-syakur 1, I W. Nuarsa1, I W Arthana1, M. S. Mahendra1, I W. S. Adnyana1, I N. Merit1, R. Suyarto1, and K. A. Lila1
ABSTRACT: Denpasar city with a large population and urban size located in the Bali province, Indonesia, was chosen to study and quantify the entire urban heat island (UHI) as a continuously varying surface and its spatial expansion. Extensive urbanized surfaces modify the energy and water balance processes and influence the dynamics of air movement. Landsat 5 TM and 7 ETM+ images of Denpasar on 1995 and 2003 were selected to retrieve the brightness temperatures and urban heat island areas. The purpose of this study was to characterize the complete urban heat island in magnitude and spatial extent without the use of in situ measurements. The result showed in the center of the city that has density built up area created high surface radiant temperature in both observation times. Temperature changes are quite large due to the addition of population size and land use land cover changes. Vegetation abundance from urban forest or holy area has an important role controlling the cold surface radiant temperature in the center of city. The cross section analyses indicate that the land surface temperature (LST) intensity decreases gradually in the central parts of the city towards the surrounding. Indicated UHI effect may have occurred in Denpasar.
Keywords: Urban heat island (UHI); land surface temperature; landsat; normalized difference vegetation index (NDVI); denpasar
1 Environmental Research Center (PPLH), Udayana University, Bali, 80232, Indonesia
INTRODUCTION
Urbanization and the conversion of the Earth’s
surface to urban uses are among the most visible and rapid anthropogenic changes (Roth 2007). Urbanization is a dynamic process which involves expansion of urban related area and conversion of natural physical landscape to more economic land uses. Urbanization, not only leads to degradation of environment quality but it also affecting ecosystem health. Urbanization, an important driver of climate change and pollution, alters both biotic and abiotic ecosystem properties within, surrounding, and even at great distances from urban areas (Grimm et al. 2008).
A most noticeable phenomenon that has arisen as a result of city expansion is that urban climates are warmer and more polluted than their rural counterparts (Lo and Quattrochi 2003). Higher urban heat mainly caused due to the anthropogenic heat released from vehicles, power plants, air conditioners and other heat sources, and due to the heat stored and re-radiated by massive and complex urban structures (Memon et al. 2008). This phenomenon called the urban heat island (UHI) effect. This effect is not restricted to large metropolitan areas.
In fact, it has been detected in cities with populations of less than 10,000 (Karl et al. 1988).
The UHI is the characteristic warmth of urban areas compared to their (non-urbanized) surroundings. Generally, it refers to the increase in air temperatures, but it can also refer to the relative warmth of surface or subsurface materials (Voogt 2003). Until recently studies of urban effects on meteorology and climate have been conducted for isolated locations and with in situ measurements (Streutker 2002). With the advent of thermal remote sensing technology, remote observation
of UHI’s became possible using satellite data and has provided new avenues for the observation of UHI’s and
the study of their causation through the combination of thermal remote sensing and urban micrometeorology (Voogt and Oke 2003).
998
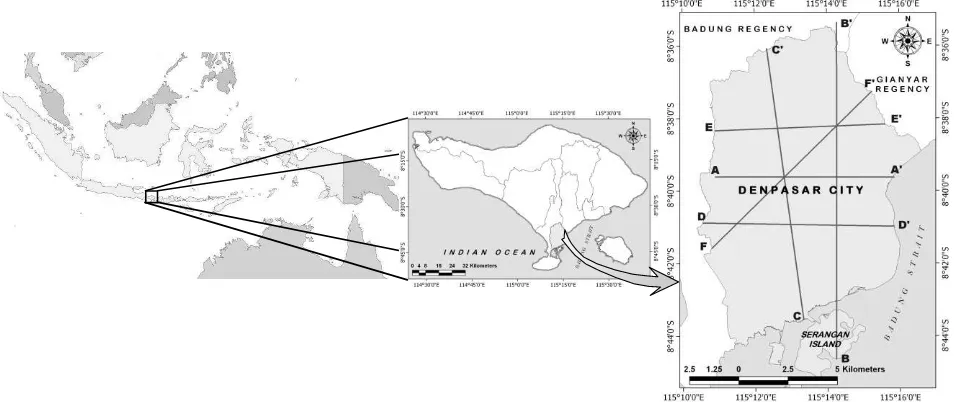
Fig. 1 Research Location. Lines indicating the transect cross section to examine LST intra-urban variation. studies (Voogt and Oke 1997). Denpasar represent an
urban city in Bali. The intense urbanization and dense building may result in the urban heat island phenomenon. The temperature variations may be attributable to greater absorbency of man-made materials, and denser buildings which restrict air-flow. It is very important to conduct an urban heat island analysis of Denpasar and evaluate its impact on urban environment in the city. Urban development usually results in a dramatic alteration at the surface, as natural vegetation removed and replaced by reduced evaporating, non-transpiring surfaces (e.g., asphalt, stone, metal, concrete). Under such alteration, the partitioning of incoming solar radiation into fluxes of sensible and latent heat is skewed in favor of increased sensible heat flux as evapotranspiring surfaces are reduced (Gallo and Owen 1998).
Rao (1972) was the first to demonstrate that urban areas identified from the analyses of thermal infrared data acquired by the Improved TIROS Operational Satellite (ITOS-I) Scanning Radiometer sensor with 7.4 km spatial resolution. The spatial resolution of these data is found suitable only for small-scale urban temperature mapping. The medium-high spatial resolution satellite thermal infrared (TIR) data have also been utilized to derive surface temperature (e.g. Liu and Zhang 2011; Chen et al. 2006; Weng et al. 2004; Aniello et al. 1995). The availability of land surface temperature (LST) from medium-high spatial resolution, such as Landsat, with 120~60 m spatial resolution has significantly facilitated the study of the relationship between UHI and surface biophysical parameters (Li et al. 2011). Land surface temperatures are strongly related to surface/building geometry, land use, vegetation and patterns of anthropogenic heat release. Previously, some researchers finding the relationship between land surface temperature and vegetation abundance (e.g. Gillies and
Carlson 1995; Gallo and Owen 1998; Weng et al. 2004). Bottyan et al. (2005) found the relationship between UHI and built up areas using in situ measurement. The built-up area of the city play a significant role in the development of the UHI (Chen et al. 2006).
Previous studies have been narrating many factors that influence of UHI distribution. However, every city has a unique structure and varies in each region such as in Denpasar of Indonesia. Denpasar does not have high buildings and there is quite a lot of vegetation around settlements area. The objective of this study was to quantify the entire urban heat island as a continuously varying surface. By using a surface to represent the urban heat island, it was expected that the dependence of measured heat island magnitude on spatial variations could be overcome. As the satellite sensor measures radiance, this study focussed on the surface temperature heat island, not the air temperature heat island. Landsat 5 TM and 7 ETM+ images of Denpasar on 1995 and 2003 were selected to retrieve the brightness temperatures,
emissivity (ε), and UHI areas in order to understand
impacts of urbanization on local climate in Denpasar.
METHODS
Research Location
999
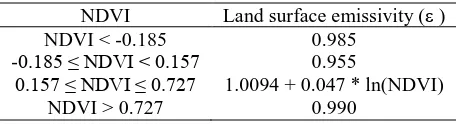
Table 1 Estimation of emissivity using NDVI
NDVI Land surface emissivity (ε )
Denpasar city population reached 649,762 people with an average growth rate of 3.34% per year (BPS 2010), this causes favourable for UHI development. Denpasar city is border by Badung Regency where located in north and west area of Denpasar, northern area is Gianyar Regency, and the east area is Badung Strait. In the southern part of Denpasar there is a small island which named as Serangan Island. Denpasar has tropical climate with monthly mean temperature around 24–32 °C and monthly mean precipitation around 13–358 mm. Settlement is dominant land use in Denpasar city in 2006, followed by the paddy field areas (As-syakur et al. 2010).
Data and Analysis
Remote sensing data used in this study is daytime Landsat 5 TM and Landsat 7 ETM+, acquisitioned on 3 February in 1995 and 21 March in 2003, respectively is in Path 116 and Row 66. Both of data used for analysis of urban heat island and built-up area percentage in Denpasar. All images bands 1–5 and 7 have a spatial resolution of 30 m, and the thermal infrared band (band 6) has a spatial resolution of 120 m for Landsat 5 TM images and 60 m for Landsat 7 ETM+ images (Chander et al. 2009). We used TIR (Thermal Infrared) bands 6 (10.3–12.4 m) to estimate land surface temperature. Visible/Near-Infrared bands 3 (0.63–0.6λ m) and 4 (0.77–0.λ0 m) used to calculate emissivity (ε) with the NDVI (Normalized Difference Vegetation Index) approach.
Digital numbers (DN) in each band of the Landsat TM and ETM+ images were converted to physical measurements of the at-sensor spectral radiance (Lsat).
Conversion of DN to absolute radiance values is a necessary procedure for comparative analysis of several images taken by different sensors (Levin 1999). Since each sensor has its own calibration parameters used in recording the DN values, the same DN values in two images taken by two different sensors may represent two different radiance values. In order to convert the DN data from Landsat TM and Landsat ETM+ into spectral radiance/DN conversion function. The gain and bias values can be found in header files of TM/ETM+ image. Hereafter, the sensor spectral radiance converted to at-satellite brightness temperature in Kelvin, T (°K), by the following equation:
(2)
where K1 and K2 are pre-launch calibration constants. K1
= 607.76 and 666.09 (mW cm-2 sr-1 m-1) for Landsat TM and ETM+, respectively; and K2 = 1260.56 K and
1282.71 K for Landsat TM and ETM+, respectively. The temperature values obtained above are referenced to a black body. Therefore, corrections for
spectral emissivity (ε) became necessary according to the
nature of land cover (Van de Griend and Owe 1993). Each of the land use/land cover categories was assigned an emissivity values. The emissivity corrected land surface temperatures in Kelvin (Trad, °K) were finally computed as follows (Artis and Carnahan 1982):
(3) using NDVI in conjunction with proportional vegetation cover. NDVI computed from image data using the following formula (Tucker, 1979):
(4)
When NDVI values range from 0.157 to 0.727, Van De Griend and Owe (1993) gave an effective equation as follows:
(5)
For the area that the NDVI value is out of the range (0.157–0.727), it is using the emissivity values recommended by Zhang et al. (2006) as shown in Table 1.
1000
Table 2 Descriptive statistics of land surface temperature in 1995 and 2003Statistics LST 1995 LST 2003
Mean (°C) 27.28 29.44
SD (°C) 1.41 2.09
Variance (°C) 1.99 4.37
Min (°C) 23.18 21.78
Max (°C) 31.04 36.12
Range (°C) 7.86 14.34
into three temperature types based on the standard deviation as a criterion for classifying temperatures (Smith 1986; García-Cueto et al. 2007; Zhand and Wang 2008). The thermal differences are considered normal if they are ± 1 times of standard deviation, with regard to the mean value of temperature; they are considered as cold points, that is, cold islands, if the thermal
differences are < −1 times of standard deviation, and
warm points, that is, heat islands, if the thermal differences are > +1 times of standard deviation. Finally, six graphic profiles (transects) were outlined on both image to estimated their intra-urban variation of land surface radiant temperature (see Figure 1).
RESULTS AND DISCUSSION
Results
Daytime Landsat 5 TM and Landsat 7 ETM+, acquisitioned on 3 February in 1995 (mid of wet season) and 21 March in 2003 (before the end of wet season) used here to analyse urban heat island in Depansar. Summarized characters of land surface temperatures on two dates are shown in Table 2. Land surface temperatures in 1995 ranged from 23.18 °C to 31.04 °C, with an average of 27.28 °C. In the 2003, land surface temperatures ranged from 21.78 °C to 36.12 °C, with an average of 29.44 °C. Standard deviation (SD) and variance of LST in 1995 was lower than that of LST in 2003, indicating slightly higher variation of LST in 2003.
Figure 2 and 3 shows geographical distributions of LST in Denpasar in 1995 and 2003, respectively. Areas shaded in red correspond to the sectors particularly affected by heat islands, the green tinted reflect a significant presence of vegetation and water. Very clear seen the LST in 1995 quite large increase compared to 2003. In 1995, the areas with higher surface radiant temperature were mainly located in the central urban area with a typical strip-shaped associated with the traffic road systems. Within the urban central area,
numerous sub-centers of UHI with higher surface radiant temperature were mainly located in the old and recently developed downtowns. Highest LST is marked in areas known as density built up. Vegetations were shown to significantly modify surface temperature. Paddy field areas surrounding the center of urban area lead to lowest surface radiant temperatures. Meanwhile, a holy area that is characterized by extensive vegetation cover contained in center of urban area created cool LST.
In 2003, the extent of LST increased significantly. With the growing central urban area, the extent of LST dramatically expanded from the inner cycle highway to the outer one, linking the suburban areas and the substantially growing satellite towns, which were characterized with small and obvious sub-centers with higher surface radiant temperatures. Serangan Island after reclamation in 1997, an area characterized with wide bare land area was also a key contributor to increased LST. In addition, seasonal bare land around urban area as the effect the time of paddy field that fallow period after harvest had higher surface radiant temperatures. A holy area showed no change in LST during that time.
1001
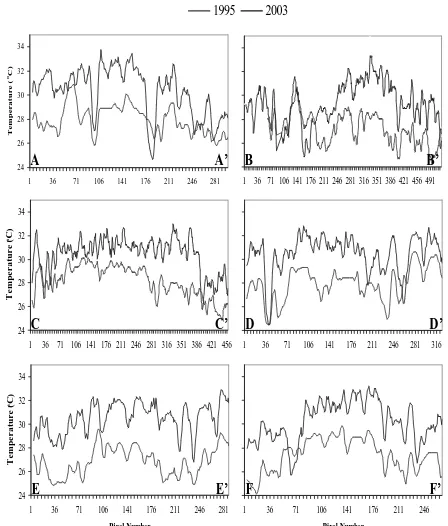
To examine the urban heat island area, a classifications of UHI based on the scheme of standard deviation threshold was done. Percentage areas of UHI classification are shown in Table 3. This table show from 1995 to 2003 the areas of the cold island decrease from 18.54% to 16.99%. The normal areas also decrease from 64.38% to 47.20%. While the heat island areas increase from 17.09% to 35.31% of the whole area.Figure 4 shows daytime LST graphics profile (transects) in 1995 and 2003 at six different places in Denpasar area extracted from line cross from figure 1. In the LST transects profile presented it is possible to
observe numerous “ridges”, “valleys”, “plateaus”, “peaks” and “basins”, indicating the heterogeneous
nature of land surface temperature over the space.
transect line donated high surface radiant temperature,
especially in center of town. The difference “ridges” and “plateaus” between 1λλ5 and 2003 due the possibility of
build up density changes or land use land cover changes.
Discussion
An investigation of urban heat island in Denpasar of Indonesia using daytime Landsat 5 TM and Landsat 7 ETM+, acquisitioned on 3 February in 1995 and 21 March in 2003 is presented here. Distributions of land surface temperature, areas of urban heat island, and transect profile of land surface temperature performed here on both satellite images.
The results clearly show the increasing of LST from 1995 to 2003. Areas of UHI also increase during the 2003 at six different places in Denpasar area extracted from line cross from figure 1.
Fig. 3 Geographical distribution of LST in Denpasar in 2003
Table 3. Percentages of UHI classifications area based on the standard deviation in 1995 and 2003
UHI Classification 1995 2003
Cold islands area (%) 18.54 16.99
Normal area (%) 64.38 47.20
1002
heterogeneous heat-cold island area. The warm LST in 2003 expanded to a wider area compared to 1995. LST intensity increases gradually in the northern parts of the city towards the centre because the built-up density grows gradually indicating significant thermal modification caused by urbanization. In general, expanded of warm LST from 1995 to 2003 causes increasing (decreasing) the heat (cold) island areas.Difference in UHI patterns is associated with many factors, including changes in land use land cover, urban surface geometry, seasonal variation, climatic and meteorological condition, etc. (Chen et al. 2006; Voogt and Oke 1998; Chow and Roth 2006; Xu and Chen, 2004). Possibility of land use land cover change is the main factors causing an increase of UHI areas in Denpasar. High urbanization process causes high population size, impact to land changes from non-urban uses to urban uses. Urban uses are one of land elements with highest thermal absorptivity and low albedo. Population size would have an effect on the number of buildings, vehicles and factories. As the sources and sinks for most of the material and energy movements and interactions between the geosphere and biosphere, changes in land use land covers will not only cause changes in physical quantities such as vegetative abundance and biomass, but also in thermal properties. Denpasar is a unique city because one of its regulations that prohibit making a building exceeds 15 meters height (4 floors). This condition caused in the development of urban areas toward the side expanse of non-urban areas (paddy field, perennial plant areas, forest, etc.).
Another important factor in the managing of the heat island is the presence of vegetation in urban areas. Vegetation abundance from urban forest or holy area in the center of city has an important role controlling the cold surface radiant temperature. Several spot of cold island areas clearly seen between heat island areas. Holy area has a temperature of 4-5 °C lower than the surrounding built-up area. In addition, paddy field and mangrove forest in surrounding of city causes low surface radiant temperature and created cold island areas. Vegetation and moisture will have a significant effect on the microclimate. Generally, vegetation helps cool urban climates through shading and evapotranspiration process. Vegetation cover controlling heat island areas measures through partitioning solar radiation into fluxes of sensible and latent heat (Wang et al. 2004). Less energy will be partitioned into the sensible heat fluxes and more into latent energy fluxes, consequently lowering the air temperature. That is to say, vegetation is one of the main contributors to the variations of spatial pattern spectral radiance and texture in LST, thus to UHI.
CONCLUSIONS
In this study, thermal infrared wavelength acquisitioned from Landsat 5 TM on 3 February in 1995 and Landsat 7 ETM+ on 21 March in 2003 have been used to extract surface radiant temperature and areas of urban heat island in Denpasar-Indonesia.
The UHI phenomenon in Denpasar area has been found in 1995 and 2003. Areas of heat island dominant occurred in central part of urban area and significantly increased and expanded from 1995 to 2003. In general, LST intensity decreases gradually from the central parts of the city towards the surrounding.
Surface radiant temperature and surface urban heat island patterns in Denpasar are characterized by urban surface bio-physical parameters. Increasely of LST and areas of urban heat island from 1995 to 2003 are may causes by land use land cover change and the existing of vegetation abundance. However, is uncertain because in this study not doing land use land covers changes analysis. It is necessary to doing further study to find out the relationship between land use land cover change and the presence of vegetation with urban heat island distribution in this city. That use several remote sensing indices are possible to found these relationships. The reason of land use land cover change may not only cause increase of land surface temperature over the entire observation period. Further studies also should be including such as influences of socio-economic conditions, seasonal variation, climatic and meteorological condition because it possibility of having an impact on surface temperature and areas of heat island.
REFERENCES
Aniello, C., Morgan, K., Busbey, A. and Newland, L. (1995). Mapping micro-urban heat islands using LANDSAT TM and a GIS. Computers & Geosciences 20:965–969.
Artis, D.A. and Carnahan, W.H. (1982). Survey of emissivity variability in thermography of urban areas. Remote Sensing of Environment 12:313–329. As-syakur, A.R., Osawa, T. and Adnyana I.W.S. (2010).
Medium Spatial Resolution Satellite Imagery to Estimate Gross Primary Production in an Urban Area. Remote Sensing 2:1496-1507.
1003
BPS. (2010). Denpasar dalam Angka 2009. IndonesianCentral Bureau of Statistics, Denpasar, Indonesia. Chander, G., Markham, B.L. and Helder, D.L. (2009).
Summary of Current Radiometric Calibration Coefficients for Landsat MSS, TM, ETM+, and EO-1 ALI Sensors. Remote Sensing of Environment 113:893–903.
Chen, X-L., Zhao, H-M., Li, P-X. and Yin, Z-Y. (2006). Remote sensing image-based analysis of the relationship between urban heat island and land use/cover changes. Remote Sensing of Environment 104:133–146.
Chow, W.T.L. and Roth, M. (2006). Temporal dynamics of the urban heat island of Singapore. International Journal of Climatology 26:2243–2260.
Gallo, K.P. and Owen, T.W. (1998). Assessment of Urban Heat Islands: A Multi-Sensor Perspective for the Dallas-Ft. Worth, USA Region. Geocarto International 13:35-41.
Gillies, R.R. and Carlson, T.N. (1995). Thermal remote sensing of surface soil water content with partial vegetation cover for incorporation into climate models. Journal of Applied Meteorology 34:745–756. García-Cueto, O.R., Jáuregui, E., Toudert, D. and Tejeda, A. (2007). Detection of the urban heat island in Mexicali, B.C., Mexico and its relationship with land use. Atmósphera 20:111-132.
Grimm, N.B., Foster, D., Groffman, P., Grove, J.M., Hopkinson, C.S., Nadelhoffer, K.J., Pataki, D.E. and Peters, D.P.C. (2008). The changing landscape: ecosystem responses to urbanization and pollution across climatic and societal gradients. Frontiers in Ecology and the Environment 6: 264–272.
Karl, T.R., Diaz, H.F. and Kukla, G. (1988). Urbanization: Its Detection and Effect in the United States Climate Record. Journal of Climate 1:1099-1123. urban heat islands: A case study of Shanghai, China. Remote Sensing of Environment 115:3249–3263. Liu, L. and Zhang, Y. (2011). Urban Heat Island
Analysis Using the Landsat TM Data and ASTER Data: A Case Study in Hong Kong. Remote Sensing 3:1535-1552.
Lo, C.P. and Quattrochi, D.A. (2003). Land-Use and Land-Cover Change, Urban Heat Island Phenomenon, and Health Implications: A Remote Sensing
Approach. Photogrammetric Engineering and Remote Sensing 69:1053–1063.
Memon, R.A., Leung, D.Y.C. and Chunho, L. (2008). A review on the generation, determination and mitigation of Urban Heat Island. Journal of Environmental Sciences 20:120–128
Roth, M. (2007). Review of urban climate research in (sub)tropical regions. International Journal of Climatology 27:1859–1873.
Smith R.M. (1986). Comparing traditional methods for selecting class intervals on choropleth maps. Professional Geographer 38:62-67.
Streutker, D.R. (2002). A remote sensing study of the urban heat island of Houston, Texas. International Journal of Remote Sensing 23:2595-2608.
Tucker, C.J. (1979). Red and photographic infrared linear combinations for monitoring vegetation. Remote Sensing of Environment 8:127-150.
Valor, E. and Caselles, V. (1996). Mapping land surface emissivity from NDVI: Application to European, African and South American areas. Remote Sensing of Environment 57:167−184.
Van de Griend, A.A. and Owe, M. (1993). On the relationship between thermal emissivity and the normalized difference vegetation index for natural surfaces. International Journal of Remote Sensing
14μ111λ−1131.
Voogt, J.A. (2003). Urban Heat Island. In I. Douglas (Ed.), Encyclopedia of Global Environmental Change Volume 3: Causes and Consequences of Global Environmental Change. John Wiley & Sons. Chichester, UK:660-666.
Voogt, J.A. and Oke T.R. (1997). Complete urban surface temperatures. Journal of Applied Meteorology 36:1117–1132.
Voogt, J.A. and Oke, T.R. (1998). Effects of urban surface geometry on remotely-sensed surface temperature. International Journal of Remote Sensing 19:895-920.
Voogt, J.A. and Oke, T.R. (2003). Thermal remote sensing of urban climates. Remote Sensing of Environment 86:370–384.
Weng, Q., Lu, D. and Schubring, J. (2004). Estimation of land surface temperature–vegetation abundance relationship for urban heat island studies. Remote Sensing of Environment 89:467–483.
Xu, H-Q. and Chen, B-Q. (2004). Remote sensing of the urban heat island and its changes in Xiamen City of SE China. Journal Of Environmental Sciences 16:276-281.
1004
of Landsat TM/ETM+ band6. Computers and Geosciences 32:1796-1805.Zhang, J. and Wang, Y. (2008). Study of the