THE USE of COMIC STRIPS in
IMPROVING STUDENTS’
READING COMPREHENSION of NARRATIVE TEXTS
(A Quasi-Experimental Research in Eight Grade Students of a Junior High School in Bandung)
A RESEARCH PAPER
Submitted to English Department of FPBS UPI Bandung as a Partial Fulfillment of the Requirements for Sarjana Pendidikan Degree
By:
RANGGA DARMAWAN
0608972
DEPARTEMENT OF ENGLISH EDUCATION
FACULTY OF LANGUAGE AND ART EDUCATION
INDONESIA UNIVERSITY OF EDUCATION
The Use of Comic Strips in Improving
Stude ts’ Readi g Co prehe sio of
Narrative Texts
Oleh
Rangga Darmawan
Sebuah skripsi yang diajukan untuk memenuhi salah satu syarat memperoleh gelar Sarjana pada Fakultas Pendidikan Bahasa dan Seni
© Rangga Darmawan 2013
Universitas Pendidikan Indonesia
Desember 2013
Hak Cipta dilindungi undang-undang.
PAGE OF APPROVAL
The Use of Comic Strips in Improving Students’ Reading Comprehension of
Narrative Texts
(A Quasi-Experimental Research in Eight Grade Students of a Junior High School in Bandung)
By
Rangga Darmawan 0608972
Approved by
First Supervisor Second Supervisor
Dr. Wachyu Sundayana, M.A. Budi Hermawan, S.Pd., M.PC. NIP. 1958020819860110011 NIP. 197308072002121002
Head of English Education Department
ABSTRACT
The study aims to investigate the use of comic strips in improving students’ reading comprehension of narrative texts and to investigate the students' responses toward the use of those comic strips.
Analysis of the study revealed that by using comics in the classroom was because of their visual appeal, efficiency, and power of message (Fay, 2009). Moreover, it discovered that reading comprehension, in its most obvious sense, was the ability to understand information in a text and interpret it appropriately (Grabe and Stoller, 2002, p. 17). Besides that, on journal whether the effect of comic strip using on reading comprehension of EFL students (Merc, 2013). This journal found that using comic strips improve high proficient students significantly.
And to achieve these aims, quasi-experimental research design was employed. The data were gathered from eighth grade students in a junior high school in Bandung. Two classes contained 60 students were taken and divided into experimental and control group. Some instruments like pre-test - post-test and questionnaire were employed to collect the data.
ABSTRAK
Pembelajaran ini ditujukan untuk menginvestigasi penggunaan potongan komik dalam meningkatkan pemahaman membaca siswa dalam teks naratif dan untuk menginvestigasi tanggapan siswa terhadap penggunaan potongan komik tersebut.
Analisis pembelajaran terungkap bahwa penggunaan komik di ruangan kelas karena pertimbangan visual, effisien, dan kekuatan pesan ( Fay, 2009). Lebih jauh lagi, menjelajahi pemahaman membaca adalah kemampuan untuk memahami informasi dalam text dan menterjemahkan sewajarnya ( Grabe and Stoller, 2002, p.17). Disamping itu, dalam jurnal efek potongan komik yang digunakan di pemahaman membaca dari siswa EFL (merc, 2013) ditemukan bahwa menggunakan potongan komik menjadikan tingginya kecerdasan siswa.
Dan untuk mencapai tujuan penelitian ini, model penelitian quasi-experimental dipergunakan. Data dikumpulkan dari siswa SMP kelas 8 di Bandung. Mengambil dua kelas yang masing - masing terdiri dari 60 siswa dan terbagi ke dalam kelompok eksperimen dan control (biasa). Beberapa alat seperti pre-test, post-test dan questionnaire digunakan untuk mengkoleksi data.
TABLE OF CONTENTS
Approval... i
Statement of Authorization... ii
Preface... iii
Acknowledgement... iv
Abstract... ... vi
Table of Contents... vii
List of Figures... xi
List of Table... xii
CHAPTER I: INTRODUCTION... 1
1.1 Background... 1
1.2 The Scope of the Research... 3
1.3 Research Questions... 3
1.4 The Aim of The Research... 3
1.5 Research Methodology... 3
1.6 Clarification of Term... 5
1.7 Organization of the Paper... 6
CHAPTER II: THEORETICAL FOUNDATION 2.1 Reading Theory... 8
Rangga Darmawan, 2013
2.3 General Concept of Narrative Text... 16
2.3.1 Definition of Narrative Text... 16
2.3.2 General Structure of Narrative Text... 18
2.4 Previous Studies... 20
CHAPTER III: RESEARCH METHODOLOGY... 3.1 Research Design... 22
3.2 Population and Sample... 24
3.3 Data Collection... 24
3.3.1 Research Instrument... 24
3.3.1.1 Pre-test... 25
3.3.1.2 Post-test... 25
3.3.1.3 Questionnaire and Interview... 25
3.4 Research Procedures... 26
3.4.1 Preparation... 27
3.4.2 Instrument Try Out... 27
3.4.3 Pre-Test... 27
3.4.4 Treatment... 27
3.4.5 Post-Test... 28
3.4.6 Interview and Questionnaire... 28
3.5 Data Analysis... 29
3.5.1 Scoring... 29
3.5.2.1 Validity... 30
3.5.2.2 Reliability... 32
3.5.2.3 Difficulty Index... 33
3.5.2.4 Discrimination Index... 33
3.5.3 Data Analyses on Pre-test and Post-test... 35
3.5.3.1 Testing The Normal Distribution... 36
3.5.3.2 The Variance Homogeneity... 37
3.5.3.3 t-test Computation... 37
3.5.3.3.1 The Independent t-test on pre-test... 38
3.5.3.3.2 The Independent t-test on post-test... 39
3.5.3.3.3 Dependent t-test... 40
3.5.3.4 Calculation of the effect size... 42
3.5.4 Data analysis on Interview and Observation... 42
CHAPTER IV: FINDING AND DISCUSSION 4.1 Findings………... 43
4.1.1 Pre-test Score...………. 43
4.1.1.1 Normality of Distribution Test... 44
4.1.1.2 The Homogeneity of Variance Test... 45
4.1.1.3 The Independent t-test ………... 46
4.1.2 Post-test Score……… 47
4.1.2.1 Normality of Distribution Test………... 47
Rangga Darmawan, 2013
4.1.2.3 The Independent t-test... 49
4.1.3 Experimental Group Score………...………. 51
4.1.3.1 The Dependent t-test... 51
4.1.3.2 Calculation of the Effect Size... 52
4.1.4 Control Group Score... 53
4.1.4.1 Dependent t-test... 53
4.1.4.2 Calculation of the Effect Size... 54
4.1.5 Result of Questionnaire... 55
4.1.6 Result of Interview... 56
4.2 Discussion... 57
CHAPTER V: CONCLUSIONS AND SUGGESTIONS... 60
5.1 Conclusion... 61
5.2 Suggestion... 63
REFERENCES... 65
APPENDICES
LIST OF TABLES
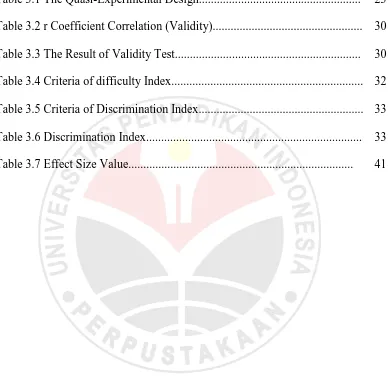
Table 3.1 The Quasi-Experimental Design... 23
Table 3.2 r Coefficient Correlation (Validity)... 30
Table 3.3 The Result of Validity Test... 30
Table 3.4 Criteria of difficulty Index... 32
Table 3.5 Criteria of Discrimination Index... 33
Table 3.6 Discrimination Index... 33
Rangga Darmawan, 2013
CHAPTER I INTRODUCTION
This chapter provides a general outline of this study. It covers background
of the study, scope of the study, statement of problems, aims of the study, research
method, data collection, data analysis, clarification of terms, and also
organizations of the paper.
1.1 Background of the study
In studying English, learners are supposed to master the four language
skills; listening, speaking, reading, and writing. However, in relation to getting
information from texts, reading maybe more important than other skills.
According to Smith (1999) reading is the ability to draw meaning from the printed
page and interpret this information appropriately.
In the context of Indonesia, students are expected to read many types of
text, including narrative text. Narrative is a text that tells a story written in order
to gain readers’ interest by entertaining them. According to Gabriel (2000), story
can be seen as particular types of narrative. To help students able to comprehend
narrative text, teacher should act as the facilitator. Nevertheless, a lot of teachers
often teach without paying attention to students’ comprehension strategies.
Reading activities in classroom are only often about asking students to read a text
create interesting situation in reading class is by using picture, game, song, poster
and also comic strips.
A comic strip is a series of pictures inside boxes that tell a story.
According to Eisner (1985:5), Comics are “the arrangement of pictures or images
and words to narrate a story or dramatize an idea”. McCloud (1993:9) pointed out
that comics are “juxtaposed pictorial and other images in deliberate sequences,
intended to convey information and/or produce an aesthetic response in the
viewer”. It can be concluded that comics are a combination of text and picture to
tell a story or information.
Studies investigating by Liu (2004) states that on their journal whether the
use of comic strips significantly improves the performance of low-level students
but had little impact on the performance of high-level participants. This study
suggests that the reading comprehension of the low-level students greatly
facilitated when the comic strip repeat the information present in the text. Another
study investigating by Merc (2013) states that the effect of comic strip using on
reading comprehension of EFL students. These studies find that high proficient
students significantly better than low proficient students.
In the context of Indonesia, studies on the use of comics have focused on
writing skill. Studies investigating by Purwanitasari (2010) found that the effect of
using comic strips to improve the ability of students of junior high school in
Malang in writing recount text, another study investigating by Karunia (2011)
Rangga Darmawan, 2013
the writer expects that using comic strips give more contribution to the
development of teaching reading.
The present study investigates whether or not the use of comic strips is
effective in teaching reading comprehension of narrative texts in junior high
school and to find out students’ responses toward the use of comic strips in
improving students’ reading comprehension of narrative texts.
1.2 Scope of the study
The study will only focus on investigating whether or not the use of comic
strips is effective to improve students’ reading comprehension of narrative texts
and to find out students’ responses toward the use of comic strips in improving
students’ reading comprehension of narrative texts.
1.3. Statement of the problem
The study is conducted to answer the following questions:
1. Can the use of comic strip in teaching reading improve students’ reading
comprehension of narrative texts?
2. What are students’ responses toward the use of comic strips in improving
reading comprehension of narrative texts?
1.4 Aims of the study
The study is aimed to see if the use of comic strips is effective to improve
toward comic strips in improving students’ reading comprehension of narrative
texts on junior high school.
1.5 Research methodology
1.5.1 Research Design
This study is quantitative in nature. It uses quasi experimental design.
Hatch & Farhady (1982: p. 24) state that quasi experimental design is practical
compromises between true experimentation and the nature of human language
behaviour which we wish to investigate. Best (1989) states that this design is used
to test the hypothesis by acquiring valid conclusion of the relationship between
independent variable and dependent variable.
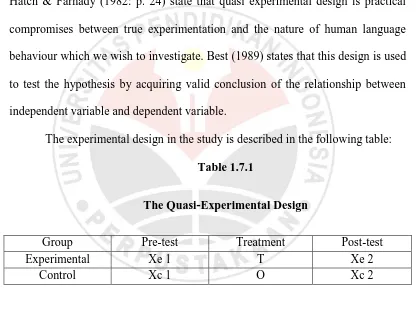
The experimental design in the study is described in the following table:
Table 1.7.1
The Quasi-Experimental Design
Group Pre-test Treatment Post-test
Experimental Xe 1 T Xe 2
Control Xc 1 O Xc 2
Xe 1 : Students’ reading scores of experimental group on pre-test
Xc 1 : Students’ reading scores of control group on pre-test
T : Comic strips treatment
O : Non- Comic strips treatment
Xe 2 : Students’ reading scores of experimental group on post-test
Rangga Darmawan, 2013
1.5.2 Data collection procedure
The data were collected from pre test and post test administered to
students. The purpose of the test is to measure the students’ comprehension in
reading. Pre-test was administered in the beginning, and post-test was held at the
end of the treatment. The value of its validity and reability is required before
applying the instrument to experimental and control group. In addition, an
observation and interview were conducted at the end of the study to find out the
use of comic strips improve students’ reading comprehension of narrative texts.
1.5.3 Data analysis
In analyzing the data, several statistical processes are involved in this
study. The first step is analyzing the validity, reliability, difficulty index, and
discrimination index of the instrument. The next step is by using the statistical
formula t-test to analyze the experimental and control groups’ scores in pre-test
and post-test in order to find out whether there is significant improvement in
students’ scores or not. In addition, to find out the result of students’ responses
toward the use of comic strips in the learning process, the percentage scale
formula by Riduwan (2009) is administered to calculate the percentages of
students’ responses. Then, in interpreting the results, response percentage
1.6 Clarification of terms
1. Effectiveness
Effectiveness is measured based on t-test, which determines whether there
is significant difference between the means.
2. Reading
Reading is the process of constructing meaning from written texts.
3. Reading Comprehension
Reading comprehension is defined as the level of understanding of a
writing text. In this case reading comprehension allows them to understand
what text being written.
4. Comic Strips
Comic strips are juxtaposed pictorial and other images in deliberate
sequence intended to convey information and or to produce an aesthetic
response in the viewer (Mcloud 1993:9)
5. Experimental research
Experimental research is the study of testing or finding out whether or not
two variables have a cause effect relationship. In the research, the
Rangga Darmawan, 2013
of two method is called experimental group and another one which in
contrary is called control group.
6. Narrative
Narrative is telling a story. Its social function is to entertain or amuse the
readers. (Sadler and Hayllar 2000),
1.7 Organizations of the paper
The paper will be presented into five chapters. The chapter will be
subdivided into subtopics that will elaborate the issue given.
Chapter 1 is Introduction. It comprises background of the study, scope of
the study, statement of problems, aims of the study, research method, data
collection, data analysis, clarification of terms, and also organizations of
the paper.
Chapter 2 is Theoritical Foundation presents the theoretical foundation on
the issue that is relevant to the present study.
Chapter 3 is Research Methodology. It comprises method of research, the
data collection, and data analysis.
Chapter IV is Findings and Discussion presents the result of data
collection, data presentation, explanation the result of data analysis.
Chapter V is Conclusions and Suggestions which draw conclusion from
CHAPTER III
RESEARCH METHODOLOGY
This chapter elaborates the methodology applied in the study. The
discussion of this chapter includes research design, population and sample of the
research, data collection, research procedures, and data analysis.
3.1 Research Design
This study uses quasi-experimental design. Jackson (2009, p.318) states
that it was taken because the participants of this study were not chosen randomly,
but they were already part of the groups In this case, the groups were class VIII-A
and VIII-B. Furthermore, this study provided pre-test - post-test to both
experimental and control group.
According to (Hatch and Farhady 1982:21) two classes were taken as the
sample classes; those were labeled as the experimental group and control group.
The first group (e1) as the experimental group was given a pre-test (X1), treated
by using comic strip (T), and then provided a post-test (X2). The second group
(c1) as the control group was given a pre-test (X1), treated by using conventional
Rangga Darmawan, 2013
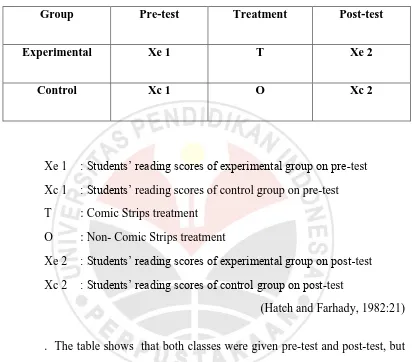
Table 3.1
The Quasi-Experimental Design
Group Pre-test Treatment Post-test
Experimental Xe 1 T Xe 2
Control Xc 1 O Xc 2
Xe 1 : Students’ reading scores of experimental group on pre-test
Xc 1 : Students’ reading scores of control group on pre-test
T : Comic Strips treatment
O : Non- Comic Strips treatment
Xe 2 : Students’ reading scores of experimental group on post-test
Xc 2 : Students’ reading scores of control group on post-test
(Hatch and Farhady, 1982:21)
. The table shows that both classes were given pre-test and post-test, but
the difference is in giving treatment. In experimental group, comic strip was given
as a treatment to the students in the teaching learning process. And control group,
conventional teaching (Three-phases-steps) was given as a treatment in teaching
learning process. After treatments nave been given to experimental group, both
experimental and control group were given the post-test in order to find out the
result of using comic strip that could achieve a higher score than conventional
3.2 Population and Sample
The population of this study was all students of second grade in one junior
high school in Bandung; consist of 60 students of second grade. To determine the
sample of this study, the sampling technique used was purposive sampling.
Purposive sampling is a sampling technique with particular consideration
(Sugiyono, 2010: 85). This study took two classes as the sample of the study.
They were class VIII-A and VIII-B. However, only 30 students from each class
were taken to be the sample of this study. The first 30 students from class VIII-A
participated as experimental group and other 30 students taken from class VIII-B
participated as control group. The focus of this study was on improving students’
reading comprehension of narrative texts. Based on that condition, the chosen
subjects were eighth-grade students as they were studied.
3.3 Data Collection 3.3.1 Research Instrument
In this study, pre-test and observation were to gain the information about
the prior reading proficiency of the students from both groups. Then a post-test,
interview and a set of questionnaire were distributed to obtain more information
about the way comic strip in improving students’ reading comprehension. The
entire study instrument used to investigate the effectiveness of comic strips in
Rangga Darmawan, 2013
3.3.1.1Pre-test
Pre-test was given to both experimental and control group in the
beginning. It was aimed to find out the initial differences between experimental
and control groups as they have similar level in reading skill before receiving the
treatment.
3.3.1.2Post-test
A post-test was conducted to find out the students’ progress in reading
comprehension. The post-test procedure was similar to the pre-test procedure. The
post-test was held in both control and experimental classes.
3.3.1.3Questionnaire
Questionnaire was given only to the experimental group who has
experienced the treatment of the use of comic strips during their learning process.
The questionnaire given was aimed to find out the way of using comic strips in
improving students’ reading comprehension of narrative texts in their teaching
learning process. The questionnaire consisted of 10 closed-ended questions.
According to Beins (2012:264) Closed-ended question is a question that contains
a set of answer that a respondent chooses.
3.3.1.4Interview
Interview is a technique of verbal communication. It is a communication
for getting the information. According to Knupfer and McLellan (cited in Grace,
more in-depth information. Interview was given only to the experimental group
who has experienced the treatment. The interview in this study is addressed to
find out the use of comic strips in improving students’ reading comprehension of
narrative texts.
3.4 Research Procedures 3.4.1 Preparation
This study was planned for eight meetings. The first meeting was used to
conduct a tryout of the instruments of this study. The next meeting was used to
conduct the pre-test and the third to seventh meetings were allocated to implement
the lesson in the classroom. The post-test and interview were administered in the
rest two meetings.
A preparation in doing the research in this study involved designing lesson
plan and preparing materials. There were four lesson plans design to be
implemented in the treatment of the use of comic strip for experimental group.
The lesson plans were designed based on 2006 English School-Based Curriculum
for eighth grade students. The four lesson plans were all based on the standard
competence and competence of descriptive text learning. In addition, for the
control group, the lesson plans were designed similar to the experimental one. The
differences were on the learning media and materials used.
Learning materials in teaching learning process of the experimental group
included narrative texts, comic strips handout and the limited authentic materials
Rangga Darmawan, 2013
learning materials used in the teaching learning process in the control group
included narrative texts and handout that were related to the topic.
3.4.2 Instrument of Try Out
In the very beginning, the instrument test was administered to students
outside the experimental and control group in order to measure the validity,
reliability, difficulty level, and discrimination level of the instruments employed.
The try out was administered in another class which was not involved during the
research process
3.4.3 Pre-test
Pre-test was administered to both experimental and control group in the
first meeting. It was aimed to find out the initial ability of students’ reading
comprehension of narrative texts. 60 students from the experimental and control
group took the test.
3.4.4 Treatment
The treatment program was done in four meetings in the experimental
group. The use of comic strips in improving students’ reading comprehension of
narrative texts was provided as the treatment to the experimental group. It was
aimed to improve students’ reading comprehension. The treatment program in the
control group was done in four meetings. Four meetings in the control group
showed the same pattern of teaching.
Post-test was administered to 60 students of both experimental and control
group in the last two meetings. It was held at the end of treatment, because it was
aimed to find out the students’ progress in term of their reading comprehension
after getting the treatment. In other word, the post-test could be the data to help
this study in finding out whether there are any differences between the
experimental group who was treated with the use of comic strips and the control
group who was treated with the text alone.
3.4.6 Questionnaire
In the last meeting from the whole eight meetings, the chance was used to
administer the questionnaire to students. The questionnaire discussed about
reading comprehension and the use of comic strips in the teaching learning
process. So, the questionnaire was administered to the experimental group only
who had experienced the treatment of the use of comic strips in their learning
process.
3.4.7 Interview
In the last meeting, the interview was administered to find out the
advantages and disadvantages about using comic strips in improving students’
reading comprehension of narrative texts.
3.5 Data Analysis
The data analysis included the scoring technique, data analysis on
instrument tryout, data analysis on pre-test and post-test results, and data analysis
Rangga Darmawan, 2013
3.5.1 Scoring on instruments try out, pre-test and post-test
According to Arikunto (2003) there are two types of formulas that can be
used in the process of scoring and data. They are punishment and formula with no
punishment. This study used the formula with no punishment.
S = R
Where: S = Score
R = Right Answer
(Arikunto, 2003)
3.5.2 Data Analysis on Instrument Try Out
The aim of analyzing the instrument of try out was to investigate its
validity, reliability, difficulty level, and discrimination level. It was uses since
good instrument test was required to measure the proficiency level of English
language learners.
3.5.2.1 Validity
To find out the validity of instrument items, this study conducted Pearson’
Product Moment Correlation. The calculation process used SPSS v.17.0.
Correlation technique is one of the techniques that are mostly used by researchers
133). Therefore, the process of calculation follows SPSS 17.00 for windows. The
criteria of validity were shown in the table 3.6.2.1:
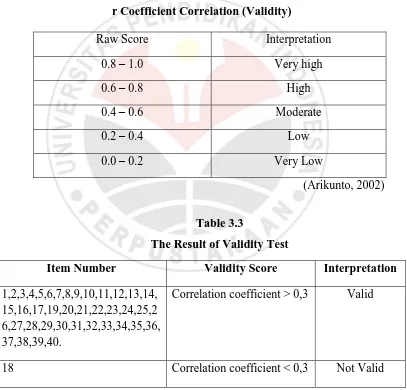
Table 3.2
r Coefficient Correlation (Validity)
Raw Score Interpretation
0.8 – 1.0 Very high
0.6 – 0.8 High
0.4 – 0.6 Moderate
0.2 – 0.4 Low
0.0 – 0.2 Very Low
(Arikunto, 2002)
Table 3.3
The Result of Validity Test
Item Number Validity Score Interpretation
1,2,3,4,5,6,7,8,9,10,11,12,13,14, 15,16,17,19,20,21,22,23,24,25,2 6,27,28,29,30,31,32,33,34,35,36, 37,38,39,40.
Correlation coefficient > 0,3 Valid
Rangga Darmawan, 2013
Based on the table above, 39 items were valid and 1 item was stated not
valid. The valid items could be used as research instrument. So, the total items
that could be used as the instrument in this study were 39 items.
3.5.2.2 Reliability
According to Arikunto (2003: 86) a good instrument is instruments which
consistently can give data that matched with the reality Therefore, a reliability test
was required to find out whether the instrument test of this study could provide
consistent result of the data or not.
To find out the reliability of the instrument test, this study uses two kinds
of method. This study has two kinds of questions type. It was objective and
subjective questions (essay). To test the reliability of subjective questions (essay)
could not use the same way as objective questions in reliability test (Arikunto,
2003: 109). Therefore, Spearman-Brown formula was used to test the reliability of
objective questions, number 1 to 20 and Cronbach’s Alpha was used for
subjective questions from number 21 to 40. In calculating the data, SPSS v.17.0
was used in this study. Furthermore, in interpreting the result, the criteria of
correlation coefficient interpretation by Sugiyono (2010) was used in this study.
The result of reliability test for objective questions by conducting
Spearman-Brown formula in SPSS v.17.0 showed that the instrument has
moderate level of reliability. The score was at 0,532. While, the result of
showed that the instrument had very high level of reliability. The score was at
0,967.
3.5.2.3 Difficulty Index
In order to give an appropriate and acceptable test for students, analyzing
the level of difficulty test items was required to be done in this study. The
computation of difficulty index test on instrument try out employed Anates v.4. In
interpreting the result, the criteria of difficulty index interpretation by Arikunto
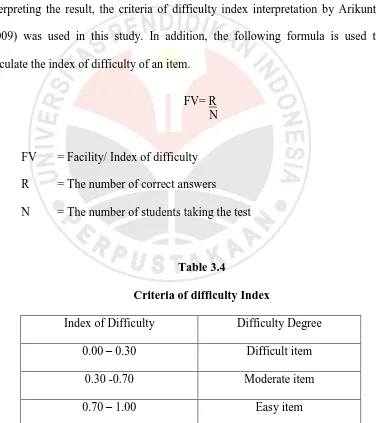
(2009) was used in this study. In addition, the following formula is used to
calculate the index of difficulty of an item.
FV= R N
FV = Facility/ Index of difficulty
R = The number of correct answers
N = The number of students taking the test
Table 3.4
Criteria of difficulty Index
Index of Difficulty Difficulty Degree
0.00 – 0.30 Difficult item
0.30 -0.70 Moderate item
0.70 – 1.00 Easy item
Rangga Darmawan, 2013
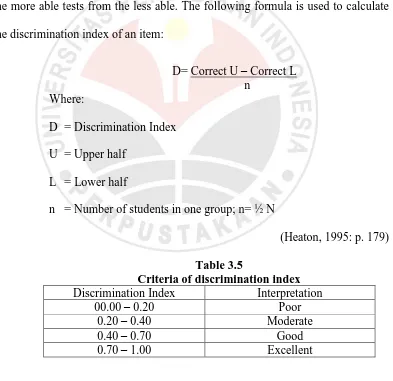
The discrimination index was used to measure the extent of which items
that differentiate the students who gained higher scores and those who gained
lower scores. To find out the discrimination index of the instrument in this study,
Anates v.4 was used to calculate it. Furthermore, in interpreting the result, the
criteria of discrimination index interpretation by Arikunto (2009) was used in this
study. Heaton (1995: p. 179) states that the discrimination index of an item
indicates the extent to which the item distinguishes between the tests, separating
the more able tests from the less able. The following formula is used to calculate
the discrimination index of an item:
The Result of Discrimination Index Test
Item Number Raw Score Interpretation
- 0.00 < D 0.20 Poor
5,7,12,13,14,15,16. 0.20 < D 0.40 Moderate
1,3,4,9,19,20 0.40 < D 0.70 Good
2,6,8,10,11,17,21,22,23,24,25,26,27,28,29,
30,31,32,33,34,35,36,37,38,39,40.
0.70 < D 1.00 Excellent
Based on the table above, there was no item that was marked “poor”.
While, 7 items were marked “moderate” in discrimination index test, 6 items were
stated “good” in discrimination index test, and 26 items were stated “excellent” in
discrimination index test. In sum, the most items on the instrument of this study
were stated “excellent” in discrimination index based on the criteria of Arikunto
(2009).
3.5.3 Data Analysis on Pre-test and Post-test
In order to find out whether there was significant different between the
experimental and control group, the data of pre-test – post-test from both groups
have to be analyzed. The analyzing processes in this study intended to use t-test
formula. However, before performing the t-test formula, the data were ensured to
meet the conditions required. The requirements of using t-test are as follow: the
data are interval-ratio scale, the underlying distributions are bell-shaped (normally
distributed), the observations are independent, and the variance of the two groups
Rangga Darmawan, 2013
using dependent t-test were actually similar to the independent t-test, except the
requirement that the observations are independent. The assumption for dependent
t-test was the observations were not independent, but the observations were
correlated or dependent (Jackson, 2009: 239).
3.5.3.1 Normality Distribution Test
In the aim to find out if the data were normally distributed, Kolmogrov - Smirnov’s formula in SPSS v.17.0 was used. In addition, the hypotheses to test
are as follow:
Hypothesis in experimental group:
Ho = The scores of experimental group are normally distributed.
H1 = The scores of experimental group are not normally distributed.
Hypothesis in control group:
Ho = The scores of control group are normally distributed.
H1 = The scores of control group are not normally distributed.
The interpretation of the result was based on the level of significant 0,05.
If the result is higher than 0,05, then H0 is not rejected or in the other word that
the data are normally distributed. Whereas, if the result is lower than 0,05, H0 is
rejected (Priyatno, 2010: 71).
The next step to meet the requirement of using t-test formula was to find
out whether the data were homogenous or not. Levene’s test in SPSS v.17.0 was
used to find it out. In addition, the hypothesis to test is as follow:
Ho = The scores of both experimental and control group are homogenous.
H1 = The scores of both experimental and control group are not homogenous.
The interpretation of the result to find out whether the data were
homogenous or not were based on the level of significant 0,05. If the result is
higher than significant level 0,05, then H0 is not rejected. Meanwhile, if the result
is lower than 0,05, then H0 is rejected or in the other word that the data are not
homogenous (Priyatno, 2010: 76).
3.5.3.3 t-test Computation
This study uses some statistical process of t-test to analyze the data, such
as: independent t-test for pre-test, independent t-test for post-test, dependent t-test
for experimental group, and dependent t-test for control group. This t-test is a
parametric inferential statistical test of the null hypothesis (Jackson, 2009: 184).
In addition, null hypothesis or H0 is the hypothesis that predicting no difference
exists between the groups being compared (Jackson, 2009: 166).
3.5.3.3.1 Independent t-test Computation on Pre-test
Independent t-test uses to calculate the data from pre-test of both
experimental and control group. In detail, the independent t-test was used to
Rangga Darmawan, 2013
Independent t-test is a parametric statistical test that compares the means of two
different samples of participants (Jackson, 2009: 227). It was aimed to find out
whether there was significant different or not between both groups’ initial ability
before the groups were given the treatments.
In this study, the independent t-test was analyzed by using SPSS v.17.0.
The significance level used in independent t-test was 0,05 (two-tailed test of
significance). In addition, the hypothesis to test is as follow:
Ho = There is no significant different between the means of pre-test scores of both
experimental and control group.
Ha = There is significant different between the means of pre-test scores of both
experimental and control group.
The testing criterions are as follow:
Ho is not rejected if -tcrit -tobt or tcrit tobt
Ho is rejected if -tobt < -tcrit or tobt > tcrit
And
Ho is not rejected if significant > 0,05
Ho is rejected if significant < 0,05
(Priyatno, 2010: 36)
3.5.3.3.2 Independent t-test Computation on Post-test
The use of independent t-test in test was to compare means of
whether there was significant difference or not between both groups’ ability after
the groups experienced the treatments in their learning process.
As in the pre-test analysis, SPSS v.17.0 was also used this computation to
analyze the independent t-test. The significance level used was at 0,05 (two-tailed
test of significance). The hypothesis to test is as follow:
H0 = There is no significant different between the means of post-test scores of
both experimental and control group.
Ha = There is significant different between the means of post-test scores of both
experimental and control group.
The testing criterions are as follow:
Ho is not rejected if -tcrit -tobt or tcrit tobt
Ho is rejected if -tobt < -tcrit or tobt > tcrit
And
Ho is not rejected if significant > 0,05
Ho is rejected if significant < 0,05
(Priyatno, 2010: 36)
3.5.3.3.3 Dependent t-test
The dependent t-test was used to find out whether there was significance
different or not between pre-test and post-test. Dependent t-test is a parametric
statistical test that compares the means of two related (within or
Rangga Darmawan, 2013
3.5.3.3.3.1 Dependent t-test on the Experimental Group Score
The dependent t-test on the experimental group was used to find out
whether there was significance different or not between pre-test and post-test after
the group had experienced the treatment of the use of comic strip in this study.
The dependent t-test computation used SPSS v.17.0 in calculated the data.
The significance level used was at 0,05 (two-tailed test of significance). In
addition, the hypothesis to test is as follow:
Ho = There is no significant different between pre-test and post-test after
treatment.
Ha = There is significant different between pre-test and post-test after treatment.
The testing criterions are as follow:
Ho is not rejected if -tcrit -tobt or tcrit tobt
Ho is rejected if -tobt < -tcrit or tobt > tcrit and,
Ho is not rejected if significant > 0,05
Ho is rejected if significant < 0,05
(Priyatno, 2010: 41)
3.5.3.3.3.2 Dependent t-test on the Control Group Score
The dependent t-test on the control group was used to find out whether
there was significance difference or not between pre-test and post-test after the
group had experienced the treatment of the use of text alone in this study.
As in the experimental group, the dependent t-test computation on control
used was at 0,05 (two-tailed test of significance). Moreover, the hypothesis to test
is as follow:
Ho=There is no significant different between pre-test and post-test after treatment.
Ha =There is significant different between pre-test and post-test after treatment.
The testing criterions are as follow:
Ho is not rejected if -tcrit -tobt or tcrit tobt
Ho is rejected if -tobt < -tcrit or tobt > tcrit And
Ho is not rejected if significant > 0,05
Ho is rejected if significant < 0,05
(Priyatno, 2010: 41)
3.5.3.4 Calculation of the Effect Size
In order to measure how well the treatment worked in this study,
calculation of the effect size was employed. In order to determine the effect size in
the independent t-test, a correlation coefficient of effect size can be derived as
presented below:
Where:
r= effect size
t= tobt or t value from the calculation of independent t-test
Rangga Darmawan, 2013
(From Rosenthal, 1991, p.19)
After obtaining the value of r, the score was matched with the following
scale to interpret the effect size. According to Coolidge (2000) the effect size has
positive correlation to its value, the larger effect size value, the larger impact of
treatment
Table 3.7 Effect size value
Effect size r value
Small 0.100
Medium 0. 243
Large 0.371
(Coolidge, 2000; p 151)
3.5.3.4.1 Calculation of the Effect Size on the Dependent t-test
Jackson (2009: 238) states that the computation of effect size should be
conducted for the dependent t-test Cohen’s d formula was used to calculate the
effect size on dependent t-test. The Cohen’s d formula for dependent t-test is as
Where: = The mean of the difference scores
= The standard deviation of the difference scores
(Jackson, 2009: 238)
In interpreting the result, the criteria of effect size by Cohen (1992) was
adopted. The criteria are as follow: a small effect size is one of at least 0,20, a
medium effect size is at least 0,50, and a large effect size is at least 0,80 (Cohen,
1992 cited in Jackson, 2009: 238).
3.5.4 Data Analysis on Questionnaire
In analyzing the students’ responses about the vocabulary learning and the
use of audio visual aids in their English learning process, the questionnaire was
analyzed by using this below percentage formula:
Where: P = Percentage
fo = Frequency observed
n = Number of sample
(Riduwan, 2009)
In interpreting the result of percentage computation above, the
classification percentage by Rahmawati (2011) was used to classify it.
Rangga Darmawan, 2013
In analyzing the data of interview, the interview data were transcribe to
obtain the information about the way of using comic strips in improving students’
reading comprehension of narrative texts. This was aimed to find out the
advantages and disadvantages of using comic strips which had been used in
CHAPTER V
CONCLUSIONS AND SUGGESTIONS
This chapter provides conclusion drawn from the entire study as well as
suggestions for further study and related parties.
5.1 Conclusions
This study is to investigating the use of comic strips in improving
students’ reading comprehension of narrative texts. Besides, it is also meant to see
the way comic strips improve students’ reading comprehension of narrative texts.
The findings of the present study showed that the use of comic strips indicated can
support reading comprehension acquisition. Besides, it was also helps the students
to do better in their understanding reading, especially in narrative texts.
Furthermore, the findings of this study indicate some factors that influence
the result of the reading teaching learning process, in this case the students’
reading comprehension. Those include positive and negative factors. To be more
specific, the positive factors lead to the students’ reading comprehension
improvement. Differently, the negative ones can resist the improvement. Those
factors are categorized into media and teacher factors.
The findings of this study indicate that the use of comic strips is effective
for the students. It could be a good media when the comic strips present most of
Rangga Darmawan, 2013
become inappropriate media for enhancing the students’ reading comprehension.
Besides, the comic strips selected should facilitate the students in comprehending
the meaning of the required words. For instance, the image, picture, or even comic
strips should be able to illustrate the meaning of those words. In addition, the
spoken text or words should be clear to hear and match with the level of the
students.
The way the teacher delivers the reading comprehension through comic
strips should be considered thoroughly. The appropriate media mentioned above
could be useless if the teacher could not organize and convey it well to the
students. When the media is not delivered well and not in attractive way, the
students will difficult getting some improvements on their reading comprehension
and easily get bored during the teaching learning process. They will tend to only
act as a viewer or listener. However, the findings of this study indicate that the
teacher should competent in organizing and delivering the comic strips materials
to the students. The teacher’s preparation is the key to be competent in organizing
and delivering the comic strips materials. It indicates that prepared teacher, could
easily delivered the learning materials well to the students in the teaching learning
process.
Moreover, when both media and teacher well support each other, the
outcome is significantly improve students’ reading comprehension. With the
appropriate comic strips prepared and delivered well by the teacher, it could be a
performances in the classroom could lead to their vocabulary improvement.
Therefore, those factors are needed to be fully concerned in the investigated of
comic strips in order to improve the students’ reading comprehension of narrative
texts successfully.
Based on those findings on interview and questionnaire, the result of the
study shows some positive responses. Therefore, most of the students were
interested, motivated, and fun in teaching learning process.
5.2 Suggestions
For teachers interested in additional reading on the topic of improving
students’ reading comprehension through the use of comic strips, this study
provides some suggestions that might be useful for them in implementing the
comic strips. The teachers are suggested to choose, develop, or may be create the
comic strips materials that are indicated could provide the comprehension of the
reading and match with the students’ level and interest in order to motivate the
students to actively contribute in the teaching learning process.
In addition, to avoid the useless implementation of the comic strips in the
classroom, the teachers need to be more careful in choosing, developing, or
creating the comic strips. The teachers not only should consider about the
students’ need and level, but the teachers also should concern about the comic
strips used to facilitate the students’ comprehension of the words meaning. It
Rangga Darmawan, 2013
students. Well collaboration of the good comic strips use and the good teachers’
performance will make the teaching learning process more meaningful.
Furthermore, for anyone who is interested to conduct a study in the same
field with this study, may better find another effective ways to implement comic
strips to the students. To create effective teaching learning process of reading
comprehension through comic strips, the further study better to interview for the
students to find out what the students are interested in before the media is
selected, developed, or created. It is intended to make the comic strips prepared
match both the students’ need and interests. Besides, they could investigate first
the reading comprehension of the students, which discover what comprehension
that the students’ already know. Because when we already know it, those comic
REFERENCES
Akhiradewi, Nopita. 2006. Pembelajaran Menulis Cerpen Dengan Menggunakan
Media Komik Pada Siswa Kelas X SMAN 7 Bandung Tahun Ajaran
2005/2006. FPBS UPI Sarjana Degree: Unpublished paper.
Arikunto. Suharsini. (2003). Prosedur Penelitian: Suatu Pendekatan Praktek
(Edisi Revisi V). Jakarta: PT, Rineka Cipta.
Beins , Bernard C. and Maureen A. McCarthy (2012). Research Methods and
Statistics. Pearson.
Best, John W. (1959). Research in Education (4th ed). Englewood Cliff, US:
Prentice Hall.
Bon L, Guy. (1994). Reading Dificulties: Their Diagnosis and Correction. USA:
allyn and Bacon Publishing co.inc
Brown, H.D. (2001). Teaching By Principles: An Interactive Approach to
Language Pedagogy, second edition. USA: Addison Wesley Longman,
Inc.
Carnine D, J. Silbert, and E.J. Kameeni (1980). Indirect Instruction Reading.
Ohio: Meril Publishing.co. p. 45
Cohen, J. (1992). A Power Primer. Psychological Bulletin, 112, 155-159.
Cohen, L. & Manion, L. (1994). Research Methods in Education, 4th Ed.,
NewYork: Routledge, p. 164.
Rangga Darmawan, 2013
Davis, Randall S. (2006). Comics: A multi-dimensional teaching aid in
integrated-skills classes. Retrieved October 2009, from http:// www.
Esl-lab.com/research/comics.htm.
Day, R. R. and J. Bamford. (2002). Top Ten Principles for Teaching Extensive
Reading. 14/2. http://nflrc.hawaii.edu/rfl/October2002/
Derewianka, B. (1990). Exploring How Text Work. Australia: Primary English
Teaching Association.
Dwyer, C. A. (1988). Examining The Symbiotic Relationship Between Verbal and
Visual Literacy in Terms of Facilitating Student Achievement. Reading
Psychology, 3(9), 365-380.
Eisner, W. (1985). Comics and Sequential Art. Tamarac: Poorhouse Press.
Fay, D. (2009). Student Storytelling Through Sequential Art. English Teaching
Forum Journal 45 number 3. Retrieved December 2009, from
http://exchanges .state.gov.
Franenkel, J. R. & Wallen, N. E. (1990). How to Design and Evaluate Research in
Education. San Fransisco State University: McGraw-Hill Inc.
Gabriel, Y. (2000), Storytelling of Organizations: Facts, Fictions, and Fantasies.
Oxford University Press.
Grabe, W. Stoller. (2002). Teaching and Researching Reading. Harlow: Pearson
Education Limited, p. 9-17.
Hadley, A. O. (2001). Teaching Language in Context (3rd ed). Boston: Heinle &
Hatch, Evelyn. and Hossein, farhady. (1982). Research design and statistic: for
Applied Linguistic. Massachusetts: Newbury house publisher inc.
http://www.wikipedia.com/comic.Retrieved on January 5, 2011. Oxford Learner’s
Pocket Dictionary, (New York: Oxford University Press, 2003) p. 80.
Harmer, Jeremy. The Practice of English Language Teaching. (Harlow:
Longman, 2002), p. 38.
Heaton, John (1995), An Empirical Investigation of Asset Pricing With
Temporally Dependent Preference Specifications, Econometrica, vol.
63.
Jackson, Sherri, L. (2008). Research Methods and Statistics: A Critical Thinking
Approach (3rd. ed.). Wardsworth.
Juwita, Fannia. (2010). The Use of Flash Card in Improving Students’ Writing
Procedural Text. Indonesia University of Education: Unpublished.
Karunia, Nur. (2011). The Effectiveness of Using Comics in Teaching Writing
Narrative Text. FPBS UPI Sarjana Degree: Unpublished paper.
Knupfer, N. N. & McLellan, H. (1996). Descriptive Research Methodologies. In
D. H. Jonassen (Ed.), Handbook of Research for Educational
Communications and Technology (pp. 1196-1212). New York:
Macmillan.
Kranzel, Gerald. and Janet, Moursund. (1991). Statistics for The Terrified; Second
Edition. New Jersey: Prentice Hall.
Liu, J. (2004). Effects Of Comic Strips On L2 Learners’ Reading Comprehension.
Rangga Darmawan, 2013
Merc, Ali (2013). The Effect of Comic Strip Use on Reading Comprehension of
EFL Students. International Journal on New Trends in Education and
their Implcations. Anadolu University.
McCloud, Scott. (1993). Understanding Comics: The Invisible Art. HarperCollins.
McGinnis, D. J., & Smith, D. E. (1982). Analysing and Tereating Reading
Problems. New York: Macmillan Publishing Co., Inc.
Meyers, A (2005). Gateways to Academic Writing: Effective Sentences,
Paragraph and Essays, (New York: Longman, Inc, 2005), p. 52.
Munby, John. (1968). Read and Think. Hongkong: Yu Luen Offset Factory Ltd.
Nunan, David. (2003). Research Methods in Language Learning. New York:
McGraw Hill.
Nurjanah, Ai Umay. (2005). Pembelajaran Menulis Karangan Narasi Dengan
Menggunakan Media Komik Sebagai Upaya Meningkatkan
Keterampilan Menulis Siswa Kelas I SMKN 12 Bandung Tahun Ajaran
2004/2005. FPBS UPI Sarjana Degree: Unpublished paper
Nurmilah, Nunung. (2010). The use of Fairy-Tale Movie in teaching narrative
text. Indonesia University of Education: Unpublished.
Pearson & Johnson. (1978). Teaching Reading Comprehension. New York:
Holk-Rineheart & Winston. p. 9.
Priyatno, Duwi (2010). Paham Analisa Statistik Data Dengan SPSS. Yogyakarta:
Purwanitasari, Lili. (2010). Using Comic Strips to Improve the Ability of Students
of SMP Negeri 2 Malang in Writing Recount Text. Faculty of Letters,
Universitas Negeri Malang: Unpublished thesis.
Rahmawati, Rahmawati. (2003). Improving students listening comprehension
through story telling technique. Indonesia University of Education:
Unpublished.
Riduwan, (2009). Skala Pengukuran Variabel – Variabel Penelitian. Bandung:
Alfabeta.
Sadler K.R., and T.A.S Hayllar. (2000) Text in Action I, an English Workbook.
Macmillan: Macmillan. p. 12.
Schwarz, G. (2006). Expanding literacies through graphic novels. English Journal,
95(6), 58-64.
Simanjuntak. (1988) Developing Reading Skill for English Foreign Language
Students, (Jakarta: Depdikbud. p. 4.
Smith, Carl B. (1999). “Story Map: Setting, plot, mood, theme”, The Reading
Teacher, Vol. 44, No 2. p 178
Sudjana, M. A. (1996). Metode statistika. Bandung: Tarsito.
Sugiono (2010). Metode Penelitian Kuantitatif, Kualitatif dan R&D. Bandung:
Alfabeta.
Tarigan, Henry Guntur. (1994). Membaca dalam Kehidupan. Bandung: Angkasa.
Rangga Darmawan, 2013
Underwood, J. (1989). Hyper Card and Interactive Video. CALICO Journal. 6(3),