Susan H. Busch is an associate professor in the Department of Health Policy and Management at Yale University. Ezra Golberstein is an assistant professor in the Division of Health Policy and Management and the Minnesota Population Center at the University of Minnesota. Ellen Meara is an associate professor in the Dartmouth Institute for Health Policy and Clinical Practice and a Faculty Research Fellow at the National Bureau of Economic Research. This work was supported by funding from the National Institutes of Health (grants R01 MH 080883, K01 DA019485, R01 DA030391, 5T32 MH0119733, and 5R24HD041023) and the Harvard Center for the Developing Child. This research benefi tted from the helpful comments and suggestions from Catherine Fullerton, Nora Gordon, Jon Skinner, Erzo Luttmer, Anthony LoSasso, several anonymous referees, and from seminar participants at Yale University, Harvard University, University of Minnesota, Dartmouth College, the University of Michigan, the University of Chicago, the NBER Health Care Meetings, the 2011 American Economic Association Meetings, and the 2012 Midwest Health Econom-ics Conference. The main NSDUH data used in this article can be obtained January 2015 through December 2017 from Ezra Golberstein, Division of Health Policy and Management, University of Minnesota School of Public Health, 420 Delaware St. SE, MMC 729, Minneapolis, MN 55455; email: egolber@umn.edu. [Submitted November 2012; accepted June 2013]
ISSN 0022- 166X E- ISSN 1548- 8004 © 2014 by the Board of Regents of the University of Wisconsin System
T H E J O U R N A L O F H U M A N R E S O U R C E S • 49 • 3
The FDA and ABCs
Unintended Consequences of Antidepressant
Warnings on Human Capital
Susan H. Busch
Ezra Golberstein
Ellen Meara
Busch, Golberstein, and MearaA B S T R A C T
Using annual cross- sectional data on over 100,000 adolescents aged 12–17, we studied academic and behavioral outcomes among those who were and were not likely affected by FDA warnings regarding the safety of antidepressants. Compared to other adolescents, adolescents with probable depression experienced a relative decline in grade point average of 0.14 points following the FDA warnings. The FDA warnings also coincided with increased delinquency, use of tobacco, and use of illicit drugs. Together, our results stress the importance of mental health and its treatment as an input into cognitive and noncognitive aspects of human capital.
I. Introduction
“noncogni-tive” aspects of human capital are equally important. Empirical evidence links varied noncognitive characteristics, ranging from measured hyperactivity, anxiety, locus of control, and self- esteem in childhood to later wages, income, and social outcomes (Blanden, Gregg, and Macmillan 2006; Borghans et al. 2008; Bowles, Gintis, and Osborne 2001; Currie and Stabile 2009; Heckman, Stixrud, and Urzua 2006). A uni-versally agreed upon construct of noncognitive dimensions of human capital is not yet available, and researchers currently describe these in a variety of ways. For example, Currie and Stabile (2009) argue that noncognitive aspects of human capital “are likely to capture some aspects of mental health as well as innate character traits” (for in-stance, being extroverted).
An important gap in this promising strand of literature is a full understanding of whether the deleterious effects of mental disorders on human capital are malleable when addressed through policy or clinical intervention. In the last several decades, innovations in pharmaceutical and behavioral treatments for mental health condi-tions have drastically altered the treatment of emotional and behavioral problems in children. This paper exploits a dramatic change in treatment of a common condi-tion during adolescence—that is, depression—to examine how the condicondi-tion and its treatment affect a broad set of human capital measures including academic outcomes, delinquency, and substance use.
By age 18, an estimated 15 percent of U.S. children will have experienced some type of depression (Merikangas et al. 2010).1 In adults, depression is associated lower rates of employment and lower earnings among individuals who do work (Ettner, Frank, and Kessler 1997). In adolescents, depression is associated with lower human capital investment. (Berndt et al. 2000; Ding et al. 2009; Fletcher 2008). In addition to its effect on mood, depression causes restlessness, anxiety, diffi culty with concentra-tion, and feelings of worthlessness, all of which may inhibit academic performance or other aspects of human capital. However, depression’s effect on human capital is diffi cult to measure due to omitted variable biases, described in more detail below. Hence, regulatory activities that altered the use of antidepressants offer a unique op-portunity to learn about depression and its treatment.
In May of 2003, the manufacturer of Paxil, a popular antidepressant generically known as paroxetine, notifi ed the Food and Drug Administration (FDA) that parox-etine increased suicidal thoughts and actions in some pediatric clinical trial partici-pants. The FDA responded with a series of actions including public communications regarding the safety of paroxetine, public hearings regarding evidence on the safety of all antidepressants, and, ultimately, the October 2004 decision to require black- box warnings regarding the safety of pediatric antidepressant use on virtually all anti-depressant product labels and packaging.
The evidence to date, described below in detail, demonstrates that the FDA’s re-lease of this new safety information was widely covered in the popular press (Barry and Busch 2010), and accompanied abrupt declines in pediatric and adolescent anti-depressant use of 20–30 percent following years of steady increases in pediatric and adolescent antidepressant use (Busch et al. 2010; Gibbons et al. 2007; Libby et al.
The Journal of Human Resources 542
2007; Nemeroff et al. 2007; Olfson, Marcus, and Druss 2008; Rosack 2005). During the period immediately before and after the FDA warnings on antidepressants, the extensive margin of treatment (seeking any treatment versus none) did not change measurably, as we describe below. However, care along the intensive margin (the total treatment delivered to those treated) fell as patients were less likely to receive anti-depressants, and no evidence suggests any substantial replacement of antidepressant therapy with behavioral therapies like counseling. Throughout the paper, we refer to this movement along the intensive margin from treatments that include an anti-depressant to those that do not as a decline in treatment. Critics of the FDA warn-ings expressed concerns regarding the impact of the warnwarn-ings on clinical outcomes. These concerns increased when youth suicide rates climbed abruptly in 2004 and 2005, following a decade of relatively steady decline (Bridge et al. 2008; Gibbons et al. 2007).
To examine the effects of treated and untreated adolescent depression on human capital outcomes, we exploit the abrupt change in pediatric antidepressant use induced by FDA warnings to compare outcomes of adolescents who sought professional help for depression problems just before and just after the release of the FDA advisories in 2004. This unique natural experiment permits us to examine several questions with relevance for the economics of human capital, for health policy, and for clinical prac-tice. First, it allows us to study potential unintended consequences of a regulatory policy designed to protect pediatric patients from safety risks of a widely used class of pharmaceuticals. Second, the FDA’s actions permit us to estimate effects of reducing the pharmaceutical treatment of depression on human capital development in adoles-cents. Third, we compare the effects of depression problems among adolescents more and less likely to receive antidepressants in a real world setting rather than the more pristine setting of clinical trial research.
Using seven years of the annual cross- sectional National Survey on Drug Use and Health (2001–2007), we use a difference- in- difference design to study academic and behavioral outcomes in over 100,000 adolescents aged 12–17, comparing outcomes for adolescents with and without a recent episode of probable depression. Compared to other adolescents, adolescents with probable depression experienced a relative de-cline in grade point average (GPA) of 0.14 points after heightened FDA attention to the safety of antidepressants, and changes in average GPA for depressed adolescents were driven entirely by declines among adolescent girls. We fi nd no change in average grades among adolescents without recent episodes of probable depression. We also
fi nd similar patterns for substance use and delinquency outcomes for adolescents with probable depression, relative to other adolescents. We do not fi nd any evidence that our results are explained by compositional changes in the group of adolescents with probable depression.
II. FDA Activity on the Safety of Pediatric
Antidepressant Use
Antidepressant use among adolescents rose steadily and substantially throughout the 1990s and the early 2000s (Olfson, Marcus, and Druss 2008; Olfson et al. 2002). This increase likely stemmed from several sources. First, the develop-ment of Selective Serotonin Reuptake Inhibitors (SSRIs) shifted the balance between the risks and benefi ts of using antidepressants to treat patients with depression; earlier generation antidepressants were lethal in overdose. FDA approval of the SSRI Prozac (fl uoxetine) for depression treatment in children further increased the willingness of clinicians, including general practitioners, to prescribe antidepressants to children. Of the antidepressants available to treat depression today, fl uoxetine has the most evidence supporting its use. In 2004, a landmark multisite randomized trial of depressed ado-lescents treated with fl uoxetine alone or fl uoxetine with cognitive behavioral therapy showed signifi cant improvements in depression symptoms compared with a placebo (Treatment for Adolescents With Depression Study Team 2004). Greater attention to mental health problems in youth, as evidenced by the 2003 Surgeon General’s report, also may have resulted in increases in treatment. This was also a time when antide-pressants were heavily marketed to healthcare professionals and directly to consumers (Rosenthal et al. 2002; Thomas et al. 2006). However, the growth of child and adoles-cent antidepressant use reversed abruptly with the disclosure of possible new safety risks, disseminated by the FDA in a series of public advisories and warnings.
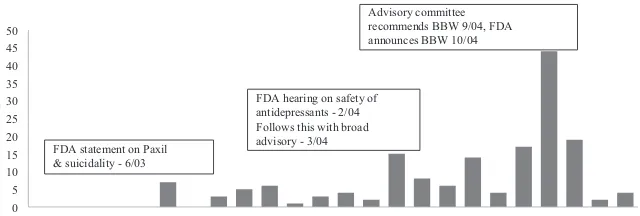
Figure 1 shows the dates of major FDA activity and media coverage of the concerns regarding pediatric use of antidepressants. The FDA’s fi ve specifi c public communi-cations on pediatric antidepressant use began in June 2003 with a one- page
warn-0
Timeline of FDA Actions and Counts of News Media Stories on Pediatric Anti-depressant Use and Suicidality (2003- 04)
The Journal of Human Resources 544
ing about potential risks of increased suicidal thoughts or actions for a single SSRI, Paxil (generically known as paroxetine). Subsequent risk communications increased the scope of the warnings. After considering evidence from hearings, and evidence presented in an FDA- sponsored meta- analysis of 24 randomized controlled trials, an FDA joint advisory committee voted to recommend a black box warning, although eight of the 23 members dissented.2 A black box warning, or a required insert in the packaging of a prescription drug warning of serious or life- threatening adverse side effects, is the strongest warning required by the FDA. In October 2004, the FDA issued a public health advisory directing drug manufacturers to include a black box warning of increased suicidality risk for children and adolescents on a broad range of antidepres-sants beginning January 1, 2005. These warnings strongly urged providers to increase monitoring of pediatric patients using antidepressants. As shown in Figure 1, media coverage of FDA activity was moderate in response to the June 2003 warning regard-ing Paxil but it was heavier in March of 2004 in response to FDA public hearregard-ings and a broad advisory, as well as in the latter half of 2004 when the FDA announced its decision regarding black box warnings. Barry and Busch (2010) further document that media coverage was more negative in early 2004, focusing on the possible safety risks of antidepressants rather than potential benefi ts. Later in 2004, there was more attention given to the controversy regarding the FDA’s decision to require black box warnings.
III. Changes in Antidepressant Use and Youth Suicides
In recent years, multiple studies have documented large declines in pediatric antidepressant use coincident with the 2004 FDA advisories and warnings, with most estimates suggesting that antidepressant use fell by 20 percent to 30 percent relative to the peak levels of antidepressant use in the 12 to 24 months surrounding the warnings (Busch et al. 2010; Busch et al. 2011; Gibbons et al. 2007; Kurian et al. 2007; Libby et al. 2007; Nemeroff et al. 2007; Olfson, Marcus, and Druss 2008; Val-luri et al. 2010). The most- often cited of these studies are summarized briefl y in Ap-pendix Table I.3
Studies that focus on monthly antidepressant sales demonstrate an initial abrupt decline in pediatric antidepressant prescriptions in January- March of 2004, the time of public hearings on the safety of pediatric antidepressant use (Kurian et al. 2007; Nemeroff et al. 2007). One study of all- payer data, representing about half of all prescription activity in the United States, shows the precipitous drop in the number of prescriptions for children under age 18 that occurred in January- June 2004, coincident with intense media coverage of FDA’s hearings and its second advisory on safety risks of pediatric antidepressant use (Nemeroff et al. 2007).
Based on clinical trial evidence, one may view treatments for pediatric depression on a continuum regarding their effi cacy. Combination treatment, or antidepressants in conjunction with evidence- based psychotherapy, reduced symptoms of
depres-2. The FDA commissioned meta-analysis found a two-fold increase in risk of suicidal thoughts and actions (suicidality) in youth taking antidepressants, compared to placebo groups (4 versus 2 percent). This evidence has been criticized because it considered suicidality (suicide is a rare event and no child in any of the trials considered committed suicide) and many trials excluded youth who were suicidal at baseline.
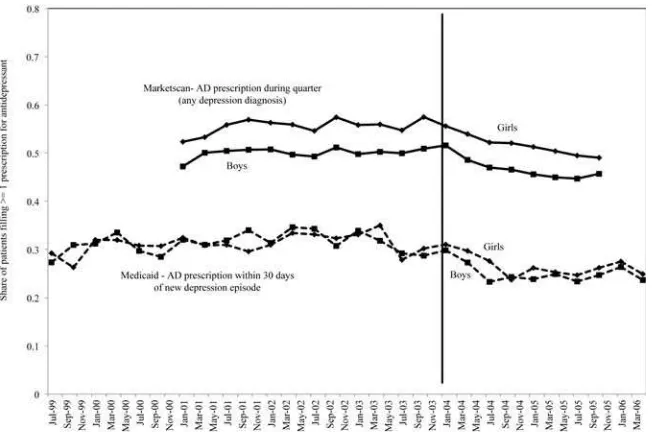
sion most in randomized clinical trials, followed by antidepressants alone, and then evidence- based psychotherapy alone (Treatment for Adolescents With Depression Study Team 2004).4 In effect, the FDA warnings moved adolescents along this con-tinuum toward less effective treatments. This is particularly true given that most pa-tients receiving “psychotherapy alone” in real- world clinical settings receive far fewer psychotherapy visits and lower quality therapy than what was received by trial par-ticipants (Busch et al. 2006; Olfson et al. 2002). Some children who previously would have received combination treatment received psychotherapy alone. Others moved from antidepressant treatment alone to no evidence- based treatment. The literature is mixed on whether or not the receipt of psychotherapy increased after the warnings. One study suggests there was a slight increase in receipt of any psychotherapy; among treated adolescents, the percent receiving at least one psychotherapy visit rose less than 5 percent in the period after the warnings ( Valluri et al. 2010). In contrast, other studies found no such increase (Busch et al. 2010; Libby et al. 2007). In addition, the types of providers prescribing antidepressants shifted, with primary care physicians writing a smaller share of total antidepressant prescriptions compared with psychia-trists after the FDA warnings (Nemeroff et al. 2007; Olfson, Marcus, and Druss 2008). Because our study design relies on the timing of the abrupt shift in antidepressant use among adolescent patients with depression, we present additional evidence on antidepressant patterns for 12–17- year- olds from two complementary sources, Florida Medicaid claims data and Marketscan data, a large administrative database of phar-maceutical claims for privately insured individuals. The Marketscan data include all individuals with diagnoses of depression in a given quarter based on International Classifi cation of Diseases, Ninth Revision (ICD- 9) Codes 296.2, 296.3, 300.4, and 311. Antidepressant use is defi ned as one or more claims for any of 36 antidepressants covered by the FDA black box warning in that quarter. In the Florida Medicaid data, these include only pediatric patients with new diagnoses of depression using the same codes above. We defi ned new diagnoses of depression as those without any code for depression in the 120 days prior to an initial diagnosis of depression. In the Florida data, antidepressant use is defi ned as one or more claims for any of 36 antidepressants covered by the FDA black box warning within 30 days of diagnosed depression.5 Figure 2 plots the antidepressant prescription fi lls from both of these data sets. Despite slightly different defi nitions and time periods, the prescribing patterns are remarkably similar in the Marketscan and Florida Medicaid data. Prescriptions fall abruptly begin-ning in the fi rst quarter of 2004 (although girls in the Marketscan data show a drop starting one quarter earlier). Also of note, the prescribing patterns are similar across sexes. Comparing 2003 to 2005, the relative declines were smaller in the Marketscan data (about 10 to 15 percent relative decline) compared with the Medicaid data (about 25 to 30 percent relative decline). The greater drop in a sample made up exclusively of pediatric depression patients with new episodes of depression is consistent with
The Journal of Human Resources 546
the notion that changes in prescribing in response to FDA advisories and warnings affected new depression episodes more than existing episodes (Busch et al. 2011).
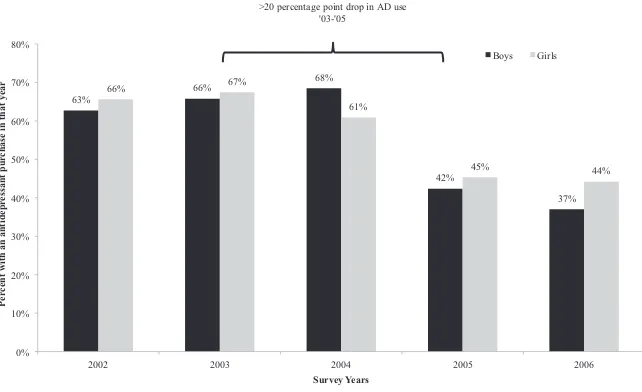
Figure 2 depicts the timing of drops in antidepressant use in two populations, but it is important to understand how the FDA activity on antidepressants affected prescrib-ing patterns in a broader national population. Usprescrib-ing adolescents aged 12 to 17 in the nationally representative Medical Expenditure Panel Surveys (2002–2006), we esti-mate the proportion with any antidepressant use in a calendar year among those with one or more medical encounters for depression. The MEPS sample is considerably smaller than the samples depicted in Figure 2, and the diagnoses are a little less precise than those in actual claims data. 6 In addition, data are not available by quarter. None-theless, Figure 3 shows a dramatic absolute decline of over 20 percentage points (24 for boys and 22 for girls) in antidepressant use between 2003 and 2005, or a relative decline of over 30 percent. We note that this graph suggests little decline in 2004; this
6. The MEPS reports 3-character International Classifi cation of Disease-9th Revision codes. We defi ned a cohort of depressed children using code 296 (affective psychoses), 300 (neurotic disorders), and 311 (depres-sion Not Elsewhere Classifi ed). This category is necessarily broader than that defi ned in administrative data from Florida Medicaid, for example, but more specifi c than what is available in the NSDUH based on seeking treatment.
Figure 2
Declines in Antidepressant Use Among Privately and Publicly Insured Pediatric Patients Age 12- 17
is likely due to the use of calendar year prevalence. Data from 2004 include months where rates of antidepressant use were still increasing.
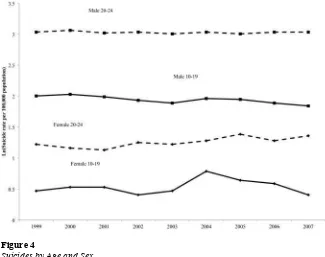
To establish a link between declines in antidepressant use and human capital among depressed adolescents, one also needs to examine whether symptoms of depression changed after changes in treatment (reductions in antidepressant use). Earlier we noted the clinical trial evidence of the effi cacy of treatment in reducing depression symp-toms in adolescents. To better understand how the FDA activity around pediatric anti-depressant use may have affected symptoms in the population of adolescents with de-pression, we present information regarding suicides in the United States over the period from 1999 to 2007 (Figure 4). Suicide represents the most extreme consequence of de-pression, and one that depression treatments target. The data in Figure 4 are drawn from the Centers for Disease Control and Prevention’s publicly available information on deaths by cause and selected demographic characteristics. Because of dramatically dif-ferent levels of suicides by age and gender (males commit suicide more often, and, be-tween ages 10 and 24, suicide rates rise with age), we present the natural log of suicide deaths per 100,000 population, separately for two age groups (10–19 and 20–24), and by sex. Because the 2004 FDA warnings applied to pediatric antidepressant use, they did not directly affect 20–24- year- olds. Youth suicides had been fl at or declining among 10–19- year- olds in the years preceding the warnings, but in 2004, 10–19- year- old girls experienced a sharp increase in suicides: of over 30 percent. There was no abrupt rise among older ages (20–24) as expected, given that these early warnings focused on
pedi-63% >20 percentage point drop in AD use
'03-'05
Figure 3
Annual Antidepressant Use Among Kids 12- 17 Seeing a Medical Provider for Depression Symptoms
The Journal of Human Resources 548
atric populations. These results echo those presented by Gibbons and colleagues (2007) but include three additional years of data (through 2007). Gibbons and colleagues also note that since 1988, U.S. youth suicide rates have declined in all but two years (1994 and 2000), and these increases were much smaller than the increase in suicides in 2004. Taken together, we interpret the trends in antidepressant use and the concomitant rise in youth suicide as evidence that symptoms of depression rose in the adolescent popula-tion in 2004 and 2005 in response to the FDA advisories and warnings on the safety of pediatric antidepressant use. We use this abrupt change in treatment and symptoms of depression to identify human capital effects of depression treatment.
IV. Empirical Methods and Data
A. Contribution to the Literature and Overview of Identifi cation Strategy
Researchers have attempted to quantify the impact of depression on human capital by examining measures of academic achievement but even the most rigorous evidence to date makes causal inference regarding the effect of depression diffi cult. More importantly, there
Figure 4
Suicides by Age and Sex
is no evidence from real world settings (as opposed to randomized clinical trials) that treat-ing adolescent depression can improve academic outcomes. Fletcher (2008) estimates the relationship between adolescent depression status and educational attainment, identifying the effect of depression using fi xed effect models, which effectively compare adolescent siblings with and without symptoms of depression. His analysis documents a correla-tion between depression and poorer educacorrela-tional attainment for girls but not for boys. The interpretation of this analysis relies on the assumption that only differences in depression cause the observed differences in academic outcomes, rather than some fi xed trait like motivation or ability that might be correlated with depression, yet differs across siblings.
Another study uses genetic markers as identifying instruments for adolescent de-pression and fi nds a signifi cant negative effect of depression on grade point average but again these signifi cant effects are only observed for girls (Ding et al. 2009). This approach requires the assumption that the genetic marker relates only to depression, and not other unmeasured traits that could infl uence grade point averages. Other re-search using person- level fi xed effects models for a sample of a somewhat older age group (college students) does not fi nd gender differences in the relationship between depression and grade point average (Eisenberg, Golberstein, and Hunt 2009). These three studies mark signifi cant progress toward the goal of understanding human capi-tal effects of depression during the crucial period of adolescence but each relies on relatively strong, and somewhat similar, assumptions that depression, and not related unmeasured traits, drives academic differences within families, according to genetic markers or within an individual over time. None of these studies provides information regarding the treatment of depression and academic achievement.
Researchers have also attempted to quantify the effect of adolescent depression on other outcomes that represent noncognitive dimensions of human capital including substance use and delinquency but, as in the case of academic achievement, identifying causal effects is diffi cult. For example, recent literature showed that state- level rates of antidepressant use are correlated with violent crime rates but not with property crime rates (Marcotte and Markowitz 2010). When these researchers focus specifi cally on prescription rates and crime rates for teenagers, they fi nd little evidence that psychiatric drugs, and antidepres-sants in particular, are associated with either homicide rates or arrest rates for violent and property crimes. A 10- year longitudinal followup of the National Comorbidity Survey confi rmed that individuals with major depression at baseline (1990–92) were much more likely to initiate the use of illicit drugs in the subsequent decade compared to individuals without major depression (Swendsen et al. 2010). Adolescents aged 12–17 with a major depressive episode in the past year were twice as likely to initiate illicit drug use compared with those without depression (16.1 versus 6.9 percent) (SAMHSA 2007).
Despite ample research on depression and substance use, causal evidence on the effect of depression treatment on these outcomes is rare. Epidemiologic studies that present correlations between depression and substance- use disorders cannot distin-guish a causal role for depression from a case in which substance- use disorders cause depression or a case in which a third factor contributes to both depression and sub-stance use disorders (Breslau et al. 1998; Glantz 2002; Jane- Llopis and Matytsina 2006; Swendsen et al. 2010). Experimental studies on the effects of depression treat-ment target a narrow range of pediatric patients (excluding, for example, patients with a history of substance abuse), and focus on a limited set of clinical outcomes.
hu-The Journal of Human Resources 550
man capital outcomes with a complementary and stronger identifi cation strategy, and to an-swer the clinical and policy relevant question of whether treating depression can improve human capital outcomes, we take advantage of a powerful natural experiment: the sudden decline in use of antidepressants for treating pediatric depression induced by the FDA’s 2003–2004 warnings on the risks of suicidality associated with pediatric antidepressant use. We compare academic and behavioral outcomes for adolescents who sought treatment for depression just before and just after the sharp drop in adolescent antidepressant use in the fi rst quarter of 2004. Adolescents without recent episodes of depression serve as a com-parison group. Our identifi cation relies on the assumption that any difference in prescrib-ing patterns and outcomes immediately before versus immediately after the fi rst quarter of 2004 relate only to FDA hearings and advisories, and thus mimics random variation.
B. National Survey on Drug Use and Health
The data for our analyses come from the National Surveys on Drug Use and Health (NSDUH).7 The NSDUH is an annual survey conducted by the Substance Abuse and Mental Health Services Administration that collects data from approximately 70,000 individuals aged 12 and older who are representative of the U.S. population. Several features of the NSDUH are particularly salient for our analyses. The NSDUH is in the
fi eld year- round and the public- use version of the data set includes a variable indi-cating the quarter in which the interview occurred. The NSDUH has a large sample of adolescents, as 12–17- year- olds comprise approximately one- third of the total samples. In addition, although the NSDUH focuses on substance- use issues, it also collects survey data on mental health, education, and delinquency. In our main analy-ses, we use the 2001–2007 years of the NSDUH. After restricting to adolescents, that yields a sample size of 126,355 observations during all 28 quarters from 2001–2007. Our analyses have slightly smaller samples of adolescents for two reasons. All analy-ses exclude the fi rst quarter of 2004, due to the fact that it straddles months that can be thought of as pre- or postperiod. This exclusion, combined with missing information on academic outcomes leaves 106,635 (121,785) observations in models of academic (substance use) outcomes.8 Finally, outcome variables related to stealing, fi ghts, and attacks cover the 12- month period before the survey so we exclude the fi rst two quar-ters of 2004 to have a cleaner pre- and postperiod, leaving 116,371 observations with complete information on delinquent behaviors.
C. Depression Measure
As described above, our key comparison is in academic outcomes for adolescents with probable depression before and after the FDA warnings about antidepressant risks. A
7. Prior to 2002, the survey was called the National Household Survey on Drug Abuse.
more ideal measure of depression status based on a validated diagnostic instrument was not asked of adolescents in the NSDUH until 2004. Instead, we proxy for probable depression status by using information collected from adolescents about whether they received any treatment or counseling services for emotional or behavioral problems from a diverse set of sources over the past 12 months. This population refl ects those we most expect to be affected by the warning. The NSDUH asks respondents whether they stayed overnight in a hospital, in a residential treatment center, or in therapeutic foster care. Respondents also report whether they received any services for emotional or behavioral problems from a partial- day hospital or day treatment program; from a mental health clinic or center; from a private therapist, psychologist, psychiatrist, social worker, or counselor; from an in- home therapist, counselor, or family preserva-tion worker; or from a pediatrician or other family doctor. They also report whether they talked to school counselors, school psychologists, or had regular meetings with teachers about emotional or behavioral problems.
For each of the services that a respondent reported using in the past 12 months, the respondent is asked a series of closed- ended questions to determine why they used that service. Two of those followup questions are used to identify probable depression: Whether the services were because the respondent thought about or tried to kill them-selves, or because the respondent felt depressed.9 All of the questions related to mental health treatment were asked in a consistent manner in the 2001–2007 surveys. We code someone as having probable depression if they respond that they used any of the above services (excluding services from school counselors, psychologists, and teachers since they would not be prescribers of antidepressants) and if that service was used because of suicidality or depression.10,11 As shown in Table 1, 6.6 percent of the sample is clas-sifi ed as having probable depression. This defi nition of probable depression excludes individuals who might use antidepressant medication but would not report using mental health services for depression (perhaps because they were taking antidepressants for other conditions such as anxiety). This would likely bias our results toward the null.12
Table 1 shows sample characteristics separately by gender and whether an adolescent was depressed, according to the defi nition above. As expected, probable depression is more common among females (8.5 percent depressed) than males (4.8 percent depressed). Com-pared with nondepressed adolescents, the depressed respondents are slightly older, more likely to be white, and more likely to live in families with moderate or low- income levels.
D. Outcome Measures
We examine three types of outcomes: academic achievement, substance use, and de-linquency. We measure academic achievement using the respondents’ self- report of their average grades in the most recent grading period. In the NSDUH, respondents
9. The other possible explanations were because the respondent felt afraid or tense, because of breaking rules or acting out, because of eating problems, or some other reason.
10. For brevity, throughout the paper, we refer to those classifi ed as having probable depression as “depressed.” 11. While the size of the group with probable depression grows moderately if we include the school-based services in our defi nition, our substantive results are unchanged.
The Journal of Human Resources
552
Table 1
Sample Characteristics by Sex and Depression Status
All Males Females
Not depressed 0.934 0.952 0.915
Depressed 0.066 0.048 0.085
All Depressed Nondepressed Depressed Nondepressed
n=126,355 n=3,203 n=61,292 n=5,686 n=56,174
Age
12 0.159 0.145 0.158 0.083 0.169
13 0.169 0.169 0.172 0.131 0.169
14 0.170 0.159 0.171 0.168 0.171
15 0.171 0.174 0.170 0.209 0.169
16 0.167 0.165 0.167 0.208 0.165
17 0.163 0.188 0.163 0.201 0.158
Quarter
1 0.244 0.244 0.243 0.264 0.244
2 0.253 0.270 0.251 0.255 0.253
3 0.253 0.247 0.254 0.240 0.253
4 0.250 0.239 0.252 0.240 0.250
Race/ethnicity
White 0.617 0.683 0.616 0.688 0.607
Busch, Golberstein, and Meara
553
Asian 0.040 0.020 0.041 0.017 0.042
Multiple 0.016 0.019 0.015 0.021 0.017
Hispanic 0.168 0.127 0.170 0.144 0.169
Family income
under $10,000 0.058 0.075 0.056 0.064 0.060
$10,000 - $19,999 0.117 0.125 0.113 0.132 0.121
$20,000 - $29,999 0.113 0.117 0.112 0.109 0.114
$30,000 - $39,999 0.113 0.108 0.114 0.115 0.113
$40,000 - $49,999 0.113 0.112 0.114 0.108 0.114
$50,000 - $75,000 0.192 0.189 0.193 0.189 0.190
over $75,000 0.293 0.274 0.298 0.282 0.289
The Journal of Human Resources 554
select one of four choices: A+/A/A–, B+/B/B–, C+/C/C–, or D or lower. When treated as a cardinal measure, this variable has an interpretation that is similar to GPA, with 4.0 indicating the highest grades.13 We also evaluated a set of intermediate schooling measures regarding school attendance and adolescent attitudes toward school but these results were imprecisely estimated, and, for brevity, we omit them here.
Next we examine outcomes relating to substance use in the past 30 days. Respondents were asked, “In the last 30 days on how many days did you . . . ” have 5 or more drinks on the same occasion?; smoke part or all of a cigarette?; use_____(an illicit drug or in the case of prescription drugs, use____non- medically)?14 We used these questions to form indicator variables for binge drinking, cigarette use, illicit drug use, and nonmedi-cal prescription drug use in the past 30 days. Finally, we examined measures of delin-quency. Respondents were asked, “During the past 12 months, how many times have you . . . stolen or tried to steal anything worth more than $50?; gotten into a serious fi ght at school or work? Attacked someone with the intent to seriously hurt them?” We used these responses to create indicator variables regarding fi ghting, stealing, and attacking.
All of our outcome measures are summarized in Table 2. Our sample characteristics match the literature on academic outcomes. Grades are slightly higher on average for fe-males than fe-males, and depressed adolescents fare slightly worse than their nondepressed peers. Our delinquency measures suggest that a signifi cant minority of adolescents en-gaged in fi ghting and stealing. About 42 percent of boys and 34 percent of girls with a recent episode of depression reported one or more fi ghts in the past 12 months compared with 25 percent of boys and 17 percent of girls in the nondepressed group. Stealing and “attacking” with the intent to hurt someone were less common. Less than 10 percent of nondepressed adolescents reported this behavior while 23 percent of boys and 15 percent of girls in the depressed group had attacked someone in the prior 12 months.
Substance use was not uncommon, especially among the depressed adolescents. In this group, 16(19) percent of boys(girls) reported binge drinking, 21(26) percent of boys(girls) reported using cigarettes, 22(21) percent of boys(girls) had used an illicit drug, and 8(9) percent of boys(girls) had used prescription drugs inappropriately in the prior 30 days. In all cases but binge drinking, substance use was twice as common in the depressed adolescents compared with their nondepressed peers.
E. Empirical Models
Our basic regression specifi cation employs the model described in Equation 1.
(1) Yit=␣+1Timet+2PostFDAt+3(PostFDA*Time)t+4Dit+5(D*Time)it
+ 6(D*PostFDA*Time)it+␦Xit+Qt+it
Y denotes an outcome variable for individual i observed in quarter t. Our “Time” variable t is a linear time trend over the 28 quarters of our study period. The variable PostFDA has a value of zero until the fi rst quarter of 2004 and a value of one after that. The variable D
indi-13. We also estimate ordered probit models for this outcome but our results are unchanged.
Busch, Golberstein, and Meara
555
Males Females
All Depressed Nondepressed Depressed Nondepressed
GPA 2.924 2.534 2.815 2.756 3.080
(0.878) (0.944) (0.887) (0.904) (0.834)
Grades=A 0.285 0.165 0.239 0.216 0.347
Grades=B 0.420 0.359 0.415 0.425 0.429
Grades=C 0.229 0.321 0.267 0.258 0.181
Grades=D/F 0.066 0.156 0.079 0.101 0.044
Fights in past 12 months
0 times 0.778 0.576 0.749 0.662 0.831
1–2 times 0.171 0.290 0.192 0.242 0.135
3–5 times 0.034 0.083 0.038 0.060 0.024
6–9 times 0.008 0.023 0.009 0.019 0.005
10+ times 0.009 0.028 0.012 0.018 0.005
Stole in past 12 months
0 times 0.955 0.851 0.947 0.898 0.974
1–2 times 0.032 0.099 0.038 0.067 0.019
3–5 times 0.006 0.022 0.008 0.015 0.004
6–9 times 0.003 0.009 0.002 0.009 0.002
10+ times 0.004 0.020 0.005 0.011 0.002
The Journal of Human Resources
556
Males Females
All Depressed Nondepressed Depressed Nondepressed
Attacked anyone in past 12 months
0 times 0.921 0.774 0.909 0.849 0.950
1–2 times 0.064 0.163 0.074 0.115 0.043
3–5 times 0.009 0.035 0.011 0.024 0.005
6–9 times 0.003 0.012 0.003 0.006 0.001
10+ times 0.003 0.016 0.004 0.006 0.001
Substance use in past 30 days
Any binge drinking 0.105 0.162 0.108 0.189 0.091
Any cigarette use 0.116 0.214 0.108 0.260 0.107
Any illicit drug use 0.105 0.220 0.092 0.208 0.102
Any nonmedical Rx drug use 0.035 0.079 0.029 0.088 0.034
Notes: All means and proportions are estimated with the NSDUH sampling weights and include all nonmissing observations in the 2001–2007 NSDUH.
cates whether a respondent falls into the depressed group. We allow the time trend to vary by PostFDA and by depression status.15 The vector X includes a set of sociodemographic variables. These variables include a dummy variable for sex, a linear age trend, and a set of dummy variables for race/ethnicity (white, black, Native American, Native Ha-waiian/Pacifi c Islander, Asian, more than one race, or Hispanic). X also includes a set of dummy variables for family income (< $10,000, $10–29,999, $20–29,999, $30–39,999, $40–49,999, $50–74,999, $75,000 or more). Q represents a set of quarter dummies to adjust for seasonality. In these models, the key coeffi cient that identifi es the effect of the FDA warnings on human capital outcomes for adolescents with probable depression after controlling for underlying trends in academic achievement is β6.
We estimate our main models of academic achievement using OLS. For our other outcome variables, which are dichotomous, we estimate probit models. In the tables, we present probit coeffi cients, and for our main variables of interest, we provide the marginal effects as well as bootstrapped standard errors of the marginal effects (based on 500 replications of samples drawn with replacement). All of our regression models utilize the NSDUH sampling weights to be representative of the U.S. population. We estimate our models with heteroskedasticity- robust standard errors clustered on the time period (defi ned by quarter of measurement).
V. Results
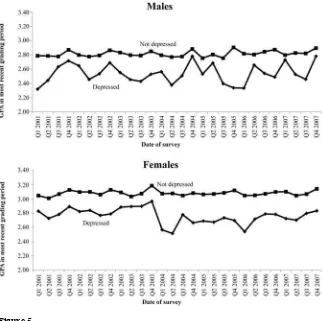
We fi rst present graphical evidence of the trends in academic achieve-ment for adolescents with probable depression. Figure 5 shows the average grades for adolescents with probable depression, where each point indicates average grades in a quarter. In the periods before the FDA warnings, there are no discernable trends in average grades for adolescents with and without probable depression. After the FDA warnings, the average grades dropped abruptly for depressed girls, though not for depressed boys. In addition, Figure 5 also shows the trend in average grades for ado-lescents without probable depression. As expected, the average grades for adoado-lescents without probable depression are higher than those for depressed adolescents. Average grades for adolescents without depression were fl at throughout the study period, with no apparent change around the time of the 2004 FDA advisories and warnings.
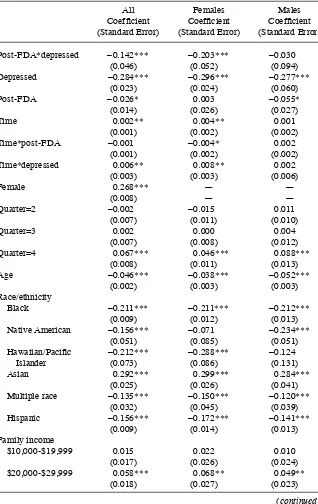
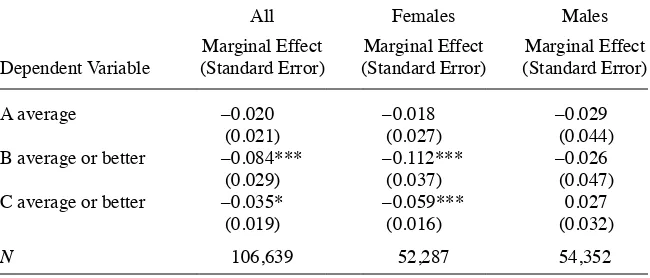
Table 3 shows the results of the regression models of our main outcome variable, average grades. The results for Column 1 are for the full sample. The key coeffi cient of interest, β6, is estimated to be –0.142, implying that average grades dropped signifi -cantly after the FDA warnings. The regression results also confi rm the graphical evi-dence. The key coeffi cient for females (Column 2) is larger in magnitude (β6 = –0.203) and more precise than the coeffi cient for males, which is not signifi cantly different from zero (β6 = –0.030). Table 4 examines whether these effects occurred throughout the grade distribution by estimating models of whether respondents report having an A average or better, a B average or better, or a C average or better. Adolescents with a recent episode of probable depression were 8.6 percentage points less likely to earn a B or better and 3.5 percentage points less likely to earn a C or better after the FDA
ad-15. Adding a quadratic term or higher-order polynomials to the time trends did not affect our main
The Journal of Human Resources 558
visories in early 2004. This was driven by the depressed girls, who were 11 percentage points less likely to earn a B or better and six percentage points less likely to earn a C or better following the FDA advisories. There appears to be little effect of FDA advisories and the decline in depression treatment on the likelihood of reporting an A average.
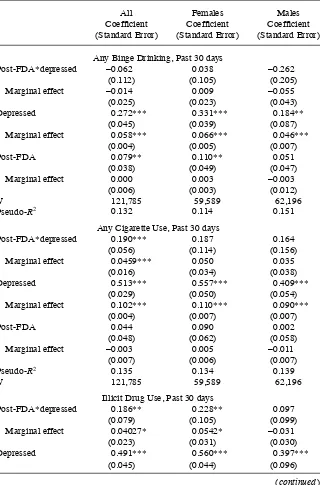
Table 5 shows key coeffi cients and marginal effects of the FDA warnings on sub-stance use. Smoking increased in the full sample by 4.6 percentage points. Although depressed adolescents are much more likely to binge drink than their peers, the FDA advisories appear to have little effect on binge drinking. Among girls, the FDA adviso-ries and decline in the treatment of depression increased the use of illicit drugs by 5.4 percentage points and increased nonmedical prescription drug use by 4.3 percentage points. As with academic outcomes, the effects on illegal drug use and nonmedical prescription drug use are driven mainly by girls rather than boys, although the effects on cigarette use are similar across gender.
Figure 5
Table 3
Difference- in- Difference OLS Models of Grades
All Females Males
Coeffi cient Coeffi cient Coeffi cient (Standard Error) (Standard Error) (Standard Error)
Post- FDA*depressed –0.142*** –0.203*** –0.030
(0.046) (0.052) (0.094)
Depressed –0.284*** –0.296*** –0.277***
(0.023) (0.024) (0.060)
Post- FDA –0.026* 0.003 –0.055*
(0.014) (0.026) (0.027)
Time 0.002** 0.004** 0.001
(0.001) (0.002) (0.002)
Time*post- FDA –0.001 –0.004* 0.002
(0.001) (0.002) (0.002)
Time*depressed 0.006** 0.008** 0.002
(0.003) (0.003) (0.006)
Female 0.268*** — —
(0.008) — —
Quarter=2 –0.002 –0.015 0.011
(0.007) (0.011) (0.010)
Quarter=3 0.002 0.000 0.004
(0.007) (0.008) (0.012)
Quarter=4 0.067*** 0.046*** 0.088***
(0.008) (0.011) (0.013)
Age –0.046*** –0.038*** –0.052***
(0.002) (0.003) (0.003)
Race/ethnicity
Black –0.211*** –0.211*** –0.212***
(0.009) (0.012) (0.013)
Native American –0.156*** –0.071 –0.234***
(0.051) (0.085) (0.051)
Hawaiian/Pacifi c –0.212*** –0.288*** –0.124
Islander (0.073) (0.086) (0.131)
Asian 0.292*** 0.299*** 0.284***
(0.025) (0.026) (0.041)
Multiple race –0.135*** –0.150*** –0.120***
(0.032) (0.045) (0.039)
Hispanic –0.156*** –0.172*** –0.141***
(0.009) (0.014) (0.013)
Family income
$10,000- $19,999 0.015 0.022 0.010
(0.017) (0.026) (0.024)
$20,000- $29,999 0.058*** 0.068** 0.049**
(0.018) (0.027) (0.023)
The Journal of Human Resources 560
All Females Males
Coeffi cient Coeffi cient Coeffi cient (Standard Error) (Standard Error) (Standard Error)
$30,000- $39,999 0.112*** 0.156*** 0.068**
(0.018) (0.025) (0.024)
$40,000- $49,999 0.177*** 0.201*** 0.153***
(0.022) (0.032) (0.026)
$50,000- $75,000 0.296*** 0.317*** 0.277***
(0.020) (0.023) (0.027)
>$75,000 0.467*** 0.487*** 0.448***
(0.018) (0.022) (0.024)
Constant 2.748*** 2.978*** 2.786***
(0.022) (0.028) (0.028)
R2 0.105 0.096 0.079
N 106,639 52,287 54,352
Notes: OLS models estimated with heteroskedasticity- robust standard errors clustered on the time period. Observations from the fi rst quarter of 2004 are excluded from the models.
* p < 0.10, ** p < 0.05, *** p < 0.01
Table 3 (continued)
Table 4
Effects of FDA Warnings at Different Points in the Grade Distribution
All Females Males
Dependent Variable
Marginal Effect (Standard Error)
Marginal Effect (Standard Error)
Marginal Effect (Standard Error)
A average –0.020 –0.018 –0.029
(0.021) (0.027) (0.044)
B average or better –0.084*** –0.112*** –0.026
(0.029) (0.037) (0.047)
C average or better –0.035* –0.059*** 0.027
(0.019) (0.016) (0.032)
N 106,639 52,287 54,352
Notes: Each cell represents the marginal effect and bootstrapped standard error from a separate probit model. Standard errors estimated from 500 bootstrap replications clustered on time period. All models exclude ob-servations from fi rst quarter of 2004. All models include the same set of covariates as in Table 3.
Table 5
Effects of FDA Warnings on Substance Use
All Females Males
Coeffi cient (Standard Error)
Coeffi cient (Standard Error)
Coeffi cient (Standard Error)
Any Binge Drinking, Past 30 days
Post- FDA*depressed –0.062 0.038 –0.262
(0.112) (0.105) (0.205)
Marginal effect –0.014 0.009 –0.055
(0.025) (0.023) (0.043)
Depressed 0.272*** 0.331*** 0.184**
(0.045) (0.039) (0.087)
Marginal effect 0.058*** 0.066*** 0.046***
(0.004) (0.005) (0.007)
Post- FDA 0.079** 0.110** 0.051
(0.038) (0.049) (0.047)
Marginal effect 0.000 0.003 –0.003
(0.006) (0.003) (0.012)
N 121,785 59,589 62,196
Pseudo- R2 0.132 0.114 0.151
Any Cigarette Use, Past 30 days
Post- FDA*depressed 0.190*** 0.187 0.164
(0.056) (0.114) (0.156)
Marginal effect 0.0459*** 0.050 0.035
(0.016) (0.034) (0.038)
Depressed 0.513*** 0.557*** 0.409***
(0.029) (0.050) (0.054)
Marginal effect 0.102*** 0.110*** 0.090***
(0.004) (0.007) (0.007)
Post- FDA 0.044 0.090 0.002
(0.048) (0.062) (0.058)
Marginal effect –0.003 0.005 –0.011
(0.007) (0.006) (0.007)
Pseudo- R2 0.135 0.134 0.139
N 121,785 59,589 62,196
Illicit Drug Use, Past 30 days
Post- FDA*depressed 0.186** 0.228** 0.097
(0.079) (0.105) (0.099)
Marginal effect 0.04027* 0.0542* –0.031
(0.023) (0.031) (0.030)
Depressed 0.491*** 0.560*** 0.397***
(0.045) (0.044) (0.096)
The Journal of Human Resources 562
Table 6 shows key coeffi cients and marginal effects of the FDA warnings on delin-quency outcomes. Fighting and stealing both rose disproportionately among depressed adolescents in the post period. Fighting rose by 6.5 percentage points and stealing rose by 4.6 percentage points in the full sample, although the effects on stealing were driven entirely by depressed girls. There was no signifi cant effect of the FDA warn-ings on attacks in the last 12 months. Taken together, our results suggest there were important adverse consequences of the FDA advisories on grades, substance use, and other delinquent behavior. Depressed girls seem to have been affected most by these unintended consequences, because we measured no signifi cant changes in grades or behavior among boys with likely depression. Next we consider several alternative interpretations of our fi ndings.
All Females Males
Coeffi cient (Standard Error)
Coeffi cient (Standard Error)
Coeffi cient (Standard Error)
Marginal effect 0.101 0.103*** 0.098***
(0.005) (0.007) (0.008)
Post- FDA 0.023 0.071 –0.022
(0.035) (0.055) (0.054)
Marginal effect –0.016 –0.012 –0.021**
(0.007) (0.009) (0.009)
Pseudo- R2 0.071 0.065 0.079
N 121,785 59,589 62,196
Nonmedical Rx Drug Use, Past 30 days
Post- FDA*depressed 0.172 0.331** –0.102
(0.129) (0.143) (0.185)
Marginal effect 0.018 0.0427* –0.029
(0.020) (0.024) (0.044)
Depressed 0.490*** 0.519*** 0.434***
(0.057) (0.068) (0.103)
Marginal effect 0.044*** 0.043*** 0.047***
(0.004) (0.005) (0.007)
Post- FDA 0.087* 0.026 0.152**
(0.048) (0.087) (0.077)
Marginal effect –0.011* –0.009 –0.014
(0.006) (0.012) (0.009)
Pseudo- R2 0.041 0.040 0.043
N 121,785 59,589 62,196
Notes: All models exclude observations from fi rst quarter of 2004. Standard errors of marginal effects are estimated from 500 bootstrap replications, clustered on the time period. All models include the same set of covariates as in Table 3.
* p < 0.10, ** p < 0.05, *** p < 0.01
Table 6
Effects of FDA Warnings on Delinquency Outcomes, Probit Models
All Females Males
Coeffi cient (Standard Error)
Coeffi cient (Standard Error)
Coeffi cient (Standard Error)
Fights Past 12 Months
Post- FDA*depressed 0.187*** 0.236*** 0.155
(0.054) (0.071) (0.124)
Marginal effect 0.065*** 0.075*** 0.045
(0.025) (0.027) (0.043)
Depressed 0.589*** 0.668*** 0.488***
(0.051) (0.059) (0.075)
Marginal effect 0.177*** 0.175*** 0.170***
(0.007) (0.009) (0.011)
Post- FDA 0.205*** 0.127*** 0.266***
(0.031) (0.032) (0.040)
Marginal effect –0.032** –0.038** –0.024
(0.015) (0.017) (0.020)
Pseudo- R2 0.035 0.036 0.022
N 116,371 57,030 59,341
Stealing Past 12 Months
Post- FDA*depressed 0.263** 0.445** –0.006
(0.126) (0.199) (0.181)
Marginal effect 0.046* 0.069** –0.023
(0.028) (0.032) (0.038)
Depressed 0.673*** 0.735*** 0.587***
(0.055) (0.090) (0.084)
Marginal effect 0.085*** 0.071*** 0.098***
(0.005) (0.006) (0.010)
Post- FDA 0.009 –0.015 0.020
(0.068) (0.093) (0.105)
Marginal effect –0.003 0.002 –0.008
(0.006) (0.004) (0.009)
Pseudo- R2 0.054 0.054 0.040
N 116,471 57,073 59,398
Attacks Past 12 Months
Post- FDA*depressed 0.034 0.143 –0.070
(0.094) (0.133) (0.134)
Marginal effect 0.0004 0.019 –0.021
(0.026) (0.031) (0.039)
Depressed 0.646*** 0.697*** 0.605***
(0.050) (0.056) (0.074)
The Journal of Human Resources 564
VI. Alternative Interpretation of the Results
In this section, we address several potential threats to our interpreta-tion of the results. The most obvious concern is that with so much change in the treat-ment of depression, the composition of the “depressed” group is changing in ways that could bias us toward the conclusion that the FDA warnings had an adverse impact on depressed adolescents. If, for example, the marginal depression patient, in terms of severity, was less likely to seek treatment following the FDA warnings, we would worry that the remaining set of depression patients might be sicker and have worse human capital outcomes than those patients who opted not to seek treatment. To ex-plore this concern, we examined both the trend in and the composition of our sample of adolescents with probable depression. Figure 6 plots the share of adolescents with probable depression throughout our study period, and we report the results of tests for signifi cant changes in the level or trend of depressed adolescents in the post- period of our analysis. The plotted raw data do not show any abrupt changes in the share of adolescents who report seeking treatment for depression. In the regression models of depression status as a function of time, there was no decline in the share of adoles-cents aged 12 to 17 seeking treatment for depression after the FDA warnings.16,17
In Table 7, we estimated models like those in Equation 1, using each of the
covari-16. Data from the nationally representative MEPS (not shown) corroborate the NSDUH trends. There are no statistically signifi cant differences in annual rates of depression treatment among 12-17-year-olds for any of the years between 2002 and 2006.
17. As described in Figure 6, the coeffi cient on the PostFDA dummy suggests a small increase in the share of adolescent males with depression, which is marginally signifi cant at p = 0.058. For females, there is no evidence of a change in the share of adolescents with depression in the postperiod.
All Females Males
Coeffi cient (Standard Error)
Coeffi cient (Standard Error)
Coeffi cient (Standard Error)
Marginal effect 0.117*** 0.101*** 0.133***
(0.006) (0.007) (0.009)
Post- FDA 0.007 –0.099 0.074
(0.054) (0.085) (0.055)
Marginal effect –0.010 –0.010 –0.009
(0.007) (0.009) (0.008)
Pseudo- R2 0.046 0.054 0.027
N 116,467 57,076 59,391
Notes: All models exclude observations from fi rst and second quarters of 2004. Standard errors of marginal effects are estimated from 500 bootstrap replications, clustered on the time period. All models include the same set of covariates as in Table 3.
* p < 0.10, ** p < 0.05, *** p < 0.01
ates included in X as our outcome variable (controlling only for quarter of survey). We tested whether the coeffi cient on Depress*Post- FDA was signifi cant, indicating that characteristics of adolescents in the depressed group changed substantially with the change in prescribing patterns. Table 7 shows that there were no consistent or meaningful changes in race, ethnicity, gender, income, or age of adolescents seeking treatment for depression. Out of 40 coeffi cients, only two were signifi cant at p = 0.05. This suggests that our estimated effects of the FDA warnings are not explained by compositional changes in who is depressed.18
We also investigate whether there is evidence that the adolescents in the depressed group appear “more depressed” in the postperiod, a fi nding one would expect if the decline in antidepressant use occurred among marginal patients who were less se-verely depressed, and less likely to benefi t from antidepressants. To the extent that the depressed group was comprised of adolescents with more serious depression, this could generate our observed trends even if antidepressants had no effect on depres-sion or human capital outcomes. To assess this possibility, we look at the types of depression services that were used by the depressed adolescents. We do not fi nd any
18. As a rough check of the extent of compositional change needed to affect our results, we calculate what the pre-post change in depression would be for depressed girls if 10 percent of the depressed girls in the preperiod were switched into the nondepressed group and assume that the 10 percent had been the highest achieving. Even in that rather extreme scenario, the GPA difference between depressed and nondepressed girls does not grow enough to explain our main results.
Figure 6
Depression Status Over Time in the NSDUH
The Journal of Human Resources 566
Table 7
Specifi cation Check of Coeffi cients on “Depress*Post- FDA” in OLS Regressions of Covariates
All Females Males
Coeffi cient (Standard Error)
Coeffi cient (Standard Error)
Coeffi cient (Standard Error)
Age –0.008 0.076 –0.115
(0.067) (0.099) (0.158)
Race/ethnicity
Black –0.005 0.002 –0.015
(0.018) (0.024) (0.037)
Native American –0.009 –0.012 –0.003
(0.006) (0.010) (0.004)
Hawaiian/Pacifi c 0.003 0.004 0.001
Islander (0.003) (0.003) (0.004)
Asian 0.005 –0.007 0.023
(0.012) (0.011) (0.026)
Multiple race 0.007 0.010 0.001
(0.006) (0.006) (0.012)
Hispanic 0.031** 0.031 0.032
(0.015) (0.020) (0.033)
Family income
$10,000–$19,999 –0.007 0.003 –0.024
(0.027) (0.023) (0.043)
$20,000–$29,999 –0.008 –0.007 –0.020
(0.013) (0.014) (0.025)
$30,000–$39,999 0.004 0.023 –0.030
(0.017) (0.024) (0.028)
$40,000–$49,999 0.032* 0.018 0.054**
(0.016) (0.020) (0.026)
$50,000–$75,000 –0.008 –0.010 0.004
(0.023) (0.024) (0.049)
> $75,000 –0.030 –0.036 –0.013
(0.036) (0.045) (0.034)
Female –0.017 — —
(0.022)
Notes: Each cell shows the coeffi cient and standard error from a separate model. The outcome variable in each model is indicated by the row. The other independent variables in the model include dummies for depression, post-FDA, a time trend, the interaction of post-FDA*Time, the interaction of depression*Time, and three indicators for the quarter (2nd, 3rd, 4th) when a respondent completed the survey.
evidence of changes in the more serious forms of depression treatment (inpatient care and residential care), suggesting that compositional change in terms of depression severity is unlikely to explain our results (results available upon request).
A second factor to consider during this time period is whether we might be measur-ing a broader concern about all psychotropic medication. Several studies have exam-ined whether there were changes in use of antipsychotics or other psychotropic drugs (for instance, stimulants or benzodiazapines) (Libby et al. 2007; Nemeroff et al. 2007). None of these studies found changes in use of other psychotropic medications. We examined this possibility by computing the annual prevalence rate of stimulants in the MEPS and found no changes in use.
Finally, one may question how reasonable it is to fi nd effects for girls but not for boys. We turn to this next. One reason we might observe such a result could be that antidepressants are less effective to treat depression in males versus females. The clinical literature has evaluated the effects of various antidepressants by gender with mixed results. For example, a recent review of studies on sex differences in effects of antidepressants summarizes evidence both supporting and refuting differential
ef-fi cacy of antidepressants by sex (Marsh and Deligiannidis 2010). However, studies focused on SSRIs in larger patient populations, such as a study of citalopram in the Sequenced Treatment Alternatives to Relieve Depression, or STAR*D trial, docu-ment signifi cantly larger treatment effects among women relative to men (Young et al. 2009). Furthermore, differential effects of antidepressants by gender have been con-centrated among patients under age 50, leading some to hypothesize that hormonal activity affects the effi cacy of antidepressants (Thase et al. 2005). These differences are too small to explain the dramatic effects for girls versus boys, though. Our results are consistent with other observational studies comparing the outcomes of depressed adolescents to nondepressed adolescents. Papers by Fletcher and Ding and colleagues (Ding et al. 2009; Fletcher 2008), as well as earlier work (Berndt et al. 2000), found that high school graduation rates and grades were lower for girls with depression compared to girls without, but they did not fi nd similar results for boys. One piece of evidence that supports the notion that the FDA warnings were more important for girls than for boys is the evidence on suicides. The relative rise was large for girls, about 33 percent, and trivial among boys. This relationship merits further study.
A. Magnitude of Response to Antidepressants
The Journal of Human Resources 568
outcomes in response to the FDA induced decline in antidepressant use yield a crude estimate of the magnitude of the effect of antidepressants on grades, substance use, and delinquency, among adolescents aged 12 to 17 with probable depression.
In other words, among depressed girls, where the effects are concentrated, treatment with antidepressants increases grades by a full point (from a C to a B, for example), and reduces the chance of smoking and illicit drug use by 20 to 25 percentage points and the chance of stealing or fi ghting by even greater magnitudes (about 30 to 35 percent-age points). These suggest both large effects of untreated or undertreated depression as well as an impressive treatment effect of antidepressants in the community during the period leading up to advisories and warnings regarding antidepressants. However, one should use caution when interpreting the magnitude of results as the impact of taking an antidepressant versus no antidepressant. Among pediatric patients receiving an antidepressant within 30 days of a new diagnosis, Busch et al. (2010) documented a signifi cant decline in use of Paroxetine (20 percent to 5 percent from late 2003 through 2005) and a rise in Fluoxetine (13 percent to 28 percent over the same period). Fur-thermore, it is unclear whether the dosage of antidepressants may have changed in response. Thus, scaling our estimates by changes in the percent of adolescents treated with antidepressants may overstate the impact of antidepressants because our reduced form approach captures the total change in outcomes for all depressed adolescents, including those with changes in the type or intensity of antidepressant use.
VII. Conclusion
Few topics engender as much concern and controversy as treating chil-dren and adolescents with psychotropic drugs and academic achievement in the middle and high school years. Following the FDA’s 2004 decision to issue black box warnings on virtually all antidepressants based on safety concerns in children and adolescents, both of these changed. Prior evidence documents a decline in antidepressant use of 20 to 30 percent following the FDA warnings. We fi nd that academic achievement among depressed adolescent girls declined after the FDA warnings, falling roughly from a B to B– grade point average. This decline in grade point average did not occur among adolescents without a recent episode of probable depression. Academic outcomes were just one aspect of human capital affected by the warnings. Substance use and other delinquency measures increased among girls seeking treatment for depression as well. As noted in Section II, the decline in antidepressant use was driven by new episodes of depression. Hence, our results should be interpreted as effects of antidepressant use on human capital outcomes for adolescents with recent- onset depression.
the discussion did not consider the broader nonclinical costs (and benefi ts) of treating depression with antidepressants. More broadly, FDA decisions around pharmaceuti-cals exclusively consider clinical risks and benefi ts. Our evidence suggests that the FDA calculus does not account for potentially signifi cant nonclinical benefi ts of treat-ment that may be highly valued by consumers. The inclusion of such considerations could, in some cases, substantially affect the estimated net benefi ts of pharmaceuticals. Second, our fi ndings also confi rm research in very different settings suggesting that depression interferes with academic outcomes, especially for girls.
The third and most signifi cant innovation of this empirical work is that it suggests that treatment of depression can mitigate adverse effects of depression on both cognitive and noncognitive aspects of human capital among adolescents. Families, schools, and clini-cians devote signifi cant effort to help students with behavioral health issues because they interfere with academic outcomes. These fi ndings suggest that treatment of depression can improve both cognitive outcomes such as grades, as well as delinquent behaviors and the initiation of substance use, all of which are important aspects of human capital.
Our paper focuses on outcomes that occurred within one to 12 months of being sur-veyed, and thus they should be viewed as relatively short- run outcomes. Given contro-versy over the risks and benefi ts of antidepressants in the long run, our fi ndings do not suggest we should abandon other forms of treating depression. Rather, they suggest that depression affects economic outcomes, and thus successful treatments of depression yield potential benefi ts that reach far beyond the clinical outcomes typically measured.
References
Barry, Colleen L., and Susan H. Busch. 2010. “News Coverage of FDA Warnings on Pediatric Antidepressant Use and Suicidality.” Pediatrics 125(1):88–95.
Berndt, Ernst R., Lorrin M. Koran, Stan N. Finkelstein, Alan J. Gelenberg, Susan G. Kornstein, Ivan M. Miller, Michael E. Thase, George A. Trapp, and Martin B. Keller. 2000. “Lost Human Capital from Early- Onset Chronic Depression.” American Journal of Psychiatry
157(6):940–47.
Blanden, Jo, Paul Gregg, and Lindsey Macmillan. 2006. “Accounting for Intergenerational Income Persistence: Non- Cognitive Skills, Ability and Education.” Economic Journal
117(519):C43- C60.
Borghans, Lex, Angela Duckworth, James J. Heckman, and Bas ter Weel. 2008. “The Econom-ics and Psychology of Personality Traits.” Journal of Human Resources 43(4):972–1059. Bowles, Samuel, Herbert Gintis, and Melissa Osborne. 2001. “The Determinants of Individual
Earnings: Skills, Preferences and Schooling.” Journal of Economic Literature 39(4):1137–76. Breslau, Naomi, Edward L. Peterson, Lonni R. Schultz, Howard D. Chilcoat, and Patricia
Andreski. 1998. “Major Depression and Stages of Smoking. A Longitudinal Investigation.”
Archives of General Psychiatry 55(2):161–66.
Bridge, Jeffrey A., Joel B. Greenhouse, Arielle H. Weldon, John V. Campo, and Kelly J. Kelleher. 2008. “Suicide Trends among Youths Aged 10 to 19 Years in the United States, 1996–2005.” Journal of the American Medical Association 300(9):1025–26.
Busch, Alisa B., Haiden A. Huskamp, Sharon- Lise Normand, Alexander S. Young, Howard Goldman, Richard G. Frank. 2006. “The Impact of Parity on Major Depression Treatment Quality in the Federal Employees’ Health Benefi ts Program After Parity Implementation.”
Medical Care 44(6):506–12.