Full Terms & Conditions of access and use can be found at
http://www.tandfonline.com/action/journalInformation?journalCode=vjeb20
Download by: [Universitas Maritim Raja Ali Haji], [UNIVERSITAS MARITIM RAJA ALI HAJI
TANJUNGPINANG, KEPULAUAN RIAU] Date: 13 January 2016, At: 17:48
Journal of Education for Business
ISSN: 0883-2323 (Print) 1940-3356 (Online) Journal homepage: http://www.tandfonline.com/loi/vjeb20
Impact of Race on Business Students' Perceptions
of Business Careers
Susan Delvecchio , Thaddeus McEwen & Beryl C. McEwen
To cite this article: Susan Delvecchio , Thaddeus McEwen & Beryl C. McEwen (2001) Impact of Race on Business Students' Perceptions of Business Careers, Journal of Education for Business, 76:4, 199-208, DOI: 10.1080/08832320109601311
To link to this article: http://dx.doi.org/10.1080/08832320109601311
Published online: 31 Mar 2010.
Submit your article to this journal
Article views: 15
View related articles
Impact
of
Race on Business
Students’ Perceptions of
Business Careers
SUSAN DELVECCHIO
zyxwvutsrqponmlkjihgfedcbaZYXWVUTSRQPONMLKJIHGFEDCBA
East Carolina University
Greenville,
North CarolinaTHADDEUS McEWEN
BERYL C. McEWEN
North Carolina
A&T State University
zyxwvutsrqponmlkjihgfedcbaZYXWVUTSRQPONMLKJIHGFEDCBA
Greensboro, North Carolina emographers reported that 85% of
D
all new entrants to the workforce in 2000 would be members of a minori- ty group (American Demographics, 1997; U.S. Bureau of Labor Statistics, 1993). Because of this increased diver- sity in the workforce, interest in the impact of race on students’ business career perceptions has revived (DelVec-chi0
zyxwvutsrqponmlkjihgfedcbaZYXWVUTSRQPONMLKJIHGFEDCBA
& Honeycutt, 2000). Attracting more students from diverse racialgroups to business careers, and thus cre- ating a more diverse pool of business employees (Jamieson & O’Mara, 1991), has become a goal of both business aca- demicians and practitioners. To imple- ment programs to serve this purpose, business professionals must understand better how different groups perceive business careers.
In 1991 and 1995, the American Institute of Certified Public Accountants (AICPA) conducted two national stud- ies of students’ attitudes toward accounting as a career. Relying on their results, they launched a recruiting cam- paign to attract top-quality students to the accounting profession (Brown, 1994; Hermanson, Hermanson, &
Ivancevich, 1995). Two other national studies on students’ interest in business careers were carried out, by the Ameri- can Council on Education and Gamma Iota Sigma, a national collegiate insur-
ance fraternity (Hofmann, 1987;
zyxwvutsrqponmlkjihgfedcbaZYXWVUTSRQPONMLKJIHGFEDCBA
New
ABSTRACT. This study examined the degree to which racial differences affect business studtents’ perceptions of, and preferences for, several busi- ness career options. Because the con- ceptual and empirical literature is split on the effect that race has on a stu-
dent’s major selection, our study was exploratory. We used MANCOVA analysis to compare African American with Caucasian business students and found no racial differences in prefer- ence for accounting, finance, or mar- ket research careers. African Ameri- can students in this sample did express a higher preference for career paths in human research management. This difference held true even when the effects of age, academic standing, and work experience were statistically
controlled.
zyxwvutsrqponmlkjihgfedcbaZYXWVUTSRQPONMLKJIHGFEDCBA
York Times, 1991). In addition, studies were done on students’ interest in inter- national business, sales, management information systems, and production and operations management (DelVec- chi0 & Honeycutt, 2000; Desai &
Inman, 1994; Hill, Tillery, & Kenneth, 1992; Neubaum, 1997; Rifkin, 1987).
Conceptual writings on racial differ- ences in career choice and some empir- ical studies have generally indicated a lack of agreement on the impact of race on students’ perceptions of business careers (Borgen & Harper, 1973; Carter
& Swanson, 1990; Grant & Breese, 1997; Tomlinson & Evans-Hughes, 1991; Whetson & Hayes, 1975).
Because of the lack of consensus among scholars in the field, the quest for better understanding of the issue continues. The purpose of our study was to deter- mine if racial differences influence col- lege business students’ perceptions of business careers.
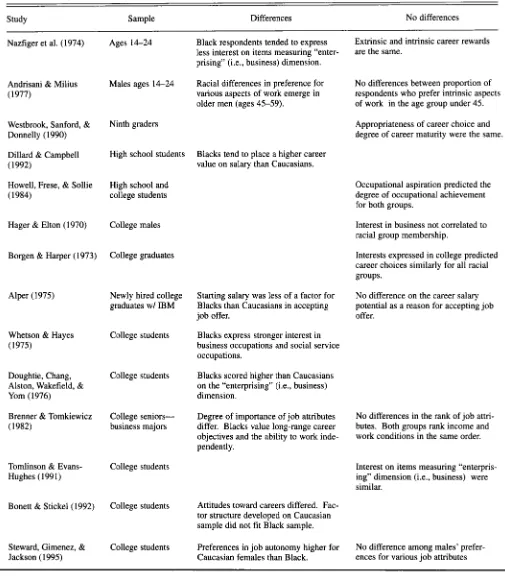
Not all researchers agree that racial differences in vocational preference are pervasive (see Table 1). One argument against race comparisons claims that a more important source of variability originates within rather than across racial groups (Cox & Nkomo, 1990; Nkomo, 1992). Not all members of any one racial group react similarly to their minority status, and this source of vari- ability is more meaningful than variance attributable to racial minority or majori- ty status (Grant & Breese, 1997). If these arguments apply to career choice, as some suggest they may, the appeal of various business careers (in accounting, finance, marketing, or management) may vary substantially from one Black student to another, or from one Cau- casian student to another-and may not be dependent on racial group member- ship. Conceptual arguments have been proposed both for and against the exis- tence of racial differences in business career perceptions.
The results from empirical studies are likewise mixed. In their review of voca- tional studies, Carter and Swanson
MarcWApril2001 199
TABLE 1. Summary of Race-Comparative Business Vocational Studies
zyxwvutsrqponmlkjihgfedcbaZYXWVUTSRQPONMLKJIHGFEDCBA
Study Sample Differences No differences
Ages 14-24 Black respondents tended to express less interest on items measuring “enter- prising” (i.e., business) dimension.
Extrinsic and intrinsic career rewards are the same.
Nazfiger et al. (1974)
Racial differences in preference for various aspects of work emerge in older men (ages 45-59).
No differences between proportion of respondents who prefer intrinsic aspects of work in the age group under 45.
Andrisani
zyxwvutsrqponmlkjihgfedcbaZYXWVUTSRQPONMLKJIHGFEDCBA
& Milius(1977)
Males ages 14-24
Westbrook, Sanford, &
Donnelly ( 1990) Dillard & Campbell
( 1992)
Howell, Frese, & Sollie (1984)
Ninth graders
High school students
High school and college students
College males
College graduates
Appropriateness of career choice and degree of career maturity were the same.
Blacks tend to place a higher career value on salary than Caucasians.
Occupational aspiration predicted the degree of occupational achievement for both groups.
Hager & Elton ( I 970) Interest in business not correlated to racial group membership.
Borgen & Harper (1973) Interests expressed in college predicted career choices similarly for all racial groups.
Alper (1 975) Newly hired college graduates w/ IBM
Starting salary was less of a factor for Blacks than Caucasians in accepting job offer.
No difference on the career salary potential as a reason for accepting job offer.
Whetson & Hayes (1975)
College students Blacks express stronger interest in business occupations and social service occupations.
Doughtie, Chang, Alston, Wakefield, &
Yom (1976)
College students Blacks scored higher than Caucasians on the “enterprising” (i.e., business) dimension.
Brenner & Tomkiewicz (1982)
College seniors- business majors
Degree of importance of job attributes differ. Blacks value long-range career objectives and the ability to work inde- pendently.
No differences in the rank of job attri- butes. Both groups rank income and work conditions in the same order.
Tomlinson & Evans- Hughes (1991)
College students Interest on items measuring “enterpris- ing” dimension (i.e., business) were similar.
College students Attitudes toward careers differed. Fac- tor structure developed on Caucasian sample did not fit Black sample. Bonett & Stickel (1992)
Steward, Gimenez, &
Jackson (1995)
College students Preferences in job autonomy higher for Caucasian females than Black.
No difference among males’ prefer- ences for various job attributes
(1990)
zyxwvutsrqponmlkjihgfedcbaZYXWVUTSRQPONMLKJIHGFEDCBA
concluded that Black respon- dents tend to express a higher level ofinterest
zyxwvutsrqponmlkjihgfedcbaZYXWVUTSRQPONMLKJIHGFEDCBA
in business occupations. Unfor-tunately, the studies reviewed by Carter and Swanson (1990) included respon- dents who had not graduated from col- lege and made no distinction between
200
types of business careers (i.e., account- ing, finance, marketing, or manage- ment). However, if the studies involving only college level respondents are con- sidered (see Table l), the conclusion that Blacks express a higher level of interest in business careers is not sup-
ported. In some studies, college educa- tion eliminates any racial differences
(Borgen & Harper, 1973; Hager &
Elton, 1970; Tomlinson & Evans-Hugh-
es, 1991). Still others indicate that racial differences exist among college-educat-
ed students (Whetson & Hayes, 1975).
zyxwvutsrqponmlkjihgfedcbaZYXWVUTSRQPONMLKJIHGFEDCBA
Journal of Education for
zyxwvutsrqponmlkjihgfedcbaZYXWVUTSRQPONMLKJIHGFEDCBA
Business [image:3.612.53.558.66.642.2]Research Questions
zyxwvutsrqponmlkjihgfedcbaZYXWVUTSRQPONMLKJIHGFEDCBA
Those who have found racial differ- ences claim that they exist because of the social experiences associated with being Black in America. Others claim that the experiences of members of a particular racial group can vary substan- tially. Despite the academic debate, some recruiters operate on the assump- tion that racial minorities find specific business careers less appealing. Because academic arguments are split and man- agerial practices are assumptive, in our study we questioned those assumptions. Exploratory Question 1: What, if any, are the differences between racial majority and racial minority students’ perceptions of business career options?
Lack of information may influence a minority group’s perception of various business careers. Studies at both the col- lege (Lucas, 1993) and high school lev-
els (Howell, Frese,
zyxwvutsrqponmlkjihgfedcbaZYXWVUTSRQPONMLKJIHGFEDCBA
& Sollie, 1984) have found that minority students felt thatthey lacked adequate career informa- tion. If, for example, the African Amer- ican managerial community holds sales in lower esteem than other career paths, any lack of career information may be especially crucial. We can create a more complete picture of racial differences by understanding and comparing students’ knowledge of job attributes and how it affects career choice. We discuss three job attributes: starting salary, autonomy, and required education level.
Though starting salary levels tend to be of primary importance to both Black and Caucasian students (Alper 1975; Brenner & Tomkiewicz, 1982; Nazfiger, Holland, Helms, & McPartland, 1974), both groups may not share the same knowledge base concerning salary lev- els. For example, Black students may lack occupational role models or work exposure (through internships, etc.) in a particular business area, which could affect their perception of starting sa- laries. Studies in vocational advising suggest that Black college students are more likely than their Caucasian coun- terparts to express concerns over acquir- ing and using career planning informa- tion (Hendricks, 1994).
If the exposure gained in college is equal across racial groups, then one might expect no racial differences in
perceived starting salary levels. If, how- ever, Black students are alienated from this college experience, racial differ- ences may emerge (McCollum, 1998). Because no study to date has provided solid empirical evidence to support either the existence or lack of such racial differences, in our study we posed the following research question:
Exploratory Question 2: What, if any,
zyxwvutsrqponmlkjihgfedcbaZYXWVUTSRQPONMLKJIHGFEDCBA
are the differences between racial majority and racial minority students’ estimates of starting salaries offered by business career options?
Though salary levels certainly take a priority in attracting students to sales, autonomy frequently is cited as a close second. Autonomy, or personal freedom, occupies an important role in general career choice (Pryor, 1987) and may take on even more importance in a race- comparative study, given the weight placed on it by Black college students in past studies. Black MBA students stud- ied by Nowell (1976) tended to be indi- vidually oriented and relied principally on their own resources. This tendency appeared in both graduates and under- graduates: Kane (1998) found that Blacks placed more importance on per- sonal autonomy than did other racial minority groups. This emphasis on autonomy does not stop at the college level but affects the priorities of the newly hired Black graduate (Brenner &
Tomkiewicz, 1982). Because of autono- my’s importance in career choice deci- sions, we examined students’ percep- tions of autonomy levels associated with various business careers (in accounting, finance, marketing, and management).
In their comparison of African Amer- ican and Caucasian college freshmen, Pelham and Fretz (1982) found that though all freshmen suffered from the same degree of career unrealism, Black students were more likely to score lower on scales measuring occupation- al information. Murry and Mosidi (1993) proposed that some of the caus- es may include a lack of culturally Val- idated predictive models and a lack of Black career counselors and mentors. If these obstacles are applicable at the college level, we might expect that racial differences exist in students’ assessments of job attributes. Still oth- ers contend that when socioeconomic
status and educational levels are held constant, racial differences are not sig- nificant (Hansen, 1987). Because of the contradictory evidence and the strong logic supporting both viewpoints, we posed our third question:
Exploratory Question 3: What, if any,
are the differences between racial majority and minority students’ percep- tions of the autonomy associated with various business career options?
One of the major issues concerning sales is the perception that this career choice lacks status and prestige. Occu- pational prestige is based on several factors, one of which is salary. The other factor indicating occupational prestige is the amount and level of edu- cation required (Parker, 1995). Results from previous research do indicate, however, that selecting a career that makes use of educational background is important to African Americans. Racial minorities rely on educational creden- tials to gain entrance into nontraditional careers. Black women who planned careers in male-dominated professions tended to plan more education than nec- essary (Murrell, Frieze, & Frost, 1991). This same rationale may be applicable to Black males majoring in business: Brenner and Tomkiewicz (1982) found that the students they studied would select an employer and career path based on the relevance of their educa- tional background. Not only do African Americans apparently seek employ- ment that uses their college education; they also use that education to over- come barriers. Studies by Cohen (1993) indicate that this occurs in public sector occupations more frequently than in private sector occupations (e.g., in accounting, finance, marketing, and management). This may imply that racial differences exist with respect to the importance or effectiveness of edu- cational requirements.
Though some authors contend that Blacks use academic achievement to gain entry to more prestigious and eco- nomically rewarding careers, still others claim that African American students have disengaged themselves from the education process (Ogbu, 1998). Ac- cording to this argument, African Amer- icans have responded to discriminatory
policies by mentally withdrawing and
zyxwvutsrqponmlkjihgfedcbaZYXWVUTSRQPONMLKJIHGFEDCBA
MarcWApril2001 201
reflect this withdrawal by characterizing the striving for academic success as cul- turally “subtractive” (Ogbu, 1998, p. 177). Ogbu’s cultural deficit model states that Black college students avoid careers in which educational advance- ment and achievement are required. Fur- ther, Ogbu argues that Black students may simply withdraw from occupation- al striving and not seek out accurate information concerning certain career paths. To examine both contentions- that Blacks use education to achieve and that they withdraw culturally from high- er achievement levels-we posed the following research question:
Exploratory Question 4: What, if any, are the differences between racial majority and minority students’ percep- tions of the education level required by
various business career options?
zyxwvutsrqponmlkjihgfedcbaZYXWVUTSRQPONMLKJIHGFEDCBA
Method
Our sampling frame consisted of stu- dents enrolled in two traditionally Black collegiate institutions (TBIs) and three
predominantly White institutions (PWIs).
zyxwvutsrqponmlkjihgfedcbaZYXWVUTSRQPONMLKJIHGFEDCBA
This appears to be an appropriate sample, because past research found no differ- ence between PWIs and TBIs in students’
career planning (Cheatham, Slaney,
zyxwvutsrqponmlkjihgfedcbaZYXWVUTSRQPONMLKJIHGFEDCBA
&Coleman, 1990; Kemp, 1990). All five participating universities were AACSB accredited, with enrollments of 18,000 or less, and located in the southeastern Unit- ed States. At each university, classes were divided into entry and advanced levels. Randomly selected sections of each divi- sion made up the sampling frame. Conse- quently, we were able to analyze respons- es from business students matriculating at or beyond the sophomore level and for whom career decisions were imminent and relevant. Instructors of the selected sections administered the survey during class time to those students present that day.
This collection method resulted in 597 completed surveys, 525 of which were usable. The unusable responses can be attributed to one of three cate- gories: (a) missing demographic infor- mation (31 cases); (b) missing answers to five or more nondemographic ques- tions (29 cases); and (c) an obvious lack of respondents’ consideration (i.e., 11 cases in which respondents rated all
202
zyxwvutsrqponmlkjihgfedcbaZYXWVUTSRQPONMLKJIHGFEDCBA
JournalzyxwvutsrqponmlkjihgfedcbaZYXWVUTSRQPONMLKJIHGFEDCBA
of Education for Businesscareers the same for every attribute throughout the survey). The effective response rate of usable surveys, there- fore, was 88%.
This sample included 250 responses from Caucasian students, 238 from African American students, and 37 from students from other racial or ethnic groups (such as Asian American or Native American). The African Ameri- can students were younger than their nonminority counterparts, with an aver- age age of 21 compared with 23 for the Caucasian students (see Table 2). Simi- larly, as seen in Table 2, more minority students were represented in the sopho- more and junior levels of matriculation.
Measures
The survey instrument included items that measured students’ perceptions of various careers. The career choices listed in this study included accounting, finan- cial analysis, marketing research, and human resource management. Students rated each career option on a 5-point,
Likert-type scale ranging from 1 (very
unappealing) to 5 (very appealing).
To provide a more precise measure of racial group differences regarding appeal, we included background factors believed to affect the appeal of business careers (in accounting, finance, market- ing, and human resource management) as covariates. These covariates included age, academic standing, grade point average, parental background, and internship experience. The strong effect of parental influence on career choice and aspirations has recently been emphasized (Chung, Loeb, & Gonzo, 1996; Osipow, 1990; Solorzano 1992).
Controlling for these five covariates allowed us to provide a more precise measurement of racial group differ- ences. For this information, respondents indicated the highest level of education achieved by each parent. If one or more parents attended college or had com- pleted a college degree, the respondent was not categorized as first-generation college. According to this categoriza- tion, 23% of the African American and
TABLE 2. Sample Demographics, in Percentages
Characteristic
African
( N = 238)
Caucasian (%) American
zyxwvutsrqponmlkjihgfedcbaZYXWVUTSRQPONMLKJIHGFEDCBA
(56)( N = 250) Type of school
Traditionally Black institution
zyxwvutsrqponmlkjihgfedcbaZYXWVUTSRQPONMLKJIHGFEDCBA
(TBI) 1 81Predominantly Caucasian institution (PWI) 99 19
Sophomore 2 5
Junior 41 48
Senior 56 47
Other 1 0
18-20 14 34
21-23 59 52
24-26 13 11
27-29 4 I
30-32 4 1
5 33 6 1
0-2.00 4 8
2.01-2.5 21 24
2.51-3.0 38 45
3.01-3.5 24 14
3.51-4.00 13 8
Neither attended college 16 23
Academic levela
Age*
Grade point average*
Parental education level*
College 84 77
“Served as covariate.
16% of the Caucasian respondents in our sample were deemed the first gener- ation in their family to attend college.
Respondents also evaluated the career choices in terms of perceived autonomy, salary, and education level. Students were asked to evaluate the degree to which each career allowed the employee freedom in making job-related deci- sions. The perceived salary ranges were measured through students’ estimates of the starting salary range for each of the listed careers (see Appendix A). The cat- egories of salary ranges were based on information provided by the National Association of Colleges and Employers
Salary Survey
zyxwvutsrqponmlkjihgfedcbaZYXWVUTSRQPONMLKJIHGFEDCBA
(1 996). Perceived educa- tion requirement was operationalized asthe highest level of education required for entrance into each of the listed occu- pations (Parker et al., 1995).
We compared the racial groups’ assessments of the four career areas through multiple analyses of variance (MANOVA). MANOVA was appropri- ate because this method controls for the correlations between dependent vari-
ables. In addition, MANOVA provides a
zyxwvutsrqponmlkjihgfedcbaZYXWVUTSRQPONMLKJIHGFEDCBA
single test of four careers and as such reduces the type 1 error rate (Hair, Anderson, & Tatham, 1987). The dependent variables were the appeal scores for the four careers, and the inde- pendent variable was racial group mem- bership. To obtain a more precise mea- sure of racial group differences regarding the appeal of careers, we also conducted a multiple analysis of covari- ance (MANCOVA). The effects of each covariate (age, academic standing, grade point average, internship experi- ence, and parents’ education) on the appeal of each career was adjusted through general linear regression meth- ods. To examine the potential effect of each covariate (and because it is highly likely that covariates will share a signif- icant intercorrelation), we conducted a separate MANCOVA for each covariate. Additional analyses, including MANO- VA, compared racial group perceptions of the salary, autonomy, and education
levels associated with the careers.
zyxwvutsrqponmlkjihgfedcbaZYXWVUTSRQPONMLKJIHGFEDCBA
Results
Exploratory Question 1 : What, if any, are the differences between racial
majority and minority students’ percep- tions of the appeal of various business career options?
The overall MANOVA statistics indi- cate that racial differences did exist
(overall MANOVA significant at the
zyxwvutsrqponmlkjihgfedcbaZYXWVUTSRQPONMLKJIHGFEDCBA
plevel of .0072) but only for one of the four business careers-human resource management. The appeal of human resource management was rated higher by African American students (AvgAA= 3.69 > AvgC = 3.39). The univariate ANOVA F statistic was 8.67 with an
associated p value of .0034. No differ- ences were found in the appeal of accounting, finance, or marketing career paths (see Table 3). The overall MANO- VA and the ANOVA clearly indicate that African American students in this sam-
ple found careers in human resource management more appealing than did their nonminority counterparts, and the MANOVA results held true when the effects of the covariates age, academic standing, and so forth, were controlled for. Each of the MANCOVA analyses showed that overall statistics were sig- nificant (at the .05 or less level), and these overall statistics were driven by the differences between each racial group’s rating of human resource management careers.
Exploratory Question 2: What, if any, are the differences between racial majority and minority students’ percep- tions of the starting salary offered by business career options?
Both the overall MANOVA and the
TABLE 3. Perceived Appeal of Business Careers
MANOVA: Appeal
zyxwvutsrqponmlkjihgfedcbaZYXWVUTSRQPONMLKJIHGFEDCBA
of career (Wilks’hmbda =zyxwvutsrqponmlkjihgfedcbaZYXWVUTSRQPONMLKJIHGFEDCBA
.9710, F = 3.55, p = ,0072)African
Caucasian American ANOVA
Average SD Average SD F-stat
zyxwvutsrqponmlkjihgfedcbaZYXWVUTSRQPONMLKJIHGFEDCBA
p valueAccounting 2.51 ,089 2.37 ,091 1.26 ,2621 Financial analysis 2.96 .086 2.90 .084 .23 ,6296 Market research 3.48 ,074 3.38 .082 .85 ,3578 Human resource management 3.39 .071 3.69 ,075 8.67 ,0034
MANCOVA: Appeal of career
MANCOVA results Comparison of MANCOVA Covariate Wilks F stat p value to MANOVA Age .9726 3.31 ,0108 Conclusions similar to MANOVA
Human resource management 3.69 > 3.38
African American > Caucasian Academic standing ,9865 3.84 ,0044 Conclusions similar to MANOVA
Human resource management 3.70 > 3.38
African American Caucasian Grade point average ,9735 3.10 .0155 Conclusions similar to MANOVA
Human resource management 3.66 > 3.37
African American > Caucasian Internship experience .9693 3.75 ,0052 Conclusions similar to MANOVA
Human resource management 3.70 > 3.38
African American > Caucasian Parental education .9741 3.15 ,0142 Conclusions similar to MANOVA
Human resource management 3.68 > 3.40
African American > Caucasian
M a r c W A p r i l 2 0 0 1 203
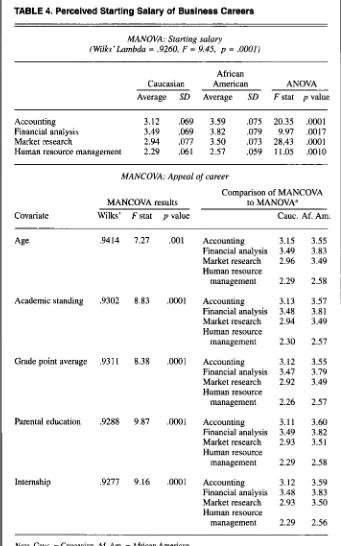
univariate ANOVA results indicate dif- ferences between racial minority and majority students’ assessments of start- ing salary levels. These differences applied to all four business career areas and went in the same direction: Racial minority students tended to rate the busi- ness careers as offering higher starting salaries. Because Black students in this sample estimated higher starting salaries for human resource management than did Caucasian students (see Table 4), these results may shed light on why African American students may find careers in management more appealing. The MANOVA results were un- changed when the averages were adjust- ed for age, academic standing, GPA, internship experience, and parental edu- cation level.
Exploratory Question 3: What, if any,
zyxwvutsrqponmlkjihgfedcbaZYXWVUTSRQPONMLKJIHGFEDCBA
are the differences between racial majority and minority students’ percep- tions of the autonomy offered by busi- ness career options?
A different pattern emerges concern- ing perceived autonomy levels. The overall MANOVA statistics indicated racial differences on this question, and
the univariate
zyxwvutsrqponmlkjihgfedcbaZYXWVUTSRQPONMLKJIHGFEDCBA
F statistics showed thisdifference in the overall comparison to be attributable to one career path, finan- cial analysis. Racial majority students tended to believe that more autonomy was offered by this career path (average 2.86) than did African American stu- dents (see Table 5). The individual ANOVAs indicated the group differ- ences to be significant at the .0016 level. Unlike salary levels (which Black students rated as higher than did Cau- casian students), autonomy levels of finance careers were rated lower by Black students than by their racial majority counterparts. Adjusting for the five covariate effects led to the same racial difference in the same direction.
Exploratory Question 4: What, if any, are the differences between racial majority and minority students’ percep- tions of the education level required by business career options?
Similarly to the results regarding per- ceived autonomy and appeal levels, the overall MANOVA regarding required educational level was significant and was driven by differences in just one of the four business careers-market
research in this case. Caucasian students tended to rate the required education level for market research positions lower than did racial minorities. The average education level estimated for market research was 2.89 for African
American respondents and 2.67 for Caucasian students. Both groups shared similar perceptions of the required edu-
cation levels for accounting, finance, and management. These MANOVA results were the same when the five covariates were considered (separately, as noted in Table 6).
Three interesting patterns emerge from these three sets of MANOVAs. First, when differences existed, the pat-
terns were unaltered by any covariate.
zyxwvutsrqponmlkjihgfedcbaZYXWVUTSRQPONMLKJIHGFEDCBA
TABLE 4. Perceived Starting Salary of Business Careers
MANOVA: Starting
zyxwvutsrqponmlkjihgfedcbaZYXWVUTSRQPONMLKJIHGFEDCBA
salary(Wilks’hmbda =
zyxwvutsrqponmlkjihgfedcbaZYXWVUTSRQPONMLKJIHGFEDCBA
zyxwvutsrqponmlkjihgfedcbaZYXWVUTSRQPONMLKJIHGFEDCBA
.9260,zyxwvutsrqponmlkjihgfedcbaZYXWVUTSRQPONMLKJIHGFEDCBA
F = 9.45, p = .OOOl)African
Caucasian American ANOVA Average SD Average SD F stat p value Accounting 3.12 .069 3.59 .075 20.35 .0001 Financial analysis 3.49 .069 3.82 ,079 9.97 ,0017 Market research 2.94 .077 3.50 .073 28.43 .0001
Human resource management 2.29 .061 2.57 .059 11.05 .0010
MANCOVA: Appeal of career
Comparison of MANCOVA MANCOVA results to MANOVA” Covariate Wilks’ F stat p value Cauc. Af. Am.
Age .9414 7.27
Academic standing .9302 8.83
Grade point average .9311 8.38
Parental education .9288 9.87
Internship .9277 9.16
.001
.0001
.0001
.oO01
.0001
Accounting Financial analysis Market research Human resource management
Accounting Financial analysis Market research Human resource management
Accounting Financial analysis Market research Human resource management
Accounting Financial analysis Market research Human resource management
Accounting Financial analysis Market research Human resource management
3.15 3.49 2.96
2.29
3.13 3.48 2.94
2.30
3.12 3.47 2.92
2.26
3.11 3.49 2.93
2.29
3.12 3.48 2.93
2.29 3.55 3.83 3.49
2.58
3.57 3.81 3.49
2.57
3.55 3.79 3.49
2.57
3.60 3.82 3.5 1
2.58
3.59 3.83 3.50
2.56
Nore. Cauc. = Caucasian. Af. Am. = African American.
aMeans adjusted for covariate.
204 Journal of Education for Business
[image:7.612.225.566.171.717.2]TABLE 5. Perceived Autonomy of Business Careers
zyxwvutsrqponmlkjihgfedcbaZYXWVUTSRQPONMLKJIHGFEDCBA
MANOVA: Autonomy
(Wilks'hmbda
zyxwvutsrqponmlkjihgfedcbaZYXWVUTSRQPONMLKJIHGFEDCBA
=zyxwvutsrqponmlkjihgfedcbaZYXWVUTSRQPONMLKJIHGFEDCBA
.9710,zyxwvutsrqponmlkjihgfedcbaZYXWVUTSRQPONMLKJIHGFEDCBA
F = 3.55, p = .0072)zyxwvutsrqponmlkjihgfedcbaZYXWVUTSRQPONMLKJIHGFEDCBA
African
Caucasian American ANOVA
Average
zyxwvutsrqponmlkjihgfedcbaZYXWVUTSRQPONMLKJIHGFEDCBA
SD Average SD Fstat p value Accounting 2.25 ,048 2.38 ,068 1.66 .1987Financial analysis 2.86 ,068 2.59 .063 10.12 .0016 Market research 3.37 .059 3.31 .066 .33 S652 Human resource management 3.04 .062 3.11 .054 .44 SO54
MANCOVA: Autonomy
MANCOVA results Comparison of MANCOVA
zyxwvutsrqponmlkjihgfedcbaZYXWVUTSRQPONMLKJIHGFEDCBA
to MANOVA" Covariate Wilks' F stat p value
Age .9653 4.19 .0025 Conclusions same as MANOVA Financial analysis 2.86 > 2.59 Academic standing .9606 4.80 .0008 Conclusions same as MANOVA Financial analysis 2.86 > 2.59 Grade point average .9636 4.28 .0021 Conclusions same as MANOVA Financial analysis 2.87 > 2.59 Parental education .9624 4.58 .0012 Conclusions same as MANOVA Financial analysis 2.86 > 2.59 Internship .9579 5.18 . O O M Conclusions same as MANOVA Financial analysis 2.87 > 2.58
Caucasian > African American Caucasian > African American Caucasian > African American Caucasian > African American Caucasian > African American
"Means adjusted for covariate.
When the effects of age, academic standing, grade point average, intern- ship, and parental education were con- trolled empirically, the results were sim- ilar. The second interesting pattern concerns perceived appeal, autonomy, and education levels. In all of the cases, only one of the four careers was per- ceived differently by a racial group. In all of these analyses, only one career was so strongly different that it affected the overall MANOVA results. Not only were the univariate F s significant (as
one may expect), but this one compari- son was strong enough that it caused the overall MANOVA (i.e., a comparison of four simultaneous dependent variables) to be significant. Finally, the third pat- tern indicates that racial minorities tend- ed to rate the appeal and starting salary
of some careers higher than did their racial majority counterparts-but the reverse was true for perceived autono- my level. We discuss the implication of these patterns.
Conclusions and Discussion
Our findings suggest that African American and Caucasian students do not differ regarding how appealing or unappealing they find the majority of business careers. Thus, the cultural deficit model supporting racial differ- ences in career aspirations (Ogbu,
1988) is not applicable. In fact, the
assumption that African Americans find business careers less appealing can undermine efforts to provide equal access to career opportunities. Our
study's finding is of major importance to recruiters who otherwise may (a) bypass qualified minority candidates who they expect will respond negative- ly or (b) provide them with unnecessary or condescending information. It is far too easy to attribute differences in recruitment practices to a lack of inter- est on the part of the candidate. It is more complex and even uncomfortable to question the assumptions we make about college recruits.
Black students in this sample were aware of the benefits offered by a busi- ness career in the areas examined. Black students rated all four business areas as offering a higher starting salary and one of them as requiring a higher level of education, compared with their nonmi- nority counterparts. These higher rat- ings persisted even when the effects of grade point average and work experi- ence were controlled. Students attend- ing traditionally Black institutions may be gaining exposure to a wider array of both formal and informal sources of information concerning professional selling and other business careers (through alumni networks, on-campus recruiting, and mentoring programs). As a result, their perceptions of positive job attributes in these areas may have been heightened. Our results run counter to the perception of the Black college stu- dent as harboring negative images of a business career.
Though Black students in this sample rated salary and educational require- ment levels higher than their Caucasian counterparts did, fewer differences were found in perceived autonomy levels. In the few instances in which Black stu- dents' perceptions differed in this area, they tended to rate autonomy levels as lower. This suggests that the students may not be fully aware of the challenges and everyday realities in the accounting, finance, and marketing career paths. If racial minority students are relying on the alumni and student network, they may be well aware of the education needed to enter a business career and of the starting salaries but may be less informed about what occurs after the job offer is accepted.
Providing both Black and Caucasian students with a more realistic picture of the challenges and benefits regarding
MarcWApril2001 205
TABLE 6. Perceived Education Requirement Level of Business Careers
zyxwvutsrqponmlkjihgfedcbaZYXWVUTSRQPONMLKJIHGFEDCBA
MANOVA:
zyxwvutsrqponmlkjihgfedcbaZYXWVUTSRQPONMLKJIHGFEDCBA
Education level(Wilks’hmbdu =
zyxwvutsrqponmlkjihgfedcbaZYXWVUTSRQPONMLKJIHGFEDCBA
zyxwvutsrqponmlkjihgfedcbaZYXWVUTSRQPONMLKJIHGFEDCBA
,9697, FzyxwvutsrqponmlkjihgfedcbaZYXWVUTSRQPONMLKJIHGFEDCBA
= 3.62, p = .0065) AfricanCaucasian American ANOVA Average SD Average SD Fstat p value Accounting 2.88 ,039 2.85 .038 .25 .6200
Financial analysis 3.07 .034 3.00 .039
zyxwvutsrqponmlkjihgfedcbaZYXWVUTSRQPONMLKJIHGFEDCBA
1.58 ,2087Market research 2.67 .046 2.89 .045 11.07 .0009 Human resource management 2.37 .048 2.44 .052 .84 .3600
MANCOVA: Education level
MANCOVA results Comparison of MANCOVA Covariate Wilks’ F stat p value to MANOVAa Age .9687 3.69 .0057 Conclusions same as MANOVA
Market research 2.89 > 2.69 African American > Caucasian Academic standing ,9708 3.45 .0086 Conclusions same as MANOVA
Market research 2.44 > 2.37 African American > Caucasian Grade point average .9650 4.028 .0032 Conclusions same as MANOVA
Market research 2.45 > 2.37 African American > Caucasian Internship .9741 3.0617 .0165 Conclusions same as MANOVA
Market research 2.88 > 2.68 African American > Caucasian Parental education .9681 3.8012 ,0047 Conclusions same as MANOVA
Market research 2.44 > 2.38 African American > Caucasian
“Means adjusted for covariate
autonomy in business careers in general should be a continuing goal.
Limitations and Future Research Directions
Though this study compared the per- ceptions of racial minority and majority students and provided information to dispel erroneous assumptions, it does, like any inquiry, raise yet other ques- tions. If Black students rate business jobs’ positive attributes higher, then why do they not also rate their appeal higher? One possibility is that these job attributes do not carry the same weight for Black students as for Caucasians. Evaluating the different utility functions across racial groups, though beyond the scope of this study, may offer some explanations. The level of starting
206 Journal of Education for Business
salary or required education may simply not play as important roles in Black stu- dents’ career choices. Some studies sug- gest that racial minority students’ career choices are influenced by a desire to “give back to the community” (Steward, Gimenez, & Jackson, 1995). We used a different, and perhaps more ethnocen- tric, model to originate the attributes in this study. Expanding the attributes to include those that may be more relevant to racial minorities and testing for the effects of cultural or racial differences in utility functions would be a promis- ing area of inquiry.
The sampling frame was designed to identify students for whom the career choice was imminent. The perceptions of junior and senior level business stu- dents at this point in their careers pro- vided insight into how business students
would soon react to decision options. This gain in realism, of course, comes at a cost. The cost, for example, may include the students’ lack of understand- ing of how the industrial product sales environment differs from that of con- sumer products or of the demands sur- rounding international sales. If this problem existed, it is unlikely that it was more pronounced with one racial group than another. The inclusion of covari- ates (such as level of marketing course and attending special seminars) in such studies should reflect any differences in a student’s ability to accurately describe one type of sales.
The majority of racial minority stu- dents in this sample attended one of two traditionally Black institutions, and future studies should compare the per- ceptions of minority students attending TBIs with those of minority students at more heterogeneous educational institu- tions. Though the career aspirations of African American students at TBIs and at more heterogeneous instituions are similar (Dillard & Campbell, 1982), approximately 27% of all African American students in higher learning attend traditionally Black institutions. Thus, one limitation of this study may rest with possible differences between these two groups. Though Mitchell and Fandt (1995) found few career choice differences, they did find that students attending TBIs scored higher on self- esteem scales than did African Ameri- can students at other institutions. To the degree that self-esteem increases self- efficacy and confidence, one might expect that African American students at traditionally Black schools would feel that their opportunities are not curtailed by their minority status, and thus would be more aware of career options and hold preferences similar to those of other racial groups.
Summary
Racial differences may exist, but not in the expected areas. Black students do not find business careers in accounting, finance, or market research any more or less appealing than their Caucasian counterparts do. However, our results indicate that human resource manage- ment occupies a better image among
African American students than previ- ously assumed. Unfortunately, re- searchers have little in the way of devel- oped conceptual models to use in finding the reason for such a difference. Given the importance of demographic diversity in the workforce, the lack of theoretical basis for examining the
effect
zyxwvutsrqponmlkjihgfedcbaZYXWVUTSRQPONMLKJIHGFEDCBA
of race on vocational choices(Cook 1991; Osipow, 1990) is surpris- ing. Results of this study suggest that theories concerning career stages may be useful because racial differences tended to be less pronounced when the
age of the respondent was considered.
zyxwvutsrqponmlkjihgfedcbaZYXWVUTSRQPONMLKJIHGFEDCBA
REFERENCES
Alper, S . W. (1975). Racial differences in job and work environment priorities among newly hired
college graduates.
zyxwvutsrqponmlkjihgfedcbaZYXWVUTSRQPONMLKJIHGFEDCBA
JournalzyxwvutsrqponmlkjihgfedcbaZYXWVUTSRQPONMLKJIHGFEDCBA
of Applied Psychol- ogy, 60(1), 132-134.American Demographics. (1997). American diversity. American Demographics Magazine, /9(9), 12-13.
Andrisani, P. J.,
zyxwvutsrqponmlkjihgfedcbaZYXWVUTSRQPONMLKJIHGFEDCBA
& Milius, R. C. (1977). Individ- ual differences in preferences for intrinsic ver-sus extrinsic aspects of work. Journal
zyxwvutsrqponmlkjihgfedcbaZYXWVUTSRQPONMLKJIHGFEDCBA
of Voca- tional Behavior, / / ( I ) , 14-30.Bonett, R. M., & Stickel, S. A. (1992). A psycho- metric analysis of the career attitude scale.
Measurement and Evaluation in Counseling
and Development,
zyxwvutsrqponmlkjihgfedcbaZYXWVUTSRQPONMLKJIHGFEDCBA
25( I), 14-26.Borgen, F. H., & Harper, G. T. (1973). Predictive validity of measured vocational interest with Black and Caucasian college men. Measure-
ment and Evaluation in Guidance, 6( I), 24-27.
Brenner, 0. C., & Tomkiewicz, J. (1982). Job ori- entation of Black and Caucasian college gradu- ates in business. Personnel Psychology, 35( I), Brown, M. H. (1994). Diversity of career options is focus of recruitment program. Ohio CPA
Journal, 53(2), 9-18.
Carter, R. T., & Swanson, J. L. (1990). The valid- ity of the Strong Interest Inventory with Black Americans: A review of the literature. Journal
of Vocational Behavior, 36(2), 195-209.
Cheatham, H. E., Slaney, R. B., & Coleman, N. C. (1990). Institutional effects on the psychosocial development of human resource mgr. college students. Journal of Counseling Psychology,
37(4), 453458.
Chung, Y. B., Loeb, J. W., & Gonzo, S. T. (1996). Factors predicting the educational and career aspirations of Black college freshmen. Journal
of Career Development, 23(2), 127-135.
Cohen, A. J. (1993). Predictors of public or private employment for business college graduates.
Public Personnel Management, 22(1), 167-1 86. Cook, E. P. (1991). Annual review: Practice and research in career counseling and development, 1990. Career Development Quarterly, 40(4), 99-1 3 1.
Cox, T., Jr., & Nkomo, S. M. (1990). Invisible men and women: A status report on race as a variable in organization behavior research.
Journal of Organizational Behavior. 11(9), 419431.
DelVecchio, S., & Honeycutt, E. D., Jr. (2000). An investigation of African-American perceptions of sales careers. The Journal of Personal Sell- 89-103.
ing and Sales Management, 20(1), 43-52. Desai, K., & Inman, A. R. (1994). Student bias
against POM coursework and manufacturing.
International Journal of Operations and Man- agement, /4(8), 70-88.
Dillard, J. M., & Campbell, N. J. (1992). Career values and aspirations of adult female and male Puerto Ricans, Blacks, and Anglos. Journal of
Employment Counseling, /9(4), 163-170. Doughtie, E. B., & Chang, W. C.,. Alston, H. L.,
Wakefield, J. A., Jr., & Yom, B. L. (1976). Black-White differences on the Vocational Preference Inventory. Journal of Vocational
Behavior, &February), 4 1 4 4 .
Gottfredson, L. S. (1981). Circumscription and compromise: A developmental theory of occu- pational aspirations. Journal of Counseling
Psychology Monograph, 28, 545-579. Grant, K. G., & Breese, J. R. (1997). Marginality
Theory and the human resource manager stu- dent. Sociology of Education, 70(3), 192-205. Hager, P. C., & Elton, C. F. (1970). The vocation-
al interest of Black males. Journal of Vocation-
al Behavior; 1(2), 153-158.
Hair, 1. F., Jr., Anderson, R. E., & Tatham, R. L. (1987). Multivariate data analysis (2nd ed.). New York: Macmillan.
Hansen, J. C. (1987). Cross-cultural research on vocational interests. Measurement and Evalua-
tion in Counseling and Development, 19( I), 163- 176.
Hendricks, F. (1994). Career counseling with human resource manager college students.
Journal of Career Development, 2/(2), 117-126.
Hermanson, D. R., Hermanson, R. H., & Ivance- vich, S. H. (1995). Are America’s top business students steering clear of accounting? Ohio
CPA Journal, 54(2), 2 6 3 3 .
Hill, C., Tillery, J., & Kenneth, R. (1992). What do male/female perceptions of an international business career suggest about recruitment poli- cies. S. A. M. Advanced Management Journal,
57(4), 10-17.
Hofmann, M. A. (1987). Frat fosters interest in insurance. Business Insurance, 2/(41), 30. Howell, F. M., Frese, F., & Sollie, C. R. (1984).
The measurement of perceived opportunity for occupational attainment. Journal of Vocational
Behavior, 25(3), 325-343.
Jameison, D., & O’Mara, J. (1991). Managing
workforce 2000: Gaining the industry advan-
tage. San Francisco: Jossey-Bass.
Kane, C. M. (1998). Differences in family of ori- gin and perceptions among human resource manager Asian-American and Euro-American students. Journal of Black Studies, 29(1), Kemp, A. D. (1990). From matriculation to grad-
uation: Focusing beyond minority retention.
Journal of Multicultural Counseling and Devel- opment, /8(3), 144-149.
Lucas, M. S. (1993). Personal, social, academic and career problems expressed by minority col- lege students. Journal of Multicultural Coun-
seling and Development, 2/(1), 2-13.
McCollum, V. J., 1998). Career development issues and strategies for counseling African Americans. Journal of Career Development, Mitchell, G., & Fandt, P. (1995). Examining the relationship between role-defining characteris- tics and self-esteem of college students. College
Student Journal, 29( I), 9 6 1 0 2 .
Murrell, A. J., Frieze, I. H., & Frost, J. L. (1991). Aspiring to careers in male- and female-domi- nated professions: A study of Black and Cau- 93-105.
25(1), 41-52.
casian college women. Psychology of Women Quarterly, 15, 103-126.
Muny, E., & Mosidi, R. (1993). Career develop- ment counseling for African Americans: An appraisal of the obstacles and intervention strategies. Journal of Negro Education, 62(4), 441-447.
National Association of Colleges and Employers’ Salary Survey. (1996, September). Washington, DC: Author.
Nazfiger, D. H., Holland, J. L., Helms, S. T., &
McPartland, J. M. (1974). Applying an occupa- tional classification to the work histories of
young men and women. Journal
zyxwvutsrqponmlkjihgfedcbaZYXWVUTSRQPONMLKJIHGFEDCBA
of Vocational Behavior, 5(3), 33 1-345.Neubaum, D. 0. (1997). Career preparation for international careers. Is there any progress?
International Journal of Management, / 4 ( I ),
140-1 45.
New York Times. (1991, January 29). Survey of college freshmen finds a shift in priorities. New
York Times Current Events Edition, p. A18. Nkomo, S. M. (1992). The emperor has no
clothes: Rewriting “Race in Organizations.”
Academy of Management Review, /7(3), 487-5 13.
Nowell, G. (1976). A study of Black students and their experiences in the “Careersfor Blacks in Management Program.” PhD Dissertation, The University of Chicago.
Ogbu, J. (1998). Class stratification, racial stratifi- cation, and schooling. In L. Weis (Ed.), Class,
race and gender in American education (pp. 163-182). New York: State University of New York Press.
Osipow, S . H. (1990). Convergence in theories of career choice and development: Review and prospect. Journal of Vocational Behavior, Parker, H. J., Cunningham, J., Chan, F., Thomas, K. R., Kaskel, L. M., & Kates, D. (1995). Pres- tige ratings of contemporary occupations: Per- ceptions of high school students and implica- tions for counselors. The School Counseloc 43(September), 19-28.
Pelham, J. P.,
zyxwvutsrqponmlkjihgfedcbaZYXWVUTSRQPONMLKJIHGFEDCBA
& Fretz, B. R. ( 1982). Racial differ- ences and attributes of career choice unrealism.The Vocational Guidance Quarterly, 3 / ( I) ,
3 6 4 2 .
Pryor, R. G. L. (1987). Differences among differ- ences: In search of general work preference dimensions. Journal of Applied Psychology,
72(3), 4215433.
Rifkin, G . (1987). Top students shunning MIS.
Computerworld, 2 / ( 14). 1.
Sanders, M. G. (1997). Overcoming obstacles: Academic achievement as a response to racism and discrimination. Journal of Negro Educa-
tion, 66(1), 83-93.
Solorzano, D. G. (1992). An exploratory analysis of the effects of race, class, and gender on stu- dent and parent mobility aspirations. Journal of Negro Education, 6/(1), 30-44.
Steward, R. J., Gimenez, M. M., & Jackson, J. D. (1995). A study of personal preferences of suc- cessful university students as related to race/ethnicity and sex: Implications and recom- mendations for training, practice and future research. Journal of College Student Develop-
ment, 36(2), 123-131.
Tomlinson, S. M., & Evans-Hughes, G. (1991). Gender, ethnicity and college students’ respons- es to the Strong-Campbell Interest Inventory.
Journal of Counseling & Development, 70( I ),
151-155.
U. S. Bureau of Labor Statistics. (1 993). Sratisrical
report on employment. Washington, DC: Author.
36(2), 122-131.
MarcWApril2001 207
Westbrook, B. W., Sanford, E. E.,
zyxwvutsrqponmlkjihgfedcbaZYXWVUTSRQPONMLKJIHGFEDCBA
& Donnelly, M.H. (1990). The relationship between career maturity test scores and appropriateness of
career choices: A
zyxwvutsrqponmlkjihgfedcbaZYXWVUTSRQPONMLKJIHGFEDCBA
replication. JournalzyxwvutsrqponmlkjihgfedcbaZYXWVUTSRQPONMLKJIHGFEDCBA
of Voca-tional Behavior, 36(1), 20-32.
Whetson, R. D., & Hayes, V. R. (1975). The
zyxwvutsrqponmlkjihgfedcbaZYXWVUTSRQPONMLKJIHGFEDCBA
SVIB and Black college men. Measurement andEvaluation in Guidance, 8(2), 105-109
APPENDIX A. Measures of Students’ Perceptions of Business Careers
Education
Indicate the highest level of education required for entrance into the listed occupations with a check mark. The required education level is the minimal level needed to successfully enter each occupation.
Completed Associate degree Undegraduate degree Graduate degree Listed careers include: high school ( 2 years undergraduate) (BA or BS) (e.g., master’s) Accounting
Financial analysis Market research
Human resource management
Autonomy
What is your personal opinion concerning the degree to which each occupation allows the employee freedom in making job-related decisions (such as scheduling their time, selecting a method of performing tasks, setting priorities, etc.)? Please circle the value that best gives your own personal opinion of the autonomy or personal freedom each occupation would offer on a scale ranging through 1
(very little freedom), 2 (below average freedom), 3 (average freedom), 4 (above average freedom), and 5 (very high levels of freedom). Salary
check the column you feel best represents the range for the starting salary.
What would you estimate as the average starting salary ranges for entry-level positions for each of the following occupations? Please
$20,000-
zyxwvutsrqponmlkjihgfedcbaZYXWVUTSRQPONMLKJIHGFEDCBA
$25,000- $30,000- $35,000- $40,000-Career: < $20,000 $25,000 $30,000 $35,000 $40,000 $45,000 > $45,000
Covariate Scaling of covariate Age
Academic standing
Grade point average 0-4.0
Internship Parent’s education
See Table 2 for ranges
Freshman to senior (undergraduate)
0 = No internship position held. 1 = Internship position held.
1 = Neither parent’s education exceeds completion of high school. 2 = One or more parents have attended college.